Today we take a look at a farm related play TSCO, which was a former leader and is attempting to get its mojo back as it has rebounded more than 20% the last 2 months. We are strict technicians here, but this new administration has said it will take care of its farmers and that cold play directly into the hands of this name. On the weekly chart it looks to be breaking ABOVE a bearish head and shoulders pattern whose trigger aligned with the round 60 number beginning in July '13 and breaking below it the week ending 5/19. The longer it can remain above 60 the better, and it does look to have broken above a bull flag trigger at 60 last week, but this occurred below the 200 day SMA. Directly below is the chart how it appeared in our Thursday 8/3 Game Plan and the second chart below takes a current view.
Stocks that can be bought after big bullish trend changes are TSCO. TSCO is a specialty retail play lower by 27% YTD and 39% over the last one year period and sports a dividend yield of 1.9%. Earnings have been mixed with gains of 7.7 and 1.8% on 7/27 and 2/2 and losses of 4.8 and 3.5% on 4/27 and 10/20. The stock is on a current 3 week winning streak higher by nearly 11% and the week ending 7/28 was accompanied by huge volume, the third largest in the last years. To be balanced this name lost ground 20 of 30 weeks ending between 12/16/16-7/7 and is presently 40% off most recent 52 week highs. TSCO did bounce nicely off the very round 50 number in early July and recouped its 50 day SMA for the first time in 6 months last week. Enter at 54.75.

Trigger TSCO 54.75. Stop 52.55.
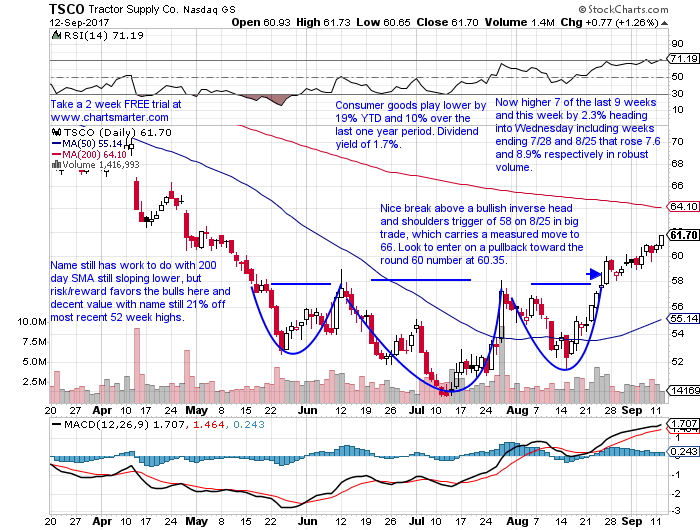
Taking a present view of TSCO it is now higher 7 of the last 9 weeks and this week by 2.3% heading into Wednesday, and up nearly 13% from the chart above. The stock is now lower by 19% YTD and 10% over the last one year period. And we like to say that trends are more likely to persist than reverse, but this name looks to have overturned its downtrend. Price action seems to confirm this beginning with the week ending 7/14 which bounced off the very round 50 number and the weeks ending 7/28 and 8/25 rose 7.6 and 8.9% respectively in robust volume. On the daily chart one can see the break above a bullish inverse head and shoulders trigger of 58 which carries a measured move to 66. Look to enter on a pullback toward the round 60 number at 60.35.
If you liked what you read why not visit www.chartsmarter.com.
Today we take a look at a farm related play TSCO, which was a former leader and is attempting to get its mojo back as it has rebounded more than 20% the last 2 months. We are strict technicians here, but this new administration has said it will take care of its farmers and that cold play directly into the hands of this name. On the weekly chart it looks to be breaking ABOVE a bearish head and shoulders pattern whose trigger aligned with the round 60 number beginning in July '13 and breaking below it the week ending 5/19. The longer it can remain above 60 the better, and it does look to have broken above a bull flag trigger at 60 last week, but this occurred below the 200 day SMA. Directly below is the chart how it appeared in our Thursday 8/3 Game Plan and the second chart below takes a current view.
Stocks that can be bought after big bullish trend changes are TSCO. TSCO is a specialty retail play lower by 27% YTD and 39% over the last one year period and sports a dividend yield of 1.9%. Earnings have been mixed with gains of 7.7 and 1.8% on 7/27 and 2/2 and losses of 4.8 and 3.5% on 4/27 and 10/20. The stock is on a current 3 week winning streak higher by nearly 11% and the week ending 7/28 was accompanied by huge volume, the third largest in the last years. To be balanced this name lost ground 20 of 30 weeks ending between 12/16/16-7/7 and is presently 40% off most recent 52 week highs. TSCO did bounce nicely off the very round 50 number in early July and recouped its 50 day SMA for the first time in 6 months last week. Enter at 54.75.
Trigger TSCO 54.75. Stop 52.55.
Taking a present view of TSCO it is now higher 7 of the last 9 weeks and this week by 2.3% heading into Wednesday, and up nearly 13% from the chart above. The stock is now lower by 19% YTD and 10% over the last one year period. And we like to say that trends are more likely to persist than reverse, but this name looks to have overturned its downtrend. Price action seems to confirm this beginning with the week ending 7/14 which bounced off the very round 50 number and the weeks ending 7/28 and 8/25 rose 7.6 and 8.9% respectively in robust volume. On the daily chart one can see the break above a bullish inverse head and shoulders trigger of 58 which carries a measured move to 66. Look to enter on a pullback toward the round 60 number at 60.35.
If you liked what you read why not visit www.chartsmarter.com.