Markets went on a rollercoaster ride Friday with the Dow finishing nearly 300 handles off late morning intraday lows and all the major averages recorded big reversals, perhaps none bigger the the Russell 2000 that witnessed a hammer candle precisely off its rising 50 day SMA. The S&P 500 fell .2% and the Nasdaq and Russell 2000 fell .4 and .5% respectively. For the week the Nasdaq lost .6% but did manage to CLOSE in the upper half of the daily range. The S&P 500 ended the week higher by 1.5% in the fourth best weekly volume of the year and the Dow scored its best weekly gain in all of 2017. On a YTD basis the Dow made up some big ground on the Nasdaq this week and although it is unlikely to catch it with just one month left this year its gain of 22.6 to the Nasdaq's 27.2 is narrowing quickly. Keep in mind the volatility we have been watching is indicative of topping action, the exact opposite of slow rounding action seen at bottoms. Of course as technicians the real truth lies in price and respect the trend as long as it lasts, but their are some warning signs emerging. Remember there are no shots across the bow, but tops in hindsight will obvious. Perhaps this week will be looked at with the frantic trade in both MU and SQ. Each of them met recent trouble at the very round 50 figure, and notice MU bounced precisely at the 40 number Friday, but MU slumped 15.5 and SQ 21.8% this week in humungous volume. MU saw the largest weekly trade since the week ending 10/11/13 and SQ doubled its second largest weekly volume tally ever this week. Former general EA is on a five week losing streak and down 9 of the last 11. ULTA is 32% off its most recent 52 week highs, PCLN has now reported three consecutive negative earnings reactions. When you see former captains struggle and be taken out one by one it should be a cause for concern. I have a feeling December is going to be a very dramatic month.
Looking at individual sectors Friday it was energy that was a clear leader with the XLE rising .8% and the only two of the other major nine S&P groups to add ground were the staples and financials. It was the industrials which were hit the hardest to the tune of 1.2%. More importantly on a weekly basis there were so huge moves with the financials gaining 5.2% via the XLF (was accompanied by the second best weekly volume of 2017), and the industrials added more than 3%. The only sector to fall for the week was technology with the XLK FALLING 1.5% and falling below the 3 week tight trigger of 64.12, with the three weeks ending between 11/3-17 all CLOSING within just .15. The XLE looks most intriguing to me as although it is still 11% off most recent 52 week highs it has gained 11 of the last 15 weeks. It recorded a spinning top candle today as it wrestles with the round 70 number registering just 3 CLOSES above the figure since falling below it on 4/13. The ETF feels like it wants to continue to build the right side of a long weekly cup base trigger of 78.55 that began the week ending 12/16/16.
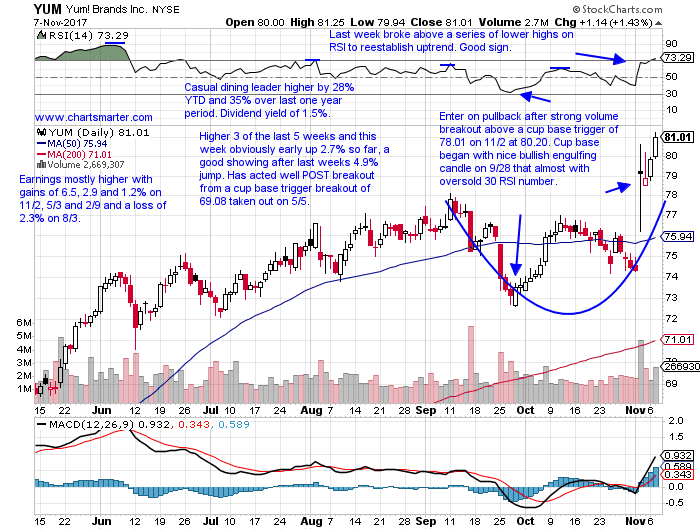
We always like to discuss the importance of keeping leaders in a weak group on close watch as when the space gets love, the strong hands will often be the first out of the gate and provide superior returns. Surely most avid investors have been aware of CMG's troubles which is still 38% off most recent 52 week highs even with this weeks 10% plus gain. Others former leaders such as EAT, CAKE, DPZ and SONC still lag 34, 28, 17 and 16% off most recent 52 week highs. Of course there have been stalwarts like MCD and WING and the recent takeovers regarding PNRA and BWLD. Below is the chart of slow and steady gainer YUM and how it was written about in our Wednesday 11/8 Game Plan. The stock has gained a very respectable 32% in 2017 and now sits at all time highs and this week registered its first weekly CLOSE above the round 80 number. Three of the last four weeks prior to this one traded above 80 intraweek but were unable finish above it. The chart is not only easy on the eyes, but the palate as well, pun intended.
Stocks that can be bought as they pullback into round numbers are TROW. TROW is a financial play higher by 37% YTD and 36% over the last one year period and sports a dividend yield of 2.2%. Earnings have been mostly lower with losses of .1, 4.2 and 5.3% on 10/26, 4/25 and 1/26 and a gain of 3.4% on 7/25. The stock rose 5% this week showing solid relative strength and has advanced 23 of the last 27 weeks and now sits right near all time highs. It has acted well POST breakout from a nearly 3 year long cup base trigger of 88.74 taken out the week ending 9/29 which began the week ending 1/2/15. TROW broke above a 97.45 cup base trigger on 11/15 and enter on a pullback to the round par number at 101.
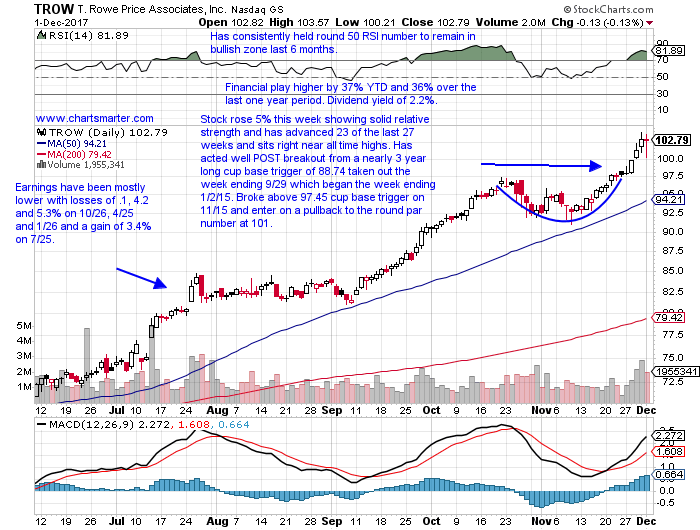
Trigger TROW 101. Stop 96.
Stocks that can be bought after recent cup base breakouts are CTAS. CTAS is a good play on small business confidence through uniforms and is higher by 36% YTD and over the last one year period and sports a dividend yield of 1%. Earnings momentum is firmly in the right direction with three straight gains of 5.8, 9.2 and 1.3% on 9/27, 7/21 and 3/23 and a loss of 3.1% on 12/23 (it REPORTS 12/19 after the close). The stock is higher 8 of the last 12 weeks and this week witnessed excellent relative strength higher by 6.6% in the third best weekly volume in 2017 so far. The chart trades very tight and narrow, hallmark bullish characteristics, and gained ground everyday this week amid all the volatility. CTAS broke above a 152.93 cup base trigger on 11/29 and enter at 155.50.
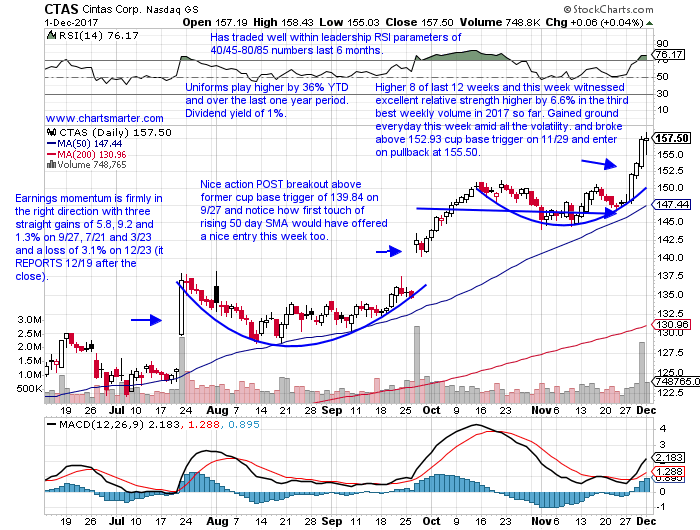
Trigger CTAS 155.50. Stop 149.
Stocks that can be bought after recent recaptures of their 200 day SMAs are JBLU. JBLU is an airline play lower by 5% YTD and higher by 4% over the last one year period. Earnings momentum is strong with three consecutive gains of 3.7, .1 and 3.3% on 10/24, 7/25 and 4/25 after a loss of 3.1% on 1/26. The stock is lower 5 of the last 9 weeks, but the bears have done little damage with the four up weeks being delivered with strong gains of 6, 3.7, 5.3 and 7.4% ending 10/6, 10/13, 11/17 and 12/1. It is still 12% off most recent 52 week highs and did break above a bullish ascending triangle trigger of 20.75 on 11/29 and today marked the third straight CLOSE above the 200 day SMA, which is starting to slope upward. Notice the last time it broke above its 200 day SMA was the week ending 11/11/16 soaring 13.2%, pun intended. Enter JBLU here.
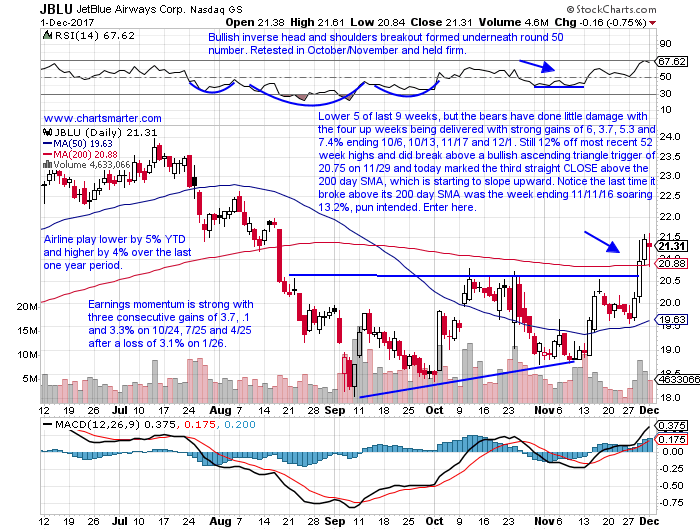
Trigger JBLU here. Stop 19.75.
Stocks that can be bought as they take out bullish inverse head and shoulders formations are TPR. TPR is a retail play higher by 19% YTD and 14% over the last one year period and sports a dividend yield of 3.2%. Earnings have been mostly higher with gains of 1.1, 11.4 and 3.8% on 11/7, 5/2 and 1/31 and a loss of 15.2% on 8/15. The stock is higher 4 of the last 7 weeks and rose 1.7% this week and recorded its seventh consecutive weekly CLOSE above round 40 number. Enter TPR with a break above bullish inverse head and shoulders trigger of 42.25 which carries measured move to 46, which would come close to an upside gap fill from 8/14 session. One can add to above a cup base trigger of 48.95 in pattern that began week ending 7/21.
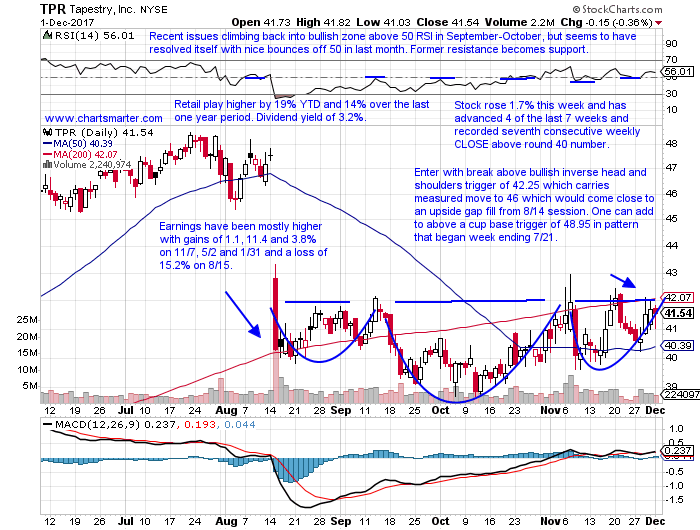
Trigger TPR 42.25. Stop 39.75.
Stocks that can be bought after recent bull flag breakouts are PEP CLR. PEP is a consumer giant higher by 12% YTD and 18% over the last one year period and sports a dividend yield of 2.8%. Earnings have been have been mostly lower, but the damage very muted with three straight losses of .5, .7 and .2% on 7/11, 4/26 and 2/15 and a gain of .2% on 1/4. The stock is on a current 4 week winning streak higher by almost a combined 6% (which was immediately preceded by a 10 of 11 week LOSING streak), the first since a 7 week streak the weeks ending between 1/20-3/3. PEP took out a bull flag trigger of 116 on 11/28 which carries a measured move to 124. Enter here and add to above a cup base trigger of 119.49.
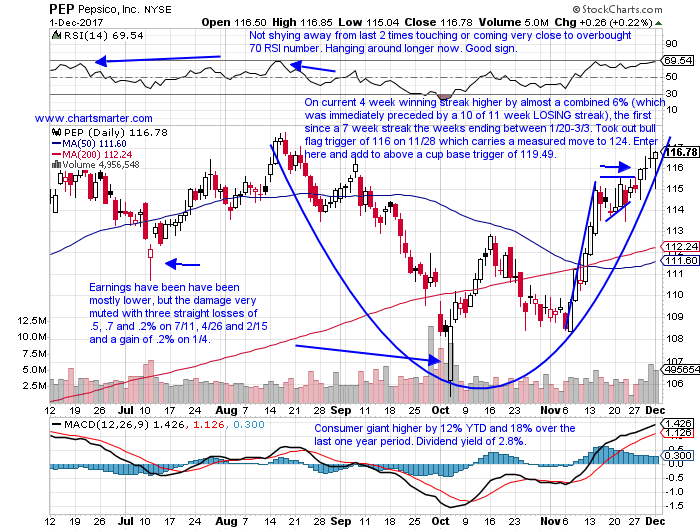
Trigger PEP here. Stop 114.
CLR is among the resurgent energy group and is lower 6% YTD and 16% over the last one year period. Earnings have been mostly higher with gains of 3, 5.8 and 1.5% on 11/8, 8/9 and 2/23 and a loss of 5.1% on 5/4. The stock is higher 16 of the last 21 weeks and rose 3.7% this week. It is still 20% off most recent 52 week highs and the round numbers have played a role with a nice hammer candle off the round 30 number on 7/7, 40 was temporary resistance on 9/28 and further back 60 was resistance on 12/1/16. It is now approaching the round 50 number and broke above a bull flag trigger of 47 on 11/30 which carries a measured move to 58 which would be very close to an add on cup base trigger of 60.40 in a base that began a year ago. Enter CLR at 48.
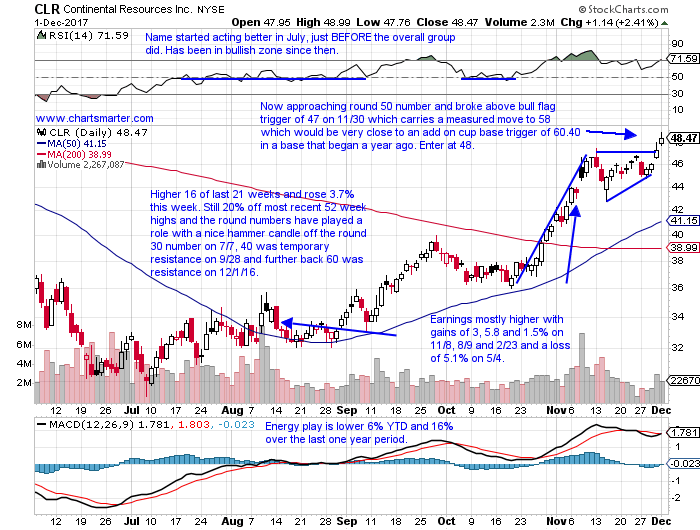
Trigger CLR 48. Stop 46.
Good luck.
The author is flat.
Trigger summaries:
Buy pullback into round numbers TROW 101. Stop 96.
Buy pullback into recent cup base breakout CTAS 155.50. Stop 149.
Buy after recent recapture of 200 day SMA JBLU here. Stop 19.75.
Buy stop above bullish inverse head and shoulders pattern TPR 42.25. Stop 39.75.
Buy after recent bull flag breakout PEP here. Stop 114.
Buy after recent bull flag breakout CLR 48. Stop 46.
Markets went on a rollercoaster ride Friday with the Dow finishing nearly 300 handles off late morning intraday lows and all the major averages recorded big reversals, perhaps none bigger the the Russell 2000 that witnessed a hammer candle precisely off its rising 50 day SMA. The S&P 500 fell .2% and the Nasdaq and Russell 2000 fell .4 and .5% respectively. For the week the Nasdaq lost .6% but did manage to CLOSE in the upper half of the daily range. The S&P 500 ended the week higher by 1.5% in the fourth best weekly volume of the year and the Dow scored its best weekly gain in all of 2017. On a YTD basis the Dow made up some big ground on the Nasdaq this week and although it is unlikely to catch it with just one month left this year its gain of 22.6 to the Nasdaq's 27.2 is narrowing quickly. Keep in mind the volatility we have been watching is indicative of topping action, the exact opposite of slow rounding action seen at bottoms. Of course as technicians the real truth lies in price and respect the trend as long as it lasts, but their are some warning signs emerging. Remember there are no shots across the bow, but tops in hindsight will obvious. Perhaps this week will be looked at with the frantic trade in both MU and SQ. Each of them met recent trouble at the very round 50 figure, and notice MU bounced precisely at the 40 number Friday, but MU slumped 15.5 and SQ 21.8% this week in humungous volume. MU saw the largest weekly trade since the week ending 10/11/13 and SQ doubled its second largest weekly volume tally ever this week. Former general EA is on a five week losing streak and down 9 of the last 11. ULTA is 32% off its most recent 52 week highs, PCLN has now reported three consecutive negative earnings reactions. When you see former captains struggle and be taken out one by one it should be a cause for concern. I have a feeling December is going to be a very dramatic month.
Looking at individual sectors Friday it was energy that was a clear leader with the XLE rising .8% and the only two of the other major nine S&P groups to add ground were the staples and financials. It was the industrials which were hit the hardest to the tune of 1.2%. More importantly on a weekly basis there were so huge moves with the financials gaining 5.2% via the XLF (was accompanied by the second best weekly volume of 2017), and the industrials added more than 3%. The only sector to fall for the week was technology with the XLK FALLING 1.5% and falling below the 3 week tight trigger of 64.12, with the three weeks ending between 11/3-17 all CLOSING within just .15. The XLE looks most intriguing to me as although it is still 11% off most recent 52 week highs it has gained 11 of the last 15 weeks. It recorded a spinning top candle today as it wrestles with the round 70 number registering just 3 CLOSES above the figure since falling below it on 4/13. The ETF feels like it wants to continue to build the right side of a long weekly cup base trigger of 78.55 that began the week ending 12/16/16.
We always like to discuss the importance of keeping leaders in a weak group on close watch as when the space gets love, the strong hands will often be the first out of the gate and provide superior returns. Surely most avid investors have been aware of CMG's troubles which is still 38% off most recent 52 week highs even with this weeks 10% plus gain. Others former leaders such as EAT, CAKE, DPZ and SONC still lag 34, 28, 17 and 16% off most recent 52 week highs. Of course there have been stalwarts like MCD and WING and the recent takeovers regarding PNRA and BWLD. Below is the chart of slow and steady gainer YUM and how it was written about in our Wednesday 11/8 Game Plan. The stock has gained a very respectable 32% in 2017 and now sits at all time highs and this week registered its first weekly CLOSE above the round 80 number. Three of the last four weeks prior to this one traded above 80 intraweek but were unable finish above it. The chart is not only easy on the eyes, but the palate as well, pun intended.
Stocks that can be bought as they pullback into round numbers are TROW. TROW is a financial play higher by 37% YTD and 36% over the last one year period and sports a dividend yield of 2.2%. Earnings have been mostly lower with losses of .1, 4.2 and 5.3% on 10/26, 4/25 and 1/26 and a gain of 3.4% on 7/25. The stock rose 5% this week showing solid relative strength and has advanced 23 of the last 27 weeks and now sits right near all time highs. It has acted well POST breakout from a nearly 3 year long cup base trigger of 88.74 taken out the week ending 9/29 which began the week ending 1/2/15. TROW broke above a 97.45 cup base trigger on 11/15 and enter on a pullback to the round par number at 101.
Trigger TROW 101. Stop 96.
Stocks that can be bought after recent cup base breakouts are CTAS. CTAS is a good play on small business confidence through uniforms and is higher by 36% YTD and over the last one year period and sports a dividend yield of 1%. Earnings momentum is firmly in the right direction with three straight gains of 5.8, 9.2 and 1.3% on 9/27, 7/21 and 3/23 and a loss of 3.1% on 12/23 (it REPORTS 12/19 after the close). The stock is higher 8 of the last 12 weeks and this week witnessed excellent relative strength higher by 6.6% in the third best weekly volume in 2017 so far. The chart trades very tight and narrow, hallmark bullish characteristics, and gained ground everyday this week amid all the volatility. CTAS broke above a 152.93 cup base trigger on 11/29 and enter at 155.50.
Trigger CTAS 155.50. Stop 149.
Stocks that can be bought after recent recaptures of their 200 day SMAs are JBLU. JBLU is an airline play lower by 5% YTD and higher by 4% over the last one year period. Earnings momentum is strong with three consecutive gains of 3.7, .1 and 3.3% on 10/24, 7/25 and 4/25 after a loss of 3.1% on 1/26. The stock is lower 5 of the last 9 weeks, but the bears have done little damage with the four up weeks being delivered with strong gains of 6, 3.7, 5.3 and 7.4% ending 10/6, 10/13, 11/17 and 12/1. It is still 12% off most recent 52 week highs and did break above a bullish ascending triangle trigger of 20.75 on 11/29 and today marked the third straight CLOSE above the 200 day SMA, which is starting to slope upward. Notice the last time it broke above its 200 day SMA was the week ending 11/11/16 soaring 13.2%, pun intended. Enter JBLU here.
Trigger JBLU here. Stop 19.75.
Stocks that can be bought as they take out bullish inverse head and shoulders formations are TPR. TPR is a retail play higher by 19% YTD and 14% over the last one year period and sports a dividend yield of 3.2%. Earnings have been mostly higher with gains of 1.1, 11.4 and 3.8% on 11/7, 5/2 and 1/31 and a loss of 15.2% on 8/15. The stock is higher 4 of the last 7 weeks and rose 1.7% this week and recorded its seventh consecutive weekly CLOSE above round 40 number. Enter TPR with a break above bullish inverse head and shoulders trigger of 42.25 which carries measured move to 46, which would come close to an upside gap fill from 8/14 session. One can add to above a cup base trigger of 48.95 in pattern that began week ending 7/21.
Trigger TPR 42.25. Stop 39.75.
Stocks that can be bought after recent bull flag breakouts are PEP CLR. PEP is a consumer giant higher by 12% YTD and 18% over the last one year period and sports a dividend yield of 2.8%. Earnings have been have been mostly lower, but the damage very muted with three straight losses of .5, .7 and .2% on 7/11, 4/26 and 2/15 and a gain of .2% on 1/4. The stock is on a current 4 week winning streak higher by almost a combined 6% (which was immediately preceded by a 10 of 11 week LOSING streak), the first since a 7 week streak the weeks ending between 1/20-3/3. PEP took out a bull flag trigger of 116 on 11/28 which carries a measured move to 124. Enter here and add to above a cup base trigger of 119.49.
Trigger PEP here. Stop 114.
CLR is among the resurgent energy group and is lower 6% YTD and 16% over the last one year period. Earnings have been mostly higher with gains of 3, 5.8 and 1.5% on 11/8, 8/9 and 2/23 and a loss of 5.1% on 5/4. The stock is higher 16 of the last 21 weeks and rose 3.7% this week. It is still 20% off most recent 52 week highs and the round numbers have played a role with a nice hammer candle off the round 30 number on 7/7, 40 was temporary resistance on 9/28 and further back 60 was resistance on 12/1/16. It is now approaching the round 50 number and broke above a bull flag trigger of 47 on 11/30 which carries a measured move to 58 which would be very close to an add on cup base trigger of 60.40 in a base that began a year ago. Enter CLR at 48.
Trigger CLR 48. Stop 46.
Good luck.
The author is flat.
Trigger summaries:
Buy pullback into round numbers TROW 101. Stop 96.
Buy pullback into recent cup base breakout CTAS 155.50. Stop 149.
Buy after recent recapture of 200 day SMA JBLU here. Stop 19.75.
Buy stop above bullish inverse head and shoulders pattern TPR 42.25. Stop 39.75.
Buy after recent bull flag breakout PEP here. Stop 114.
Buy after recent bull flag breakout CLR 48. Stop 46.