Markets:
- The major averages were slightly bifurcated Friday with the Dow losing less than .1%, the S&P 500 essentially flat, and the Nasdaq and Russell 2000 leading the way up .3 and .5% respectively. The latter two indexes strength has become a regular occurrence and that is giving the bulls confidence. For the week the Nasdaq rose 2.1%, on top of the prior weeks gain of 1.7%. The only caveat was the lack of volume. The Nasdaq, which has risen 20 of the last 23 MONTHS, is benefitting from some "old tech" names like CSCO higher by 3.1% this week, AAPL which lost value just 4 times in all of August, and AMD which rose 5% this week displaying excellent follow through from the prior weeks huge advance of 21.3%. This week broke ABOVE a bearish rising wedge, and moves in the opposite direction of what they are perceived to do often are forceful.
- On a weekly basis the Nasdaq was the leader, doubling the gains of the S&P 500, Dow and Russell 2000 advancing between .7-9%. The Nasdaq also holds a clear advantage on a YTD basis up 17.5%, compared with the Russell 2000, S&P 500 and Dow up 13.4, 8 and 5% respectively. For Dow Theorists the transports will be one to watch as they are somewhat stalling near their previous January highs. The IYT is attempting to digest the big move in the interim and bears will say double top as the ETF hit intraday highs of 206.73 and 206.90 on 1/16 and 8/23. I am in the bull camp as it is not shying away from the level as it has hovered here 9 sessions where as the January encounter was quick to fizzle. It does have the look of a bull flag formation and a decisive break above 207 carries a measured move of more than 20 handles.
Sectors:
- Friday witnessed modest gains among the major S&P sectors and just three managed to gain ground. The cyclicals, technology and industrials all rose in lukewarm fashion, with the latter two just fractionally. The XLY, deserves some credit as I have been somewhat pessimistic headlining the losers, but there have been winners too. LULU, ULTA and SFIX come to mind with strong moves today of 13.1, 6.4 and 5.3% respectively. The XRT has now recorded four consecutive weekly CLOSES above to very round 50 figure, a level which has proved problematic in the past. Technology, via the XLK which rose 1.8% this week tied for the best showing with the XLY, is on a current 5 week winning streak, its first in nearly 10 months.
- Lagging Friday were the utilities and energy. In fact bulls are going into the holiday weekend feeling a bit fresh knowing that the only three groups to fall on a weekly basis were the staples, utilities and energy, although the losses were pedestrian with none of them slipping more than .5%. Of the three just mentioned I still see the weakest being the staples now trading 9% off most recent 52 week highs. PG and KO, the two largest components in the ETF, are looking somewhat soft. KO is lower 8 of the last 9 sessions, with all nine CLOSING at or in the lower half of the daily range. I was looking for the gap fill from the 7/24 to hold but that was not the case. PG broke below an extremely tight 12 day period with all of them CLOSING .66 of each other.
Special Situations:
- They saying goes only losers average down. Conversely productive traders tend to average up, or add to winning trades. This is easy do to in theory, but hard in practice. No one likes to see solid gains turn negative, and that is what trailing stops are for, but to keep it simple leading stocks will very often offer additional add on opportunities. Below is a good example of the chart of SEAS and how it was presented in our Thursday 8/16 Game Plan. In fact astute traders who look left on the chart would have seen an even earlier entry with a buy stop through a 15 month cup base trigger of 20.23, in a base that began the week ending 3/3/17 and taken out the week ending 6/8/18. It has nearly achieved its measured move and one has to respect the very taut overall trade. The stock is on a current 4 week winning streak up more than a combined 30%. Let your winners run or swim, pun intended.

Gradual gainer, what old salty traders like to see, advancing 18 of the last 23 weeks. MSFT is an "old tech" play higher by 31% YTD and 50% over the last one year period and sports a dividend yield of 1.5%. Earnings have been mostly higher with gains of 1.8, 1.6 and 6.4% on 7/20, 4/27 and 10/27/17 and a loss of .8% on 2/1. The stock is higher 8 of the last 9 weeks, the five weeks ending between 7/27-8/24 all CLOSED taut within just 1.42 of each other, resulting in this weeks powerful gain of 3.6%. Enter MSFT on a pullback into the break above a bull flag trigger of 110 at 111 and the breakout carries a measured move to 122.

Trigger MSFT 111. Stop 106.
Good looking bullish WEEKLY hammer candle this week. TSCO is a best in breed specialty retailer higher by 18% YTD and 48% over the last one year period and sports a dividend yield of 1.4%. Earnings are on the mend with back to back gains of 2.8 and 7.2% on 7/26 and 4/26 after losses of 6.3 and 1% on 2/1 and 10/26/17. The stock is higher 15 of the last 20 weeks after propelling off the round 60 number, and most impressive is this weeks basically UNCH CLOSE, down .3%, keeping almost all of the prior weeks romp of 10%. Last week also took out an 82.54 cup base trigger in a base that began the week ending 1/19/18. Enter TSCO with a buy stop above a bull flag trigger of 89 which carries a measured move to very round par figure.

Trigger TSCO 89. Stop 86.
Round 20 number has been thorn in its side with ZERO weekly CLOSES above although 6 traded above 20 intraweek weeks ending between 3/2-5/25. CDEV is an energy play lower by 3% YTD and higher by 11% over the last one year period. Earnings have been consistent with FOUR positive reactions higher by 3, 4.9, .2 and 1.3% on 8/7, 5/9, 2/27 and 11/7/17. The stock is higher 7 of the last 11 weeks and respect this weeks advance of 2.5% (prior week rose 5.8%) as the XLE lost .2%, showing good relative strength. Enter CDEV here after a break above a bullish ascending triangle trigger of 19, which aligned with its 200 day SMA, a line that stopped the stock advance 3 times since late June. The break carries a measured move to 22, which would put it above a an add on cup base trigger of 21.09.
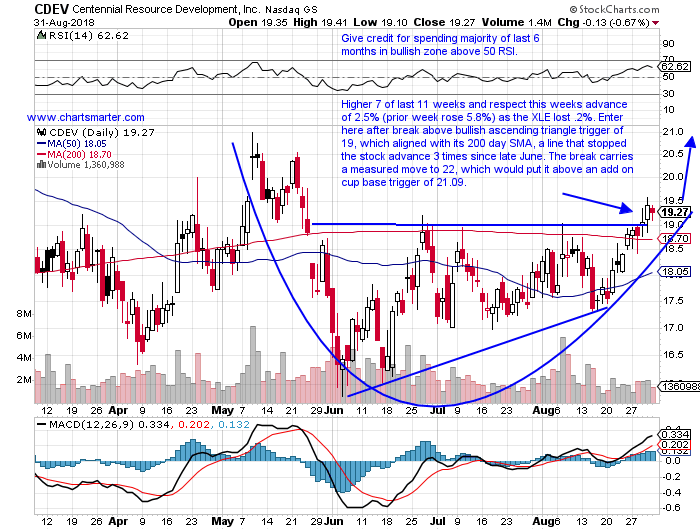
Trigger CDEV here. Stop 18.
Peer PHG trading very well just 2% off most recent 52 week highs, even with a heavy overall European market. FN is an electronic components play higher by 67% YTD and 23% over the last one year period. Earnings have seen a very positive trend change with three straight solid reactions, up 6.2, 7.6 and 24.7% on 8/21, 5/8 and 2/6 after losses of 9 and 7.2% on 11/7 and 8/22/17. The stock is higher 15 of the last 18 weeks, and three of the gaining weeks rose better than 9%. Enter FN with a break above a bull flag trigger of 48.30 which carries a measured move to 59. One can add to with a buy stop above a long cup base trigger of 49.73 in a pattern that began the week ending 2/24/17.
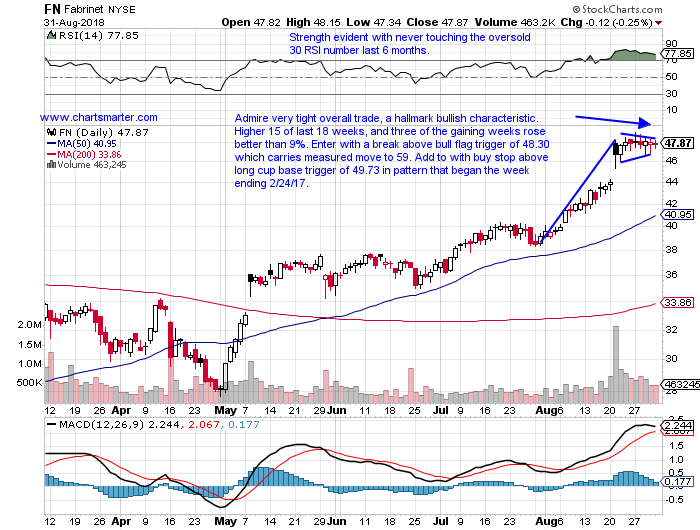
Trigger FN 48.30. Stop 46.25.
Still making higher highs and higher lows since October '15 trough. TPR is a retail play higher by 15% YTD and 22% over the last one year period and sports a nice dividend yield of 2.7%. Earnings have been mostly higher with gains of 12, 9 and 1.1% on 8/14, 2/6 and 11/7/17 and a loss of 11.7% on 5/1. The stock has lost ground the last 2 weeks, but both dropping less than .8%, and the 2 before that ending 8/10-17 rose by more than 10%. Its last earnings reaction did fill in an upside gap from the 4/30 session and its now trades 9% off most recent 52 week highs. Enter TPR on a pullback into the gap fill from 8/13 at 49.50.
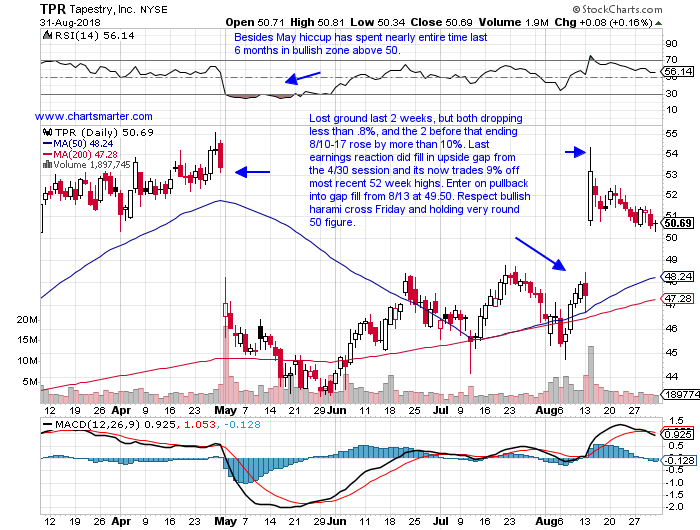
Trigger TPR 49.50. Stop 47.25.
Good luck.
Trigger summaries:
Buy pullback into recent bull flag breakout MSFT 111. Stop 106.
Buy stop above bull flag trigger TSCO 89. Stop 86.
Buy after recent break above bullish ascending triangle trigger CDEV here. Stop 18.
Buy stop above bull flag trigger FN 48.30. Stop 46.25.
Buy pullback into gap fill TPR 49.50. Stop 47.25.
Markets:
- The major averages were slightly bifurcated Friday with the Dow losing less than .1%, the S&P 500 essentially flat, and the Nasdaq and Russell 2000 leading the way up .3 and .5% respectively. The latter two indexes strength has become a regular occurrence and that is giving the bulls confidence. For the week the Nasdaq rose 2.1%, on top of the prior weeks gain of 1.7%. The only caveat was the lack of volume. The Nasdaq, which has risen 20 of the last 23 MONTHS, is benefitting from some "old tech" names like CSCO higher by 3.1% this week, AAPL which lost value just 4 times in all of August, and AMD which rose 5% this week displaying excellent follow through from the prior weeks huge advance of 21.3%. This week broke ABOVE a bearish rising wedge, and moves in the opposite direction of what they are perceived to do often are forceful.
- On a weekly basis the Nasdaq was the leader, doubling the gains of the S&P 500, Dow and Russell 2000 advancing between .7-9%. The Nasdaq also holds a clear advantage on a YTD basis up 17.5%, compared with the Russell 2000, S&P 500 and Dow up 13.4, 8 and 5% respectively. For Dow Theorists the transports will be one to watch as they are somewhat stalling near their previous January highs. The IYT is attempting to digest the big move in the interim and bears will say double top as the ETF hit intraday highs of 206.73 and 206.90 on 1/16 and 8/23. I am in the bull camp as it is not shying away from the level as it has hovered here 9 sessions where as the January encounter was quick to fizzle. It does have the look of a bull flag formation and a decisive break above 207 carries a measured move of more than 20 handles.
Sectors:
- Friday witnessed modest gains among the major S&P sectors and just three managed to gain ground. The cyclicals, technology and industrials all rose in lukewarm fashion, with the latter two just fractionally. The XLY, deserves some credit as I have been somewhat pessimistic headlining the losers, but there have been winners too. LULU, ULTA and SFIX come to mind with strong moves today of 13.1, 6.4 and 5.3% respectively. The XRT has now recorded four consecutive weekly CLOSES above to very round 50 figure, a level which has proved problematic in the past. Technology, via the XLK which rose 1.8% this week tied for the best showing with the XLY, is on a current 5 week winning streak, its first in nearly 10 months.
- Lagging Friday were the utilities and energy. In fact bulls are going into the holiday weekend feeling a bit fresh knowing that the only three groups to fall on a weekly basis were the staples, utilities and energy, although the losses were pedestrian with none of them slipping more than .5%. Of the three just mentioned I still see the weakest being the staples now trading 9% off most recent 52 week highs. PG and KO, the two largest components in the ETF, are looking somewhat soft. KO is lower 8 of the last 9 sessions, with all nine CLOSING at or in the lower half of the daily range. I was looking for the gap fill from the 7/24 to hold but that was not the case. PG broke below an extremely tight 12 day period with all of them CLOSING .66 of each other.
Special Situations:
- They saying goes only losers average down. Conversely productive traders tend to average up, or add to winning trades. This is easy do to in theory, but hard in practice. No one likes to see solid gains turn negative, and that is what trailing stops are for, but to keep it simple leading stocks will very often offer additional add on opportunities. Below is a good example of the chart of SEAS and how it was presented in our Thursday 8/16 Game Plan. In fact astute traders who look left on the chart would have seen an even earlier entry with a buy stop through a 15 month cup base trigger of 20.23, in a base that began the week ending 3/3/17 and taken out the week ending 6/8/18. It has nearly achieved its measured move and one has to respect the very taut overall trade. The stock is on a current 4 week winning streak up more than a combined 30%. Let your winners run or swim, pun intended.
Gradual gainer, what old salty traders like to see, advancing 18 of the last 23 weeks. MSFT is an "old tech" play higher by 31% YTD and 50% over the last one year period and sports a dividend yield of 1.5%. Earnings have been mostly higher with gains of 1.8, 1.6 and 6.4% on 7/20, 4/27 and 10/27/17 and a loss of .8% on 2/1. The stock is higher 8 of the last 9 weeks, the five weeks ending between 7/27-8/24 all CLOSED taut within just 1.42 of each other, resulting in this weeks powerful gain of 3.6%. Enter MSFT on a pullback into the break above a bull flag trigger of 110 at 111 and the breakout carries a measured move to 122.
Trigger MSFT 111. Stop 106.
Good looking bullish WEEKLY hammer candle this week. TSCO is a best in breed specialty retailer higher by 18% YTD and 48% over the last one year period and sports a dividend yield of 1.4%. Earnings are on the mend with back to back gains of 2.8 and 7.2% on 7/26 and 4/26 after losses of 6.3 and 1% on 2/1 and 10/26/17. The stock is higher 15 of the last 20 weeks after propelling off the round 60 number, and most impressive is this weeks basically UNCH CLOSE, down .3%, keeping almost all of the prior weeks romp of 10%. Last week also took out an 82.54 cup base trigger in a base that began the week ending 1/19/18. Enter TSCO with a buy stop above a bull flag trigger of 89 which carries a measured move to very round par figure.
Trigger TSCO 89. Stop 86.
Round 20 number has been thorn in its side with ZERO weekly CLOSES above although 6 traded above 20 intraweek weeks ending between 3/2-5/25. CDEV is an energy play lower by 3% YTD and higher by 11% over the last one year period. Earnings have been consistent with FOUR positive reactions higher by 3, 4.9, .2 and 1.3% on 8/7, 5/9, 2/27 and 11/7/17. The stock is higher 7 of the last 11 weeks and respect this weeks advance of 2.5% (prior week rose 5.8%) as the XLE lost .2%, showing good relative strength. Enter CDEV here after a break above a bullish ascending triangle trigger of 19, which aligned with its 200 day SMA, a line that stopped the stock advance 3 times since late June. The break carries a measured move to 22, which would put it above a an add on cup base trigger of 21.09.
Trigger CDEV here. Stop 18.
Peer PHG trading very well just 2% off most recent 52 week highs, even with a heavy overall European market. FN is an electronic components play higher by 67% YTD and 23% over the last one year period. Earnings have seen a very positive trend change with three straight solid reactions, up 6.2, 7.6 and 24.7% on 8/21, 5/8 and 2/6 after losses of 9 and 7.2% on 11/7 and 8/22/17. The stock is higher 15 of the last 18 weeks, and three of the gaining weeks rose better than 9%. Enter FN with a break above a bull flag trigger of 48.30 which carries a measured move to 59. One can add to with a buy stop above a long cup base trigger of 49.73 in a pattern that began the week ending 2/24/17.
Trigger FN 48.30. Stop 46.25.
Still making higher highs and higher lows since October '15 trough. TPR is a retail play higher by 15% YTD and 22% over the last one year period and sports a nice dividend yield of 2.7%. Earnings have been mostly higher with gains of 12, 9 and 1.1% on 8/14, 2/6 and 11/7/17 and a loss of 11.7% on 5/1. The stock has lost ground the last 2 weeks, but both dropping less than .8%, and the 2 before that ending 8/10-17 rose by more than 10%. Its last earnings reaction did fill in an upside gap from the 4/30 session and its now trades 9% off most recent 52 week highs. Enter TPR on a pullback into the gap fill from 8/13 at 49.50.
Trigger TPR 49.50. Stop 47.25.
Good luck.
Trigger summaries:
Buy pullback into recent bull flag breakout MSFT 111. Stop 106.
Buy stop above bull flag trigger TSCO 89. Stop 86.
Buy after recent break above bullish ascending triangle trigger CDEV here. Stop 18.
Buy stop above bull flag trigger FN 48.30. Stop 46.25.
Buy pullback into gap fill TPR 49.50. Stop 47.25.