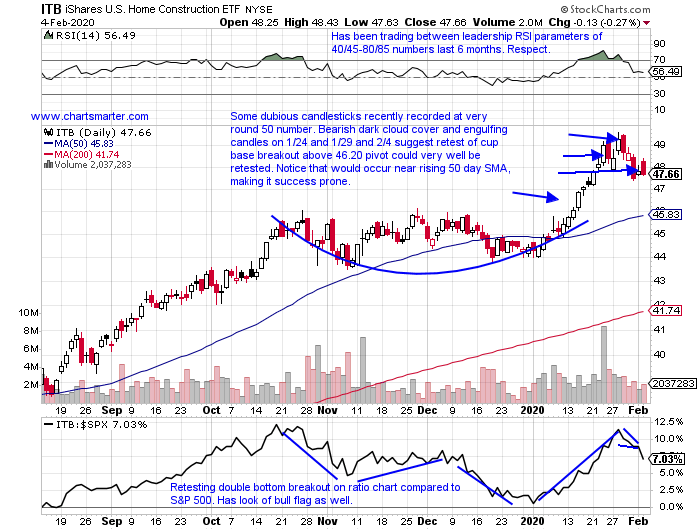
Builder Beware?
- Even with the ITB now trading 4% off most recent all time highs, it is still up a powerful 8% YTD. It now sits just above a WEEKLY 2 year long cup base that began in January 2018, or it could also be interpreted as a WEEKLY flag breakout above a 46 trigger, which would carry a measured move to 56. Last week did record a WEEKLY bearish shooting star candle which may put the ITB under a bit more pressure, but the break above that long weekly cup should hold, as we know the longer the base the greater the space. Top components DHI and PHM are higher by 9 and 14% respectively YTD thus far, and this rally is in great part because of the collapse in the 10 yr note as the TNX has dropped by a combined 18% the last 2 weeks, not a typo. Will this arena need lower rates to sustain its rally? Let PRICE as always be your guide. TMHC looks good as it attempts to follow through after a break above a cup with handle pivot 26.62 taken out Monday.
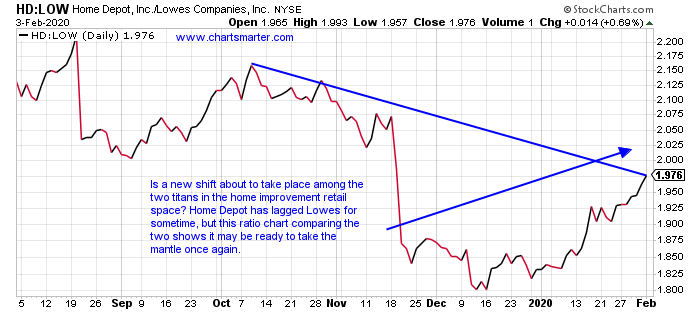
Unusual Relationships:
- In recent memory we have had some noteworthy relationships in regards to ratio charts, comparing heavyweights in their respective spaces. FDX which was once a juggernaut, seems to be reclaiming the top dog over UPS (dropped more than 11% last week in bulging trade), after the latter enjoyed that status for some time. The same could be said with Nike acting better against Adidas, as ADDYY is quickly in correction mode down 11% from most recent 52 week highs. Below is the ratio chart comparing Home Depot to Lowes. Since mid December it recorded a nice move off its rising 200 day SMA and now has a cup with handle pivot of 236.63. Meanwhile LOW undercut, and CLOSED below its 50 day SMA last Friday for the first time since last August, but did recapture that line Tuesday. Another name in the periphery home builder group to watch is RH. This stalwart recorded its third straight CLOSE below its 50 day SMA, and a few weeks back it failed to CLOSE above a 229.65 double bottom trigger.
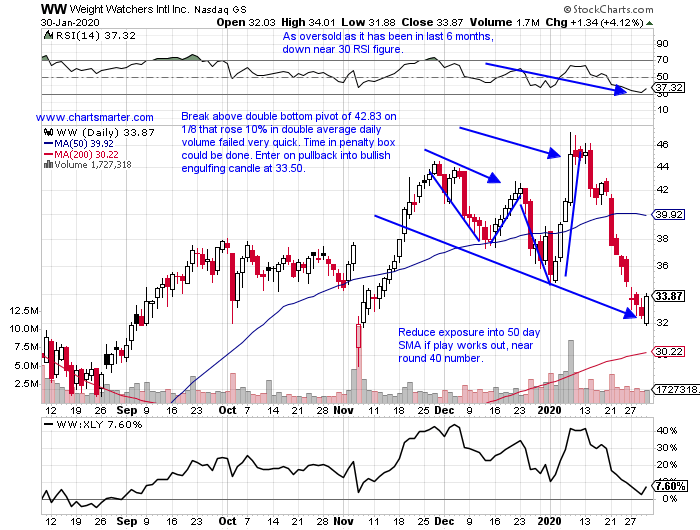
Recent Examples:
- It is often tricky trying to catch a falling knife, and it should be avoided, unless one has a reason to believe a sell off could be abating. Of course that is not a gut feeling, but something concrete, that could offer an investor good risk/reward. This is where candlesticks can give one an edge to step in with conviction. Below may be a good example of that with the chart of WW, and how it appeared in our 1/31 Consumer Note. This name underwent a nearly 30% combined drop the 3 weeks ending between 1/17-31, but a bullish engulfing candle on 1/30 that rose more than 4%, gave one a good tight stop to play against. If this trades ends up working out it could be a weight off long shareholders shoulders, pun intended. The upgrade from GS this morning is a good start.
Special Situations:
- Recreational leader higher by 12% YTD and 31% over last one year period. Dividend yield of 1.9%.
- Higher just 13 of last 23 weeks, but 7 of weekly gainers up more than 6%, and nearly doubled in the process (zero weeks of distribution during time period).
- Earnings mixed with gains of 15.8 and 4.2% on 9/30 and 6/10 and losses of 5.1 and 4.3% on 12/9 and 3/6/19.
- Enter with buy stop above bull flag formation. Breakout carries measured move to 100.
- Entry THO 84. Stop 79.

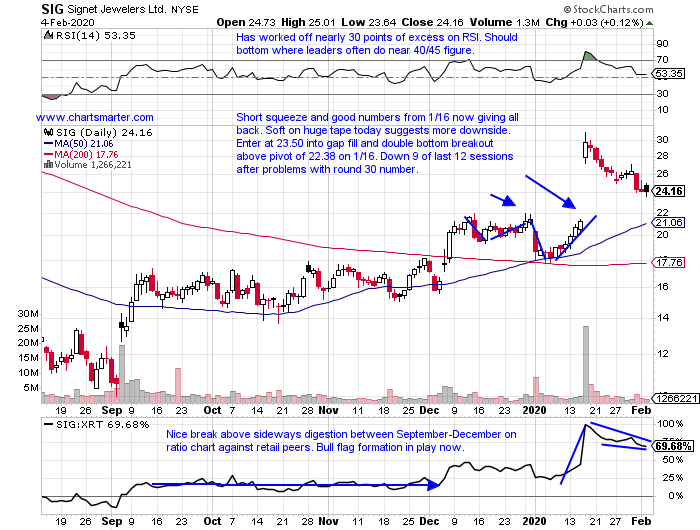
- Retail play higher by 11% YTD and UNCH over last one year period. Dividend yield of 6.1%.
- Down 18.5% last 2 weeks and by another .7% this week so far (week ending 1/17 rose more than 51% in best weekly volume in nearly 2 years). Now 24% off most recent 52 week highs.
- Back to back positive earnings reactions, higher by 7.4 and 26.9% on 12/5 and 9/5 sign of turnaround.
- Enter on pullback into gap fill/double bottom breakout.
- Entry SIG 23.50. Stop 21.
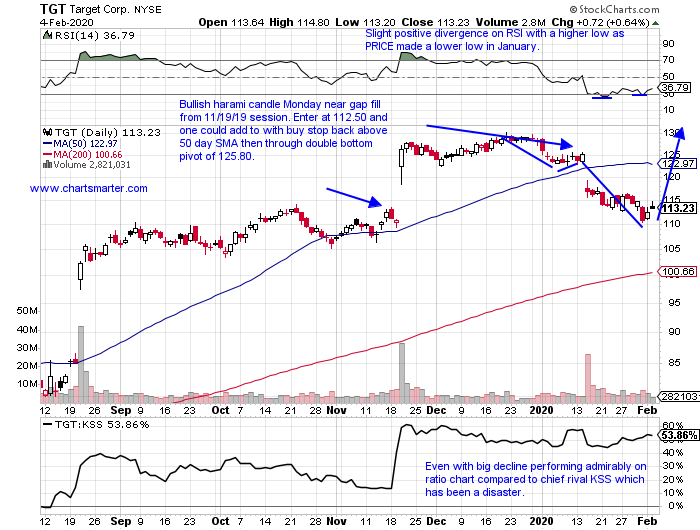
- Diversified retail name lower by 11% YTD and higher by 57% over last one year period. Dividend yield of 2.3%.
- Looking to end uncharacteristic 5 week losing streak that fell by a combined 15%, higher this week by more than 2% thus far. Still 14% off most recent 52 week highs.
- FOUR consecutive positive earnings reactions up 14.1, 20.4, 7.8 and 4.6% on 11/20, 8/21, 5/22 and 3/5/19.
- Enter on pullback into recent gap fill/bullish harami candle.
- Entry TGT 112.50. Stop 109.
Good luck.
Entry summaries:
Buy stop above bull flag THO 84. Stop 79.
Buy pullback into gap fill/double bottom SIG 23.50. Stop 21.
Buy pullback into gap fill/bullish harami TGT 112.50. Stop 109.
This article requires a Chartsmarter membership. Please click here to join.
Builder Beware?
- Even with the ITB now trading 4% off most recent all time highs, it is still up a powerful 8% YTD. It now sits just above a WEEKLY 2 year long cup base that began in January 2018, or it could also be interpreted as a WEEKLY flag breakout above a 46 trigger, which would carry a measured move to 56. Last week did record a WEEKLY bearish shooting star candle which may put the ITB under a bit more pressure, but the break above that long weekly cup should hold, as we know the longer the base the greater the space. Top components DHI and PHM are higher by 9 and 14% respectively YTD thus far, and this rally is in great part because of the collapse in the 10 yr note as the TNX has dropped by a combined 18% the last 2 weeks, not a typo. Will this arena need lower rates to sustain its rally? Let PRICE as always be your guide. TMHC looks good as it attempts to follow through after a break above a cup with handle pivot 26.62 taken out Monday.
Unusual Relationships:
- In recent memory we have had some noteworthy relationships in regards to ratio charts, comparing heavyweights in their respective spaces. FDX which was once a juggernaut, seems to be reclaiming the top dog over UPS (dropped more than 11% last week in bulging trade), after the latter enjoyed that status for some time. The same could be said with Nike acting better against Adidas, as ADDYY is quickly in correction mode down 11% from most recent 52 week highs. Below is the ratio chart comparing Home Depot to Lowes. Since mid December it recorded a nice move off its rising 200 day SMA and now has a cup with handle pivot of 236.63. Meanwhile LOW undercut, and CLOSED below its 50 day SMA last Friday for the first time since last August, but did recapture that line Tuesday. Another name in the periphery home builder group to watch is RH. This stalwart recorded its third straight CLOSE below its 50 day SMA, and a few weeks back it failed to CLOSE above a 229.65 double bottom trigger.
Recent Examples:
- It is often tricky trying to catch a falling knife, and it should be avoided, unless one has a reason to believe a sell off could be abating. Of course that is not a gut feeling, but something concrete, that could offer an investor good risk/reward. This is where candlesticks can give one an edge to step in with conviction. Below may be a good example of that with the chart of WW, and how it appeared in our 1/31 Consumer Note. This name underwent a nearly 30% combined drop the 3 weeks ending between 1/17-31, but a bullish engulfing candle on 1/30 that rose more than 4%, gave one a good tight stop to play against. If this trades ends up working out it could be a weight off long shareholders shoulders, pun intended. The upgrade from GS this morning is a good start.
Special Situations:
- Recreational leader higher by 12% YTD and 31% over last one year period. Dividend yield of 1.9%.
- Higher just 13 of last 23 weeks, but 7 of weekly gainers up more than 6%, and nearly doubled in the process (zero weeks of distribution during time period).
- Earnings mixed with gains of 15.8 and 4.2% on 9/30 and 6/10 and losses of 5.1 and 4.3% on 12/9 and 3/6/19.
- Enter with buy stop above bull flag formation. Breakout carries measured move to 100.
- Entry THO 84. Stop 79.
- Retail play higher by 11% YTD and UNCH over last one year period. Dividend yield of 6.1%.
- Down 18.5% last 2 weeks and by another .7% this week so far (week ending 1/17 rose more than 51% in best weekly volume in nearly 2 years). Now 24% off most recent 52 week highs.
- Back to back positive earnings reactions, higher by 7.4 and 26.9% on 12/5 and 9/5 sign of turnaround.
- Enter on pullback into gap fill/double bottom breakout.
- Entry SIG 23.50. Stop 21.
- Diversified retail name lower by 11% YTD and higher by 57% over last one year period. Dividend yield of 2.3%.
- Looking to end uncharacteristic 5 week losing streak that fell by a combined 15%, higher this week by more than 2% thus far. Still 14% off most recent 52 week highs.
- FOUR consecutive positive earnings reactions up 14.1, 20.4, 7.8 and 4.6% on 11/20, 8/21, 5/22 and 3/5/19.
- Enter on pullback into recent gap fill/bullish harami candle.
- Entry TGT 112.50. Stop 109.
Good luck.
Entry summaries:
Buy stop above bull flag THO 84. Stop 79.
Buy pullback into gap fill/double bottom SIG 23.50. Stop 21.
Buy pullback into gap fill/bullish harami TGT 112.50. Stop 109.