We should continue to remain nimble and small in this current environment, but also vigilant on monitoring charts that are holding up well in this climate. Below is a good example of that with the chart, and commentary that appeared in our 3/13 Technology Note.
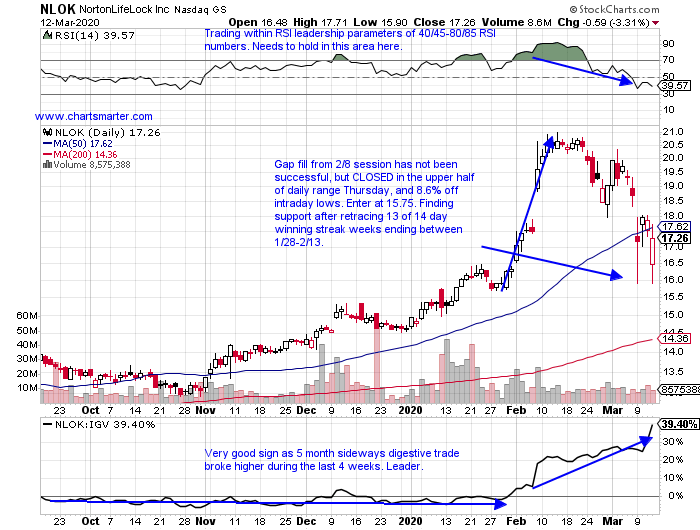
- Security software stock now 18% off most recent 52 week highs. Dividend yield of 2.9%.
- On current 3 week losing streak which lost almost a combined 10%. Displaying "good" relative strength this week down 7.6%, as IGV is currently lower by 16.2%.
- Three straight positive earnings reactions up 12, 2 and 4.5% on 2/7, 11/8 and 9/6/19.
- Enter on pullback into long spinning top candle from 3/9.
- Entry NLOK 15.75. Stop 14.
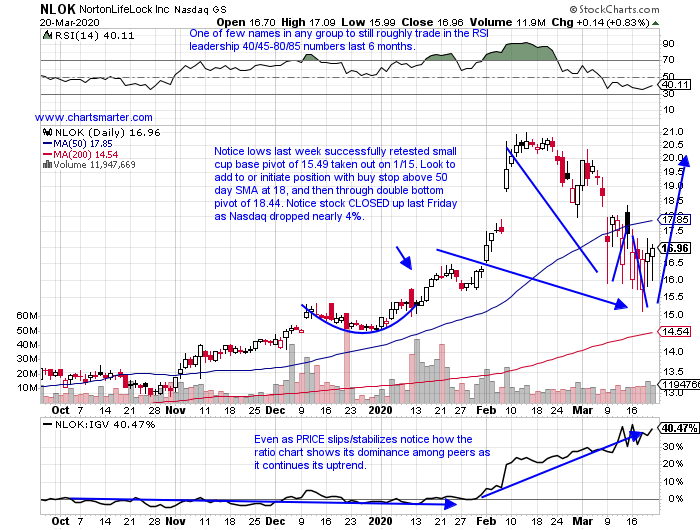
- Taking a current look at the situation notice how everyday last week it CLOSED in the upper half of the daily range, and although it fell 2.8% last week, it displayed excellent relative strength against its software peers as the IGV fell 9.8%. It still trades 20% off most recent 52 week highs, and is on a current 5 week losing streak, but if this name can recoup its 50 day SMA this week, we may be giving it general status.
If you liked what you read why not take a 2 week FREE trial at www.chartsmarter.com.
This article requires a Chartsmarter membership. Please click here to join.
We should continue to remain nimble and small in this current environment, but also vigilant on monitoring charts that are holding up well in this climate. Below is a good example of that with the chart, and commentary that appeared in our 3/13 Technology Note.
- Security software stock now 18% off most recent 52 week highs. Dividend yield of 2.9%.
- On current 3 week losing streak which lost almost a combined 10%. Displaying "good" relative strength this week down 7.6%, as IGV is currently lower by 16.2%.
- Three straight positive earnings reactions up 12, 2 and 4.5% on 2/7, 11/8 and 9/6/19.
- Enter on pullback into long spinning top candle from 3/9.
- Entry NLOK 15.75. Stop 14.
- Taking a current look at the situation notice how everyday last week it CLOSED in the upper half of the daily range, and although it fell 2.8% last week, it displayed excellent relative strength against its software peers as the IGV fell 9.8%. It still trades 20% off most recent 52 week highs, and is on a current 5 week losing streak, but if this name can recoup its 50 day SMA this week, we may be giving it general status.
If you liked what you read why not take a 2 week FREE trial at www.chartsmarter.com.