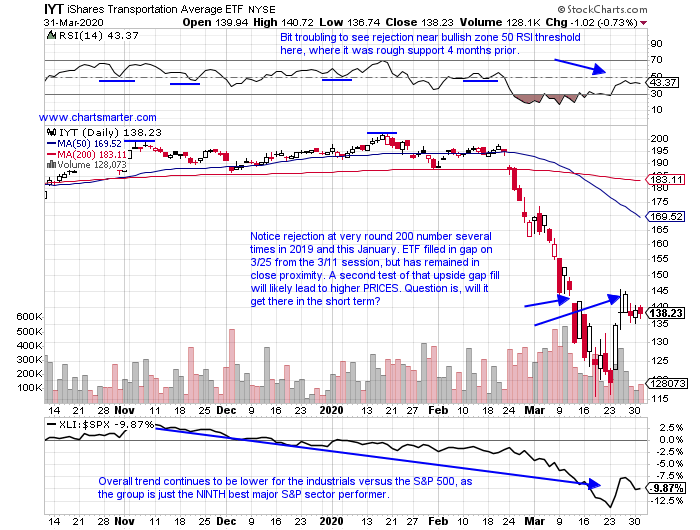
Transport Misery Or Opportunity:
- While the industrial space is a very diverse one, it is also a very economically sensitive one. Many groups in the arena tend to give a good signal about the genuine health of the economy. One could be looking at the moment at airlines, as the government may be looking to take an equity stake in select ones, and they see the JETS ETF now down 55% from most recent 52 week highs. If one was to watch try to get a feel for how the election in November may go, they may look at the ITA, a defense fund now off 40% from its highest yearly peak. The one that probably has the best overview of all of them would be the transport related IYT. This of course gives a good idea of how well goods are being shipped around, with rails, truckers and airlines. Last week the fund rose powerfully like everything else, to the tune of nearly 12%. It has lost nearly one third of its value from 52 week highs, and it ran into an upside gap fill from the 3/11 session on 3/25 and retreated. Is that all the gas bulls have in the tank, pun intended?
Cruising, Verus Hitting Potholes:
- Why do some names within the same group act well, while others are left behind? Is it a function of management, or something else? Technicians just focus on PRICE, since that is really all that matters. If one was to take a look at two names in the trucking space, and how they have been acting on a YTD and one year return they would see the startling difference. ODFL is off HIGHER by 4% YTD and 36% over the last one year period, while CHRW is down 15% in 2019, and 24% from its most recent yearly peak. ODFL remarkably recorded a breakout, extremely rare in this current market environment above a double bottom pivot of 138.02 on 3/26, however it is a red flag having dropped 5% below that trigger. The ratio chart is a good way of visually seeing where your capital should be allocated against another stock or instrument. If one was looking to put capital where it would be treated best trend followers would suggest ODFL. Value players might suggest the opposite with a mean reversion trade. That difference of opinion is what makes markets.

Recent Examples:
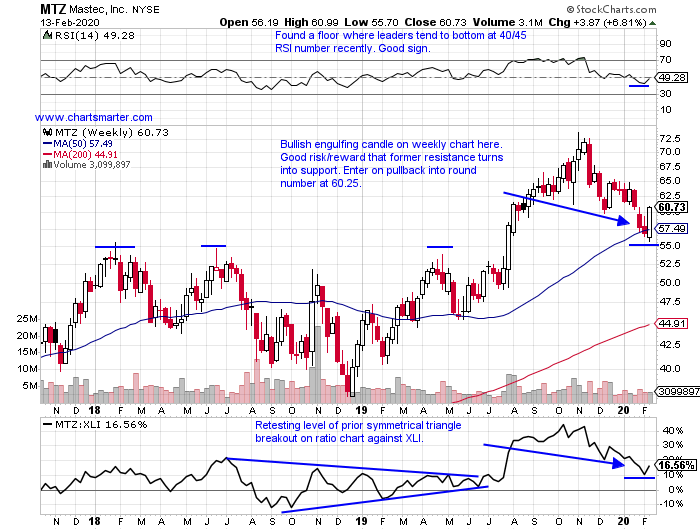
- It has been awhile since our last Industrial daily note, and as one could imagine any longs in that published letter would have been obliterated. Below is the chart of one such name in MTZ, and how it appeared in our Friday 2/14 Industrial Note. It happened to be a WEEKLY chart, as we do frequently look at longer term charts to get a better and more reliable feel as to what is going on. Notice here a bullish engulfing candle was recorded at a rising 50 day SMA, and seemed to be finding support near the 55 level, which was one of importance as it was resistance three times in the prior 2 years. This situation shows the gravity of utilizing stops as if one would have added as it trades south they endured very big drawdowns. The stock now trades 56% off most recent 52 week highs, and on its daily chart today acted well, but filling in a gap to the upside from the 3/11 session.
Special Situations:
- Trucking leader lower by UNCH YTD and higher by 6% over last one year period. Dividend yield of 1%.
- Last 3 weeks all bounced off round 30 number, and most extraordinary was fabulous relative strength week ending 3/20 when stock was HIGHER by .5%, as XLI fell 18.3%.
- Four of last five earnings reactions higher by 4.1, 2.5, 2.7 and 4% on 2/6, 10/25, 4/26 and 2/7/19.
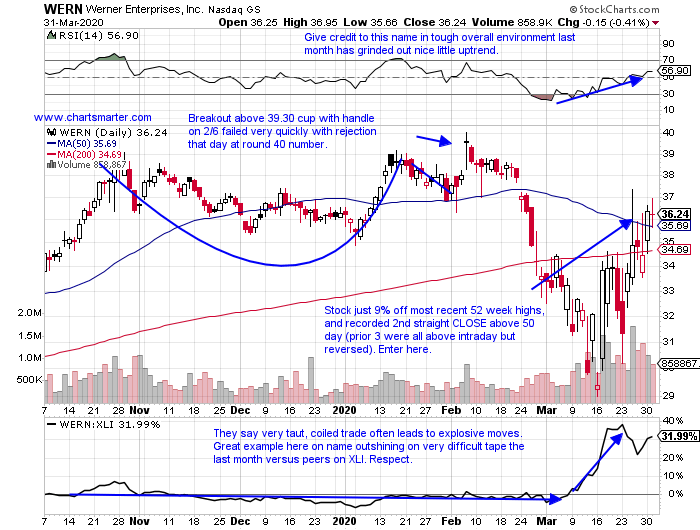
- Enter after second straight CLOSE above 50 day SMA.
- Entry WERN here. Stop 34.50.
- Transportation services play lower by 39% YTD and 9% over last one year period.
- Volatile trade with last week up more than 30%, and prior 4 all fell by combined 76%. Now 51% off most recent 52 week highs.
- Earnings mostly lower with 3 of last 5 off by 2, 4.5 and 12.7% on 2/11, 5/2 and 2/15/19 (rose 1.2 and 11% on 10/29 and 8/2).
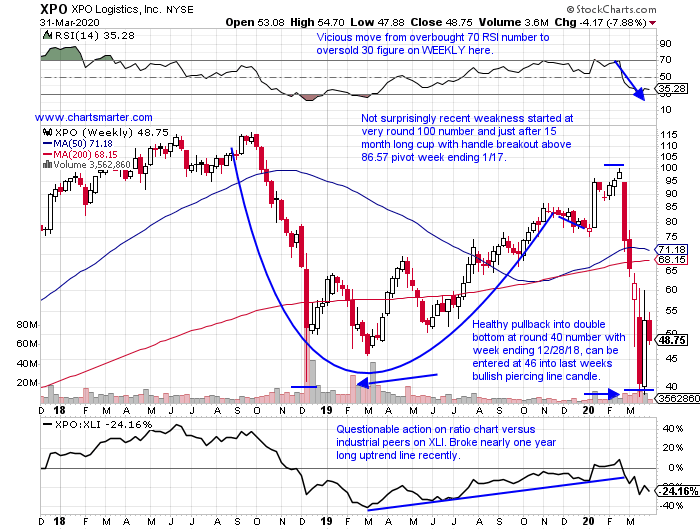
- Enter on pullback into WEEKLY bullish piercing line candle.
- Entry XPO 46. Stop 41.
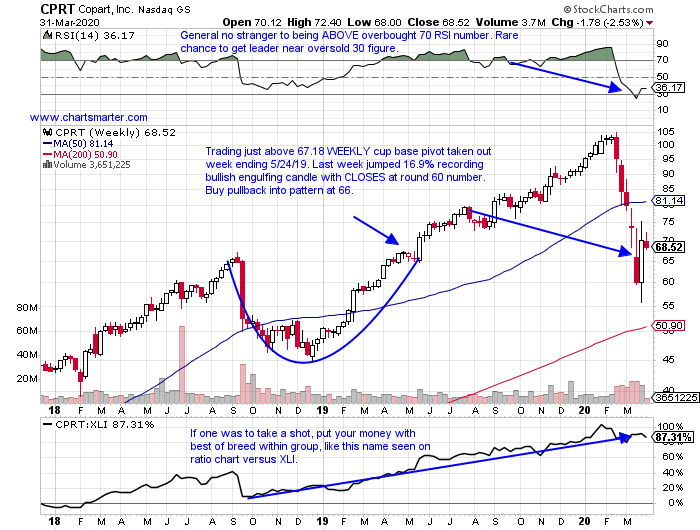
- Industrial services play lower by 25% YTD and higher by 13% over last one year period.
- Fell more than 40% during 5 week losing streak weeks ending between 2/21-3/20. Name put up very impressive move of 133.1% during 44 of 60 week winning streak weeks ending between 12/28/18-2/14/20.
- Last earnings reaction on 2/20 fell 6.9%, but prior FOUR all rose by 3.4, 6.5, 7.9 and 5.7% on 11/21, 9/5, 5/23 and 2/21/19.
- Enter on pullback into WEEKLY bullish engulfing candle at 66.
- Entry CPRT 66. Stop 59.
Good luck.
Entry summaries:
Buy after second straight CLOSE above 50 day SMA WERN here. Stop 34.50.
Buy pullback into WEEKLY bullish piercing line candle XPO 46. Stop 41.
Buy pullback into WEEKLY bullish engulfing candle CPRT 66. Stop 59.
This article requires a Chartsmarter membership. Please click here to join.
Transport Misery Or Opportunity:
- While the industrial space is a very diverse one, it is also a very economically sensitive one. Many groups in the arena tend to give a good signal about the genuine health of the economy. One could be looking at the moment at airlines, as the government may be looking to take an equity stake in select ones, and they see the JETS ETF now down 55% from most recent 52 week highs. If one was to watch try to get a feel for how the election in November may go, they may look at the ITA, a defense fund now off 40% from its highest yearly peak. The one that probably has the best overview of all of them would be the transport related IYT. This of course gives a good idea of how well goods are being shipped around, with rails, truckers and airlines. Last week the fund rose powerfully like everything else, to the tune of nearly 12%. It has lost nearly one third of its value from 52 week highs, and it ran into an upside gap fill from the 3/11 session on 3/25 and retreated. Is that all the gas bulls have in the tank, pun intended?
Cruising, Verus Hitting Potholes:
- Why do some names within the same group act well, while others are left behind? Is it a function of management, or something else? Technicians just focus on PRICE, since that is really all that matters. If one was to take a look at two names in the trucking space, and how they have been acting on a YTD and one year return they would see the startling difference. ODFL is off HIGHER by 4% YTD and 36% over the last one year period, while CHRW is down 15% in 2019, and 24% from its most recent yearly peak. ODFL remarkably recorded a breakout, extremely rare in this current market environment above a double bottom pivot of 138.02 on 3/26, however it is a red flag having dropped 5% below that trigger. The ratio chart is a good way of visually seeing where your capital should be allocated against another stock or instrument. If one was looking to put capital where it would be treated best trend followers would suggest ODFL. Value players might suggest the opposite with a mean reversion trade. That difference of opinion is what makes markets.
Recent Examples:
- It has been awhile since our last Industrial daily note, and as one could imagine any longs in that published letter would have been obliterated. Below is the chart of one such name in MTZ, and how it appeared in our Friday 2/14 Industrial Note. It happened to be a WEEKLY chart, as we do frequently look at longer term charts to get a better and more reliable feel as to what is going on. Notice here a bullish engulfing candle was recorded at a rising 50 day SMA, and seemed to be finding support near the 55 level, which was one of importance as it was resistance three times in the prior 2 years. This situation shows the gravity of utilizing stops as if one would have added as it trades south they endured very big drawdowns. The stock now trades 56% off most recent 52 week highs, and on its daily chart today acted well, but filling in a gap to the upside from the 3/11 session.
Special Situations:
- Trucking leader lower by UNCH YTD and higher by 6% over last one year period. Dividend yield of 1%.
- Last 3 weeks all bounced off round 30 number, and most extraordinary was fabulous relative strength week ending 3/20 when stock was HIGHER by .5%, as XLI fell 18.3%.
- Four of last five earnings reactions higher by 4.1, 2.5, 2.7 and 4% on 2/6, 10/25, 4/26 and 2/7/19.
- Enter after second straight CLOSE above 50 day SMA.
- Entry WERN here. Stop 34.50.
- Transportation services play lower by 39% YTD and 9% over last one year period.
- Volatile trade with last week up more than 30%, and prior 4 all fell by combined 76%. Now 51% off most recent 52 week highs.
- Earnings mostly lower with 3 of last 5 off by 2, 4.5 and 12.7% on 2/11, 5/2 and 2/15/19 (rose 1.2 and 11% on 10/29 and 8/2).
- Enter on pullback into WEEKLY bullish piercing line candle.
- Entry XPO 46. Stop 41.
- Industrial services play lower by 25% YTD and higher by 13% over last one year period.
- Fell more than 40% during 5 week losing streak weeks ending between 2/21-3/20. Name put up very impressive move of 133.1% during 44 of 60 week winning streak weeks ending between 12/28/18-2/14/20.
- Last earnings reaction on 2/20 fell 6.9%, but prior FOUR all rose by 3.4, 6.5, 7.9 and 5.7% on 11/21, 9/5, 5/23 and 2/21/19.
- Enter on pullback into WEEKLY bullish engulfing candle at 66.
- Entry CPRT 66. Stop 59.
Good luck.
Entry summaries:
Buy after second straight CLOSE above 50 day SMA WERN here. Stop 34.50.
Buy pullback into WEEKLY bullish piercing line candle XPO 46. Stop 41.
Buy pullback into WEEKLY bullish engulfing candle CPRT 66. Stop 59.