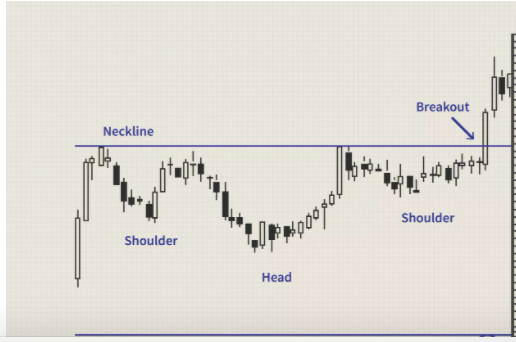
As the debate carries on about whether we have hit a market bottom or not, some reliable chart patterns, can help identify if individual names could be safe to venture into. Today I would like to discuss the bullish inverse head and shoulders, and what better way to describe the formation with a few recent examples. This pattern tends to form after a downtrend, with most sellers being washed out. It takes some time trading in a somewhat sideways fashion, with three different criteria, consisting of two shoulders separated by the head, whose low must trade beneath both shoulders. The highs of each of these three "body parts" should be roughly similar and would produce what we call a "neckline", or your ENTRY point. Upon the breakout from this pattern we can look for a "measured move", which we obtain by looking at the depth of the head to the neckline and adding that to the breakout trigger. Let us take a look at three recent examples.
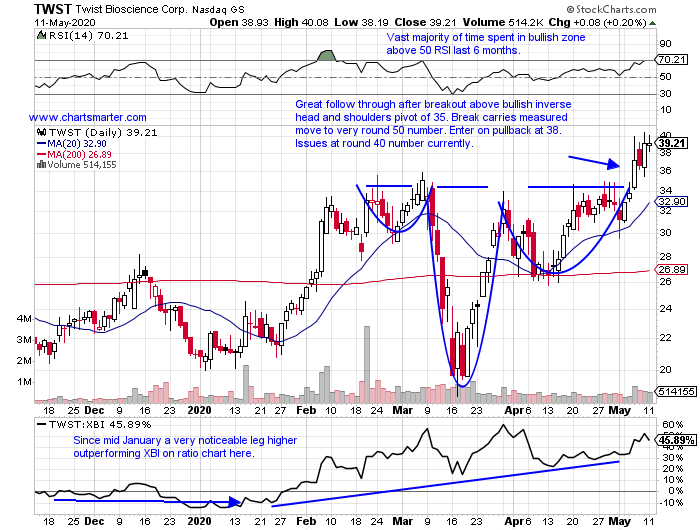
On May 12th I wrote about TWST.
- Biotech play higher by 87% YTD and 79% over last one year period.
- Rose by more than 25% last week, breaking through stubborn WEEKLY resistance dating back to December 2018. Not backing off to start this week a good sign.
- Three straight positive earnings reactions of 6.7, 16.3 and .7% on 5/7, 2/6 and 12/12/19.
- Enter on pullback into bullish inverse head and shoulders breakout.
- Entry TWST 38. Stop 34.
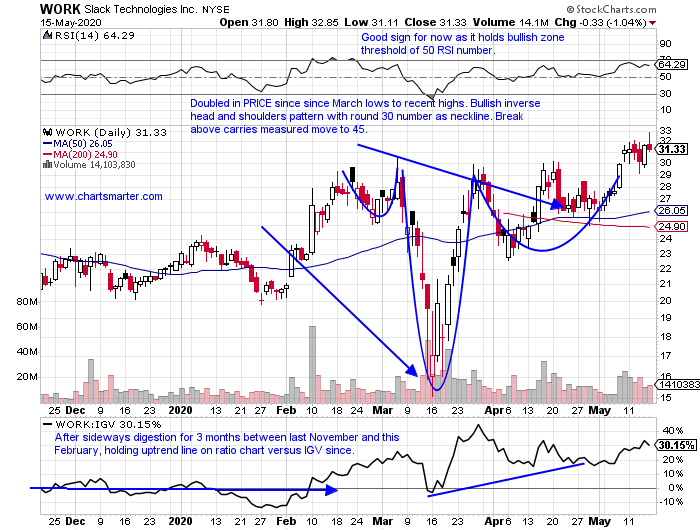
Taking a look at one of the "at home" names that have been working well here is Slack Technologies.
- Software name higher by 19% YTD, but still 36% off most recent 52 week highs.
- Round 30 number has pushed stock back 5 of last 8 weeks almost precisely. Digesting the strong combined move higher of 42% weeks ending between 3/20/27.
- Two of three earning reactions lower by 8.2 and 3.4% on 3/13 and 9/5/19 (rose 5.2% on 12/5/19).
- Notice nice break above 30 number and bullish inverse head and shoulders holding up.
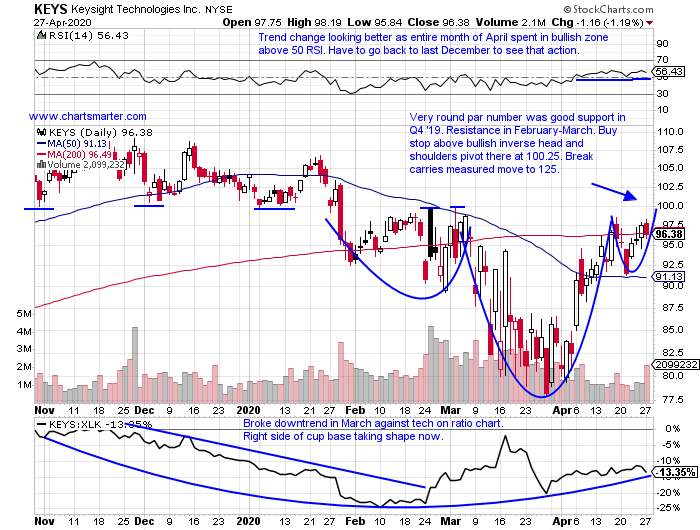
On 4/28 I wrote about a technology name KeySight.
- Electronic equipment play lower by 6% YTD and higher by 12% over last one year period.
- Current 4 week winning streak higher by a combined 23%. On daily chart breaking above downtrend line that started in January, and fighting here at 200 day SMA.
- FIVE consecutive positive earnings reactions up 3, 2.2, 12.6, 11.3 and .9% on 2/25, 11/27, 8/22, 5/30 and 2/22/19.
- Enter with buy stop above bullish inverse head and shoulders formation.
- Entry KEYS 100.25. Stop 94.50.
As the debate carries on about whether we have hit a market bottom or not, some reliable chart patterns, can help identify if individual names could be safe to venture into. Today I would like to discuss the bullish inverse head and shoulders, and what better way to describe the formation with a few recent examples. This pattern tends to form after a downtrend, with most sellers being washed out. It takes some time trading in a somewhat sideways fashion, with three different criteria, consisting of two shoulders separated by the head, whose low must trade beneath both shoulders. The highs of each of these three "body parts" should be roughly similar and would produce what we call a "neckline", or your ENTRY point. Upon the breakout from this pattern we can look for a "measured move", which we obtain by looking at the depth of the head to the neckline and adding that to the breakout trigger. Let us take a look at three recent examples.
On May 12th I wrote about TWST.
- Biotech play higher by 87% YTD and 79% over last one year period.
- Rose by more than 25% last week, breaking through stubborn WEEKLY resistance dating back to December 2018. Not backing off to start this week a good sign.
- Three straight positive earnings reactions of 6.7, 16.3 and .7% on 5/7, 2/6 and 12/12/19.
- Enter on pullback into bullish inverse head and shoulders breakout.
- Entry TWST 38. Stop 34.
Taking a look at one of the "at home" names that have been working well here is Slack Technologies.
- Software name higher by 19% YTD, but still 36% off most recent 52 week highs.
- Round 30 number has pushed stock back 5 of last 8 weeks almost precisely. Digesting the strong combined move higher of 42% weeks ending between 3/20/27.
- Two of three earning reactions lower by 8.2 and 3.4% on 3/13 and 9/5/19 (rose 5.2% on 12/5/19).
- Notice nice break above 30 number and bullish inverse head and shoulders holding up.
On 4/28 I wrote about a technology name KeySight.
- Electronic equipment play lower by 6% YTD and higher by 12% over last one year period.
- Current 4 week winning streak higher by a combined 23%. On daily chart breaking above downtrend line that started in January, and fighting here at 200 day SMA.
- FIVE consecutive positive earnings reactions up 3, 2.2, 12.6, 11.3 and .9% on 2/25, 11/27, 8/22, 5/30 and 2/22/19.
- Enter with buy stop above bullish inverse head and shoulders formation.
- Entry KEYS 100.25. Stop 94.50.