Value/Growth Struggle:
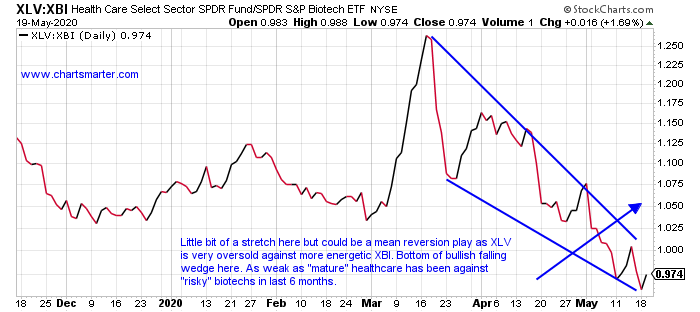
- As many market participants begin to think the overall markets are getting frothy, and value seems to be perennially lagging growth, at some point the relationship will shift. Of course as technicians we are "seeing is believing" types, as we need PRICE action to confirm. Below we see the ratio chart of the XLV to the XBI, most likely the best gauge of determining value versus growth within healthcare. It obviously is strongly favoring the XBI at the moment, and capital should continue to flow in an overweighted fashion until the technical circumstances change. On both the YTD and one year time periods the XBI is outshining higher by 8% YTD and 24% over the last one year period, compared to the XLV which has declined 2% in 2020, and is higher by 13% over the last 52 weeks.
We always want to be prepared in case something does change, and below we take a look at a few plays that fall into the value category that have intriguing prospects.
Special Situations:
- Pharmaceutical play higher by 23% YTD and 3% over the last one year period.
- Six consecutive WEEKLY CLOSES above very round 10 number, and all 6 were either very close or below 10 intraweek. Nice double bottom near 6 with last August and this March.
- FOUR straight positive earnings reactions rising 10.2, 9.1, 4.6 and 3.3% on 5/7, 2/12, 11/7 and 8/7/19.
- Enter with buy stop above cup with handle pivot.
- Entry TEVA 12.15. Stop 11.

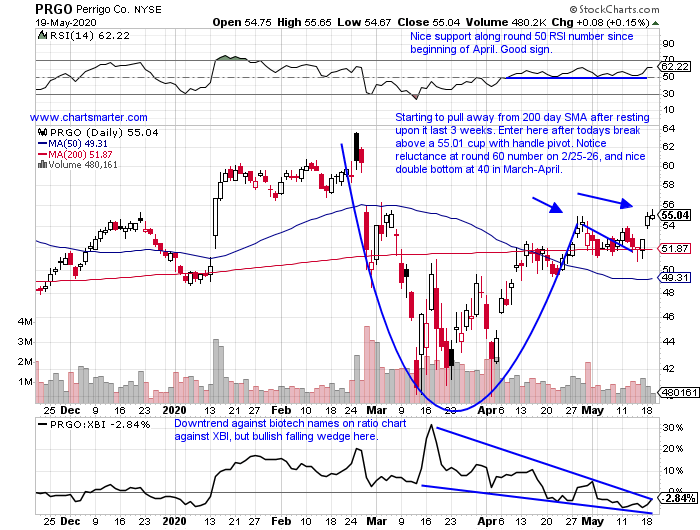
- Pharma play higher by 7% YTD and 11% over last one year period. Dividend yield of 1.6%.
- Fighting admirably, and trading mostly sideways since nasty 3 week losing streak between weeks ending 12/7-21/18 that fell a combined 44%. Another tough weekly loss of 15.3% week ending 2/28.
- Acting well despite FOUR straight negative earnings reactions off by 1.9, 14.6, 6.7 and 6.8% on 4/30, 2/27, 11/6 and 8/8/19.
- Enter after recent break above cup with handle.
- Entry PRGO here. Stop 52.
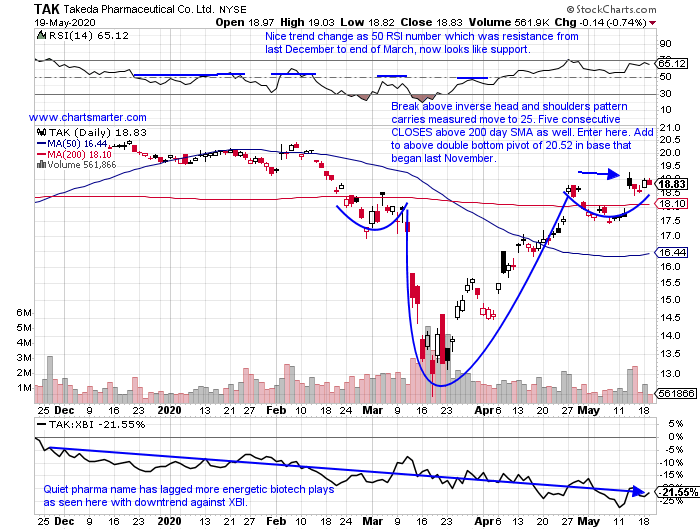
- Japanese pharma play lower by 4% YTD and higher by 8% over last one year period. Dividend yield of 6.4%.
- Up 6 of last 8 weeks, with 5 of 6 advancing at least 4%. Now 10% off most recent 52 week highs, approaching very round 20 number.
- Three of last four earnings reactions higher by 6, 3.2 and 4.9% on 5/13, 2/4 and 7/31/19.
- Enter after recent break above bullish inverse head and shoulders pattern.
- Entry TAK here. Stop 17.80.
Biotech Leader:
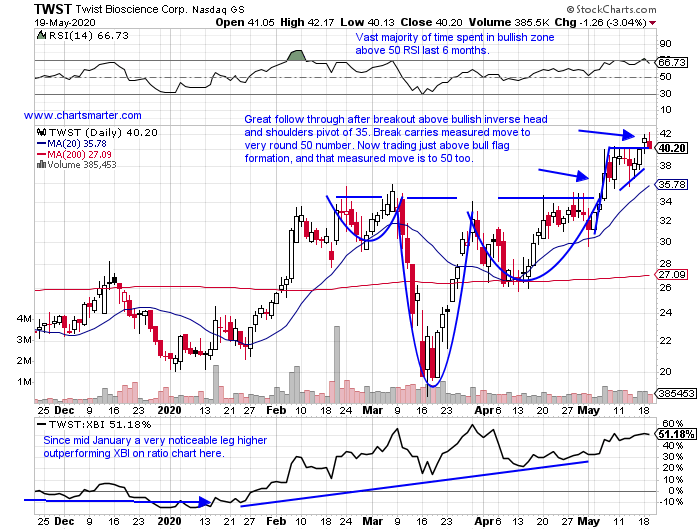
- One biotech that I really like is the chart below of TWST. Technically since the March massacre it has been behaving very bullishly. We can see here the break above the inverse head and shoulders pattern on 5/6, and that was welcome action as we know the best breakouts tend to work right away. Leaders will also give you opportunities to add on the way UP, and that is just what happened here as it is now dealing with the round 40 number, which was also the pivot on the bull flag, that started at the 30 figure. Look for this name to gravitate higher toward the 50 number in the near term.
Equipment "Comeback" Kid?
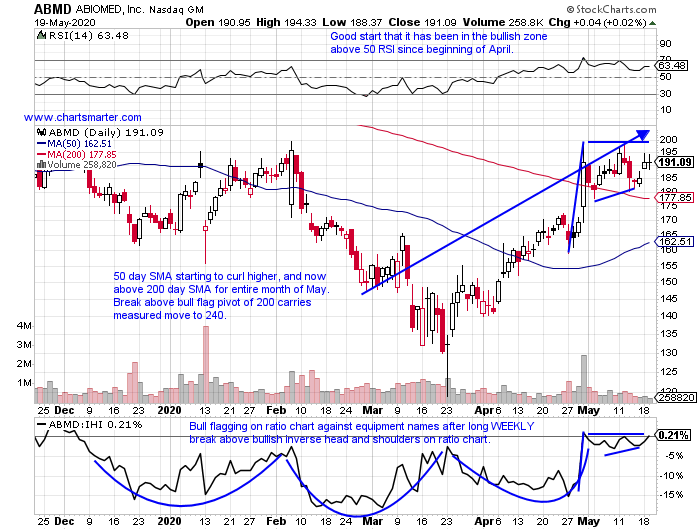
- With all the focus this weekend on the biotechs with their 13F filings, some of the other names in the diverse healthcare arena were hidden from the spotlight. Below is the chart of a former best of breed name, in the medical equipment group, which is attempting to recapture that former status. The turnaround from an earnings standpoint is moving in the right direction with THREE consecutive positive earnings reactions gaining 13, 2.8 and 14.2% on 4/30, 2/6 and 8/1/19. That is a good start, but we always want to see that translate into bullish PRICE action. We are beginning to see that with multiple CLOSES above its 200 day SMA, a line it has been below for well more than one year. And it has formed a bull flag in conjunction with the very round 200 number. It has not traded above that figure since last November, and on its WEEKLY chart a break above 200 would also negate a long series of lower highs and lower lows dating back to October 2018. Patience is required as the 200 figure still resides 9 handles away.
Thanks for listening.
This article requires a Chartsmarter membership. Please click here to join.
Value/Growth Struggle:
- As many market participants begin to think the overall markets are getting frothy, and value seems to be perennially lagging growth, at some point the relationship will shift. Of course as technicians we are "seeing is believing" types, as we need PRICE action to confirm. Below we see the ratio chart of the XLV to the XBI, most likely the best gauge of determining value versus growth within healthcare. It obviously is strongly favoring the XBI at the moment, and capital should continue to flow in an overweighted fashion until the technical circumstances change. On both the YTD and one year time periods the XBI is outshining higher by 8% YTD and 24% over the last one year period, compared to the XLV which has declined 2% in 2020, and is higher by 13% over the last 52 weeks.

We always want to be prepared in case something does change, and below we take a look at a few plays that fall into the value category that have intriguing prospects.
Special Situations:
- Pharmaceutical play higher by 23% YTD and 3% over the last one year period.
- Six consecutive WEEKLY CLOSES above very round 10 number, and all 6 were either very close or below 10 intraweek. Nice double bottom near 6 with last August and this March.
- FOUR straight positive earnings reactions rising 10.2, 9.1, 4.6 and 3.3% on 5/7, 2/12, 11/7 and 8/7/19.
- Enter with buy stop above cup with handle pivot.
- Entry TEVA 12.15. Stop 11.

- Pharma play higher by 7% YTD and 11% over last one year period. Dividend yield of 1.6%.
- Fighting admirably, and trading mostly sideways since nasty 3 week losing streak between weeks ending 12/7-21/18 that fell a combined 44%. Another tough weekly loss of 15.3% week ending 2/28.
- Acting well despite FOUR straight negative earnings reactions off by 1.9, 14.6, 6.7 and 6.8% on 4/30, 2/27, 11/6 and 8/8/19.
- Enter after recent break above cup with handle.
- Entry PRGO here. Stop 52.

- Japanese pharma play lower by 4% YTD and higher by 8% over last one year period. Dividend yield of 6.4%.
- Up 6 of last 8 weeks, with 5 of 6 advancing at least 4%. Now 10% off most recent 52 week highs, approaching very round 20 number.
- Three of last four earnings reactions higher by 6, 3.2 and 4.9% on 5/13, 2/4 and 7/31/19.
- Enter after recent break above bullish inverse head and shoulders pattern.
- Entry TAK here. Stop 17.80.

Biotech Leader:
- One biotech that I really like is the chart below of TWST. Technically since the March massacre it has been behaving very bullishly. We can see here the break above the inverse head and shoulders pattern on 5/6, and that was welcome action as we know the best breakouts tend to work right away. Leaders will also give you opportunities to add on the way UP, and that is just what happened here as it is now dealing with the round 40 number, which was also the pivot on the bull flag, that started at the 30 figure. Look for this name to gravitate higher toward the 50 number in the near term.

Equipment "Comeback" Kid?
- With all the focus this weekend on the biotechs with their 13F filings, some of the other names in the diverse healthcare arena were hidden from the spotlight. Below is the chart of a former best of breed name, in the medical equipment group, which is attempting to recapture that former status. The turnaround from an earnings standpoint is moving in the right direction with THREE consecutive positive earnings reactions gaining 13, 2.8 and 14.2% on 4/30, 2/6 and 8/1/19. That is a good start, but we always want to see that translate into bullish PRICE action. We are beginning to see that with multiple CLOSES above its 200 day SMA, a line it has been below for well more than one year. And it has formed a bull flag in conjunction with the very round 200 number. It has not traded above that figure since last November, and on its WEEKLY chart a break above 200 would also negate a long series of lower highs and lower lows dating back to October 2018. Patience is required as the 200 figure still resides 9 handles away.

Thanks for listening.