Round Number Restfulness:
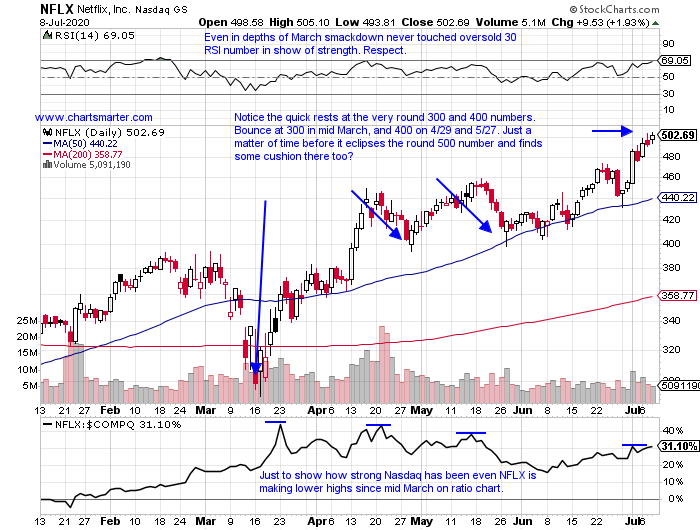
- As many recognizable names are coming into contact with the round numbers, they are pausing to catch their breath. Looking at COUP, it kissed the round par figure on 3/12, the 200 number on 5/27 and is now touching 300. Once it penetrates that number decisively, or should better say if, will it find a rocket launch off it if tested again? DDOG broke fractionally above the very round 90 number (as stocks do that for the initial time they are likely to reach par and beyond), Tuesday and powered higher Wednesday above a bull flag formation. It attempted to CLOSE above 90 multiple times between 6/23-7/6, as it was above the number intraday SIX times, but ZERO finished above. Below is the chart of NFLX, and it should be interesting to see how it reacts, if it can firmly climb above the 500 figure. It is about 10% above its rising 50 day SMA, a line it came into contact with 4 separate times between 5/27-6/29. It may need to take a recess and revisit the line, but by the time that occurs PRICE will likely be near the 500 number. This uptrend shows no signs of letting up.
Familiar Friction:
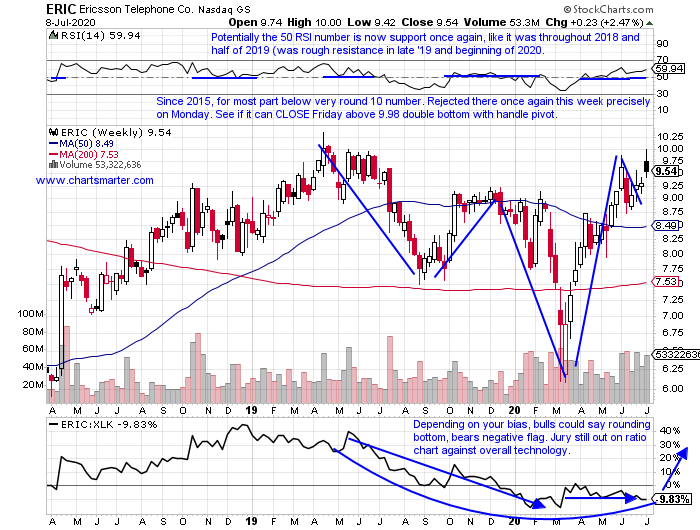
- Breaking up is a hard thing to do. The chart below of Ericsson proves that point, finding difficulty penetrating the very round 10 number to the upside, and rid itself of single digit status. On Monday it was repelled exactly at 10, and Tuesday filled in the gap from just last Friday. Below is the WEEKLY chart and one can see how 10 has been troublesome with just three CLOSES above the number, occurring the weeks ending 4/19-26/19 and 5/24/19, albeit fractionally (the latter two CLOSED four and three pennies above 10 respectively). It is lagging fellow Scandinavian telecommunications peer NOK, which is higher by 12% YTD, while ERIC is up 9% in 2020. Ericsson does REPORT earnings late next week as well, and it is following a one up, one down pattern the last 5 releases, higher by 2.9, 5.2 and 7.3% on 4/22, 10/17/19 and 4/17/19 (fell 7.2 and 10.9% on 1/24 and 7/17/19). The PRICE action will dictate future entries into this laggard, but a break above 10 could be powerful.
Recent Examples:
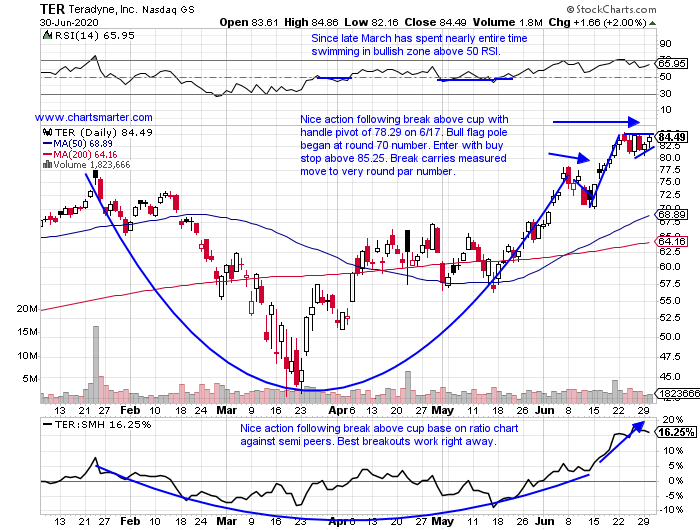
- The semiconductors have seen a broadening out within the space. That is a great sign, as one does not want to see just a handful of stocks shouldering the heavy load of carrying the group upon its shoulders. Newcomers are making their presence felt too with a good example being ACMR as it stormed above a cup base pivot of 69.35 this Monday. Below is yet another name flexing its muscles with the chart of TER, and how it appeared in our 7/1 Technology Note. Remember the best stocks give you a chance to add on the way UP, and this stock broke above a bull flag not long after taking out a cup with handle base. It is also well above the round 80 number, as it looks for its FOURTH consecutive CLOSE above the figure. That was an important level, as it took out 80 the week ending 1/24 but recorded a nasty reversal there, CLOSING more than 10% off intraweek highs. The WEEKLY chart has the look that it may want to duplicate the powerful one year long move from 30-80 between December '18 and January '20, which would put it near the very round par number, perhaps in the near term.
Special Situations:
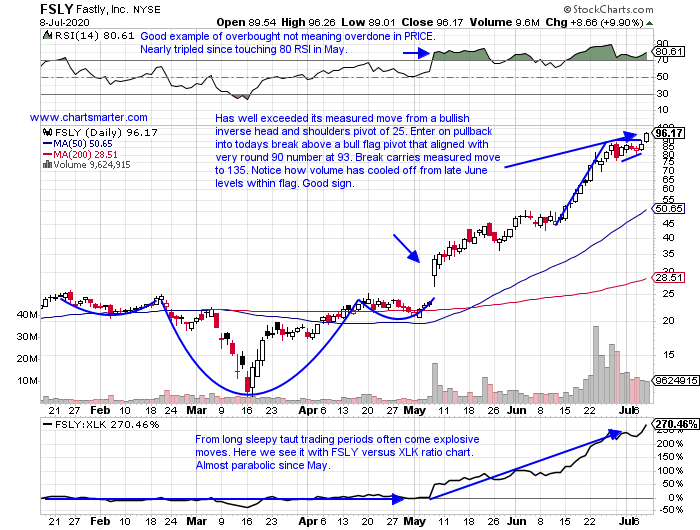
- Computer services leader higher by 380% YTD and 372% over last one year period.
- Last week ended huge 8 week winning streak between weeks ending 5/8-6/26 jumping 327.7%, but still CLOSED in upper half of WEEKLY range. Eleven session winning streak between 6/12-26 was accompanied by huge volume.
- Last earnings reaction screamed higher by 45.7% on 5/7, ending 3 straight losses of 6, 1.5 and 18.1% on 2/21, 11/8 and 8/9/18.
- Enter on pullback into recent break above bull flag formation.
- Entry FSLY 93. Stop 86.
- Brazilian transaction services play up 13% YTD and lower by 5% over last one year period.
- Since week ending 3/27 there have been SIX double digit WEEKLY gains, versus one loss of same amount. Has jumped 193% since late March lows. Just above 37.46 WEEKLY double bottom pivot in pattern 11 months long too.
- Earnings reactions mostly higher with gains of 6.4, 10.8 and 9.4% on 5/29, 8/16 and 5/15/19 (fell 4.2 and 17.1% on 2/28 and 11/20/19).
- Enter after recent break above bullish inverse head and shoulders pattern.
- Entry PAGS here. Stop 36.50.

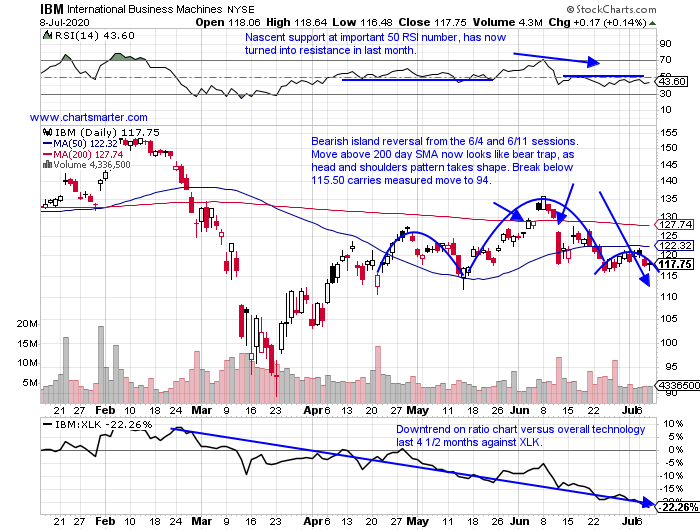
- "Old tech" computer services giant down 12% YTD and 16% over last one year period. Dividend yield of 5.5%.
- Still 26% off most recent 52 week highs, and never came close to revisiting February peaks like many peers did. Big distribution weeks ending 6/12 and 6/26 which fell 7.7 and 4.3% respectively and CLOSING hard on WEEKLY lows.
- Earnings mixed with gains of 3.4 and 4.6% on 1/22 and 7/18/19, and losses of 3 and 5.5% on 4/21 and 10/17/19.
- Enter with sell stop below bearish head and shoulders pattern.
- Entry IBM 115.50 Buy stop 121. (REPORTS 7/12 after close).
Good luck.
Entry summaries:
Buy pullback into recent break above bull flag FSLY 93. Stop 86.
Buy after recent break above bullish inverse head and shoulders PAGS here. Stop 36.50.
Sell stop below bearish head and shoulders IBM 115.50 Buy stop 121.
This article requires a Chartsmarter membership. Please click here to join.
Round Number Restfulness:
- As many recognizable names are coming into contact with the round numbers, they are pausing to catch their breath. Looking at COUP, it kissed the round par figure on 3/12, the 200 number on 5/27 and is now touching 300. Once it penetrates that number decisively, or should better say if, will it find a rocket launch off it if tested again? DDOG broke fractionally above the very round 90 number (as stocks do that for the initial time they are likely to reach par and beyond), Tuesday and powered higher Wednesday above a bull flag formation. It attempted to CLOSE above 90 multiple times between 6/23-7/6, as it was above the number intraday SIX times, but ZERO finished above. Below is the chart of NFLX, and it should be interesting to see how it reacts, if it can firmly climb above the 500 figure. It is about 10% above its rising 50 day SMA, a line it came into contact with 4 separate times between 5/27-6/29. It may need to take a recess and revisit the line, but by the time that occurs PRICE will likely be near the 500 number. This uptrend shows no signs of letting up.
Familiar Friction:
- Breaking up is a hard thing to do. The chart below of Ericsson proves that point, finding difficulty penetrating the very round 10 number to the upside, and rid itself of single digit status. On Monday it was repelled exactly at 10, and Tuesday filled in the gap from just last Friday. Below is the WEEKLY chart and one can see how 10 has been troublesome with just three CLOSES above the number, occurring the weeks ending 4/19-26/19 and 5/24/19, albeit fractionally (the latter two CLOSED four and three pennies above 10 respectively). It is lagging fellow Scandinavian telecommunications peer NOK, which is higher by 12% YTD, while ERIC is up 9% in 2020. Ericsson does REPORT earnings late next week as well, and it is following a one up, one down pattern the last 5 releases, higher by 2.9, 5.2 and 7.3% on 4/22, 10/17/19 and 4/17/19 (fell 7.2 and 10.9% on 1/24 and 7/17/19). The PRICE action will dictate future entries into this laggard, but a break above 10 could be powerful.
Recent Examples:
- The semiconductors have seen a broadening out within the space. That is a great sign, as one does not want to see just a handful of stocks shouldering the heavy load of carrying the group upon its shoulders. Newcomers are making their presence felt too with a good example being ACMR as it stormed above a cup base pivot of 69.35 this Monday. Below is yet another name flexing its muscles with the chart of TER, and how it appeared in our 7/1 Technology Note. Remember the best stocks give you a chance to add on the way UP, and this stock broke above a bull flag not long after taking out a cup with handle base. It is also well above the round 80 number, as it looks for its FOURTH consecutive CLOSE above the figure. That was an important level, as it took out 80 the week ending 1/24 but recorded a nasty reversal there, CLOSING more than 10% off intraweek highs. The WEEKLY chart has the look that it may want to duplicate the powerful one year long move from 30-80 between December '18 and January '20, which would put it near the very round par number, perhaps in the near term.
Special Situations:
- Computer services leader higher by 380% YTD and 372% over last one year period.
- Last week ended huge 8 week winning streak between weeks ending 5/8-6/26 jumping 327.7%, but still CLOSED in upper half of WEEKLY range. Eleven session winning streak between 6/12-26 was accompanied by huge volume.
- Last earnings reaction screamed higher by 45.7% on 5/7, ending 3 straight losses of 6, 1.5 and 18.1% on 2/21, 11/8 and 8/9/18.
- Enter on pullback into recent break above bull flag formation.
- Entry FSLY 93. Stop 86.
- Brazilian transaction services play up 13% YTD and lower by 5% over last one year period.
- Since week ending 3/27 there have been SIX double digit WEEKLY gains, versus one loss of same amount. Has jumped 193% since late March lows. Just above 37.46 WEEKLY double bottom pivot in pattern 11 months long too.
- Earnings reactions mostly higher with gains of 6.4, 10.8 and 9.4% on 5/29, 8/16 and 5/15/19 (fell 4.2 and 17.1% on 2/28 and 11/20/19).
- Enter after recent break above bullish inverse head and shoulders pattern.
- Entry PAGS here. Stop 36.50.
- "Old tech" computer services giant down 12% YTD and 16% over last one year period. Dividend yield of 5.5%.
- Still 26% off most recent 52 week highs, and never came close to revisiting February peaks like many peers did. Big distribution weeks ending 6/12 and 6/26 which fell 7.7 and 4.3% respectively and CLOSING hard on WEEKLY lows.
- Earnings mixed with gains of 3.4 and 4.6% on 1/22 and 7/18/19, and losses of 3 and 5.5% on 4/21 and 10/17/19.
- Enter with sell stop below bearish head and shoulders pattern.
- Entry IBM 115.50 Buy stop 121. (REPORTS 7/12 after close).
Good luck.
Entry summaries:
Buy pullback into recent break above bull flag FSLY 93. Stop 86.
Buy after recent break above bullish inverse head and shoulders PAGS here. Stop 36.50.
Sell stop below bearish head and shoulders IBM 115.50 Buy stop 121.