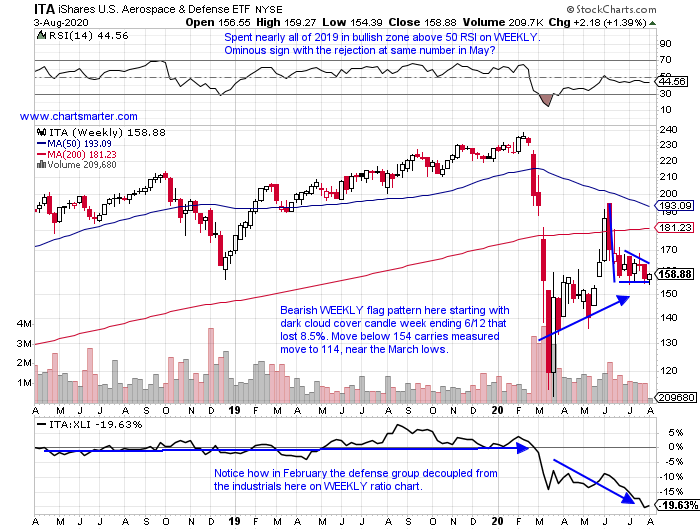
November Implications?
- Market participants tend to look for certain sectors for clues as to the outcome of the election coming up, and now that we are inside 100 days to the event, rhetoric will start to heat up on the topic. Some will point to the nascent weakness in biotech, other to the importance of the banking sector. Below we take a look at the current WEEKLY chart of the defense ETF, the ITA. Not helping the cause within is the performance of the top 2 holdings in BA and RTX, off by 59 and 39% from most recent 52 week highs respectively. Boeing is lower 7 of the last 8 weeks, with all 8 weeks CLOSING at or near lows for the WEEKLY range, a poor sign. On its daily chart the decline seems somewhat orderly, with the decline coming in fairly taut trade. KTOS looks to be the best actor in a wobbly group, although it has encountered resistance at the very round 20 number, all throughout 2020. Overall however when a specific group does not participate in a broad market advance, one should take notice (ITA now 34% off most recent 52 week highs, while the S&P 500 is off by 3%). Stocks are both cheap and expensive for a reason.
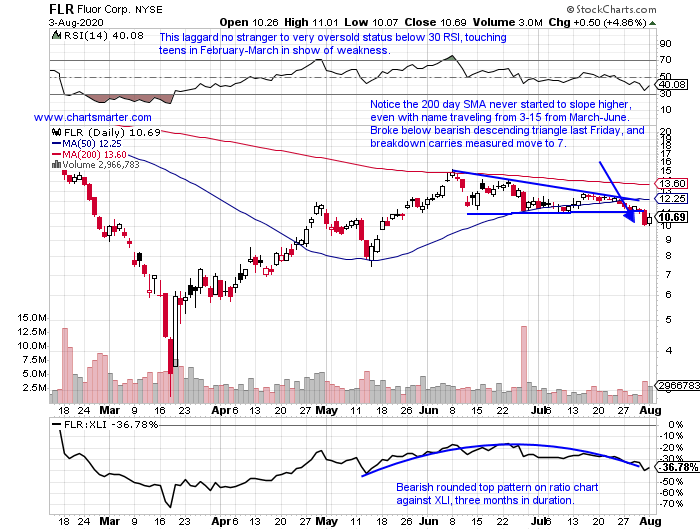
Flirting With Single Digits:
- It seems like every time the word infrastructure is thrown around in markets, the heavy construction group gets aroused. But the feeling is often short lived. Even a best in breed name like an ACM is still trading 29% off its most recent 52 week highs. Another name like a KBR is off about the same amount (PWR seems to be an exception in this current environment as it deals with the round 40 number, and sits just 6% off its own yearly peak). Below is the chart of a real laggard, which now trades 70% off its own most recent 52 week highs, not a typo, and this name traded in the 90's back in 2008. It recorded a massive move from 3-15, up 400% in a rapid few months, as a rising tide lifted basically all boats. It was stopped hard at its 200 day SMA, and last week alone it plunged 14.5%. Perhaps some exposure to the energy space has added to the firm instability in the company, but its PRICE action has been "heavy" to the downside to say the least.
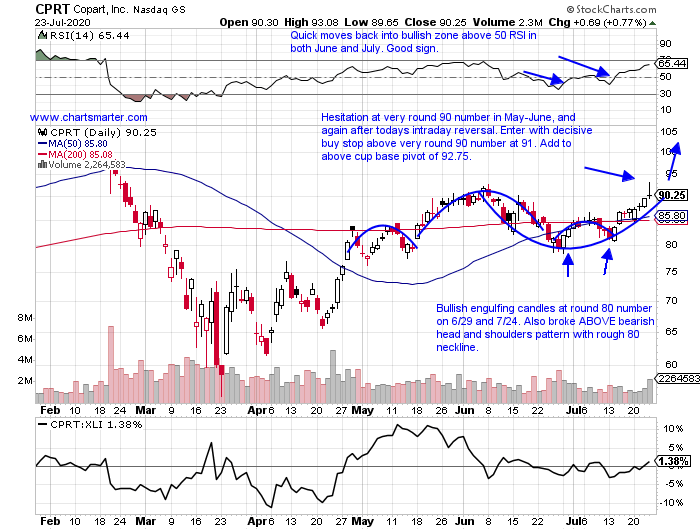
Recent Examples:
- In life, like in markets, the good things often take a little time. Remember in this very tough endeavor investors need to be patient and wait for their spots. Stocks will often waiver at former areas or resistance, but if they remain resolute and do not travel too far from a proper entry point, keep the name on your watchlist. Below could be a good example of that with the chart of CPRT, and how it appeared in our 7/24 Industrial Note. Notice how the very round 90 number only recorded two CLOSES above in early June on 6/5-8, and again it struggled there in late July, until the last 3 days of last week, all CLOSED above and right at highs for the daily range, a very good sign. Additionally it wavered near a cup base pivot of 92.75, recording a 3 point reversal there on 7/23. Last Friday it CLOSED above it, and look for this name to sniff out the very round par number in the near term.
Special Situations:
- Trucking leader higher by 20% YTD and 15% over last one year period. Dividend yield of 2.2%.
- Higher 13 of last 20 weeks and now a quick 6% off most recent 52 week highs, after rejected near very round par number late last week. 90 number should be support, after being resistance there in September-October '19.
- Last earnings reaction rose 9.3% on 7/29, but FOUR reports all fell by 3.7, 5.7, 14.8 and 1.2% on 4/29, 1/29, 10/30 and 7/31/19.
- Enter on pullback into very round number.
- Entry CHRW 92. Stop 85.
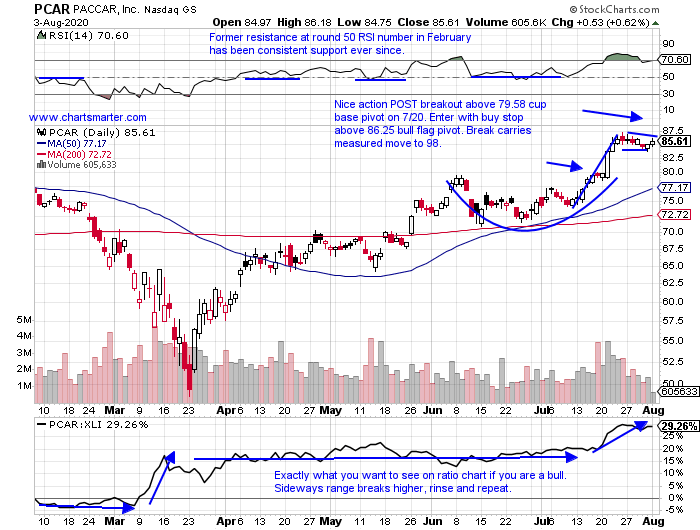
- Commercial vehicle play higher by 8% YTD and 27% over last one year period. Dividend yield of 1.5%.
- Fell less than .8% last week, as XLI fell fractionally as well. Good action as prior 2 weeks gained a combined 13.5%, both in above average WEEKLY volume.
- Earnings mostly higher with gains of 5, 2.1, 4.6 and .1% on 7/21, 1/28, 10/22 and 7/23/19 (fell 2.2% on 4/21).
- Enter with buy stop above bull flag formation.
- Entry PCAR 86.25. Stop 83.50.
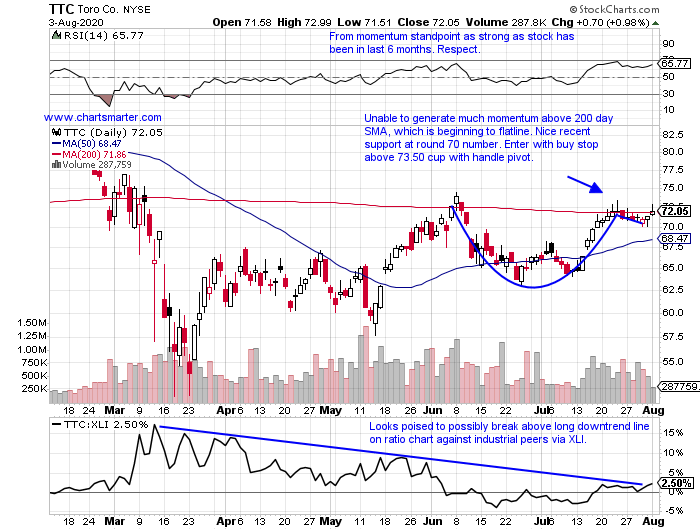
- Machinery play lower by 9% YTD and higher by 1% over last one year period. Dividend yield of 1.4%.
- Looking for first 4 week winning streak since January. Lagging a bit down 14% from most recent 52 week highs, but very bullsh pattern as last 3 weeks have all CLOSED very taut all within just .63 of each other.
- Earnings mostly lower with losses of 2.1, 6.3, 6.3 and 5.6% on 6/4, 3/5, 12/18 and 5/23/19 (rose .7% on 8/22/19).
- Enter with buy stop above cup with handle pivot.
- Entry TTC 73.50. Stop 69.
Good luck.
Entry summaries:
Buy pullback into very round number CHRW 92. Stop 85.
Buy stop above bull flag pattern PCAR 86.25. Stop 83.50.
Buy stop above cup with handle pivot TTC 73.50. Stop 69.
This article requires a Chartsmarter membership. Please click here to join.
November Implications?
- Market participants tend to look for certain sectors for clues as to the outcome of the election coming up, and now that we are inside 100 days to the event, rhetoric will start to heat up on the topic. Some will point to the nascent weakness in biotech, other to the importance of the banking sector. Below we take a look at the current WEEKLY chart of the defense ETF, the ITA. Not helping the cause within is the performance of the top 2 holdings in BA and RTX, off by 59 and 39% from most recent 52 week highs respectively. Boeing is lower 7 of the last 8 weeks, with all 8 weeks CLOSING at or near lows for the WEEKLY range, a poor sign. On its daily chart the decline seems somewhat orderly, with the decline coming in fairly taut trade. KTOS looks to be the best actor in a wobbly group, although it has encountered resistance at the very round 20 number, all throughout 2020. Overall however when a specific group does not participate in a broad market advance, one should take notice (ITA now 34% off most recent 52 week highs, while the S&P 500 is off by 3%). Stocks are both cheap and expensive for a reason.
Flirting With Single Digits:
- It seems like every time the word infrastructure is thrown around in markets, the heavy construction group gets aroused. But the feeling is often short lived. Even a best in breed name like an ACM is still trading 29% off its most recent 52 week highs. Another name like a KBR is off about the same amount (PWR seems to be an exception in this current environment as it deals with the round 40 number, and sits just 6% off its own yearly peak). Below is the chart of a real laggard, which now trades 70% off its own most recent 52 week highs, not a typo, and this name traded in the 90's back in 2008. It recorded a massive move from 3-15, up 400% in a rapid few months, as a rising tide lifted basically all boats. It was stopped hard at its 200 day SMA, and last week alone it plunged 14.5%. Perhaps some exposure to the energy space has added to the firm instability in the company, but its PRICE action has been "heavy" to the downside to say the least.
Recent Examples:
- In life, like in markets, the good things often take a little time. Remember in this very tough endeavor investors need to be patient and wait for their spots. Stocks will often waiver at former areas or resistance, but if they remain resolute and do not travel too far from a proper entry point, keep the name on your watchlist. Below could be a good example of that with the chart of CPRT, and how it appeared in our 7/24 Industrial Note. Notice how the very round 90 number only recorded two CLOSES above in early June on 6/5-8, and again it struggled there in late July, until the last 3 days of last week, all CLOSED above and right at highs for the daily range, a very good sign. Additionally it wavered near a cup base pivot of 92.75, recording a 3 point reversal there on 7/23. Last Friday it CLOSED above it, and look for this name to sniff out the very round par number in the near term.
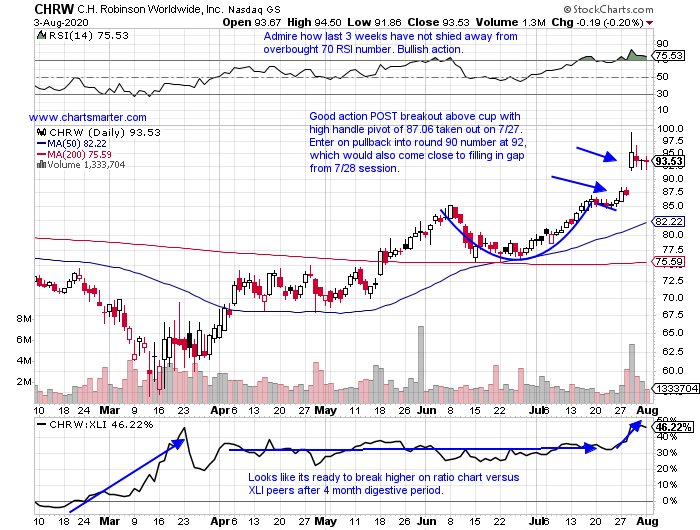
Special Situations:
- Trucking leader higher by 20% YTD and 15% over last one year period. Dividend yield of 2.2%.
- Higher 13 of last 20 weeks and now a quick 6% off most recent 52 week highs, after rejected near very round par number late last week. 90 number should be support, after being resistance there in September-October '19.
- Last earnings reaction rose 9.3% on 7/29, but FOUR reports all fell by 3.7, 5.7, 14.8 and 1.2% on 4/29, 1/29, 10/30 and 7/31/19.
- Enter on pullback into very round number.
- Entry CHRW 92. Stop 85.
- Commercial vehicle play higher by 8% YTD and 27% over last one year period. Dividend yield of 1.5%.
- Fell less than .8% last week, as XLI fell fractionally as well. Good action as prior 2 weeks gained a combined 13.5%, both in above average WEEKLY volume.
- Earnings mostly higher with gains of 5, 2.1, 4.6 and .1% on 7/21, 1/28, 10/22 and 7/23/19 (fell 2.2% on 4/21).
- Enter with buy stop above bull flag formation.
- Entry PCAR 86.25. Stop 83.50.
- Machinery play lower by 9% YTD and higher by 1% over last one year period. Dividend yield of 1.4%.
- Looking for first 4 week winning streak since January. Lagging a bit down 14% from most recent 52 week highs, but very bullsh pattern as last 3 weeks have all CLOSED very taut all within just .63 of each other.
- Earnings mostly lower with losses of 2.1, 6.3, 6.3 and 5.6% on 6/4, 3/5, 12/18 and 5/23/19 (rose .7% on 8/22/19).
- Enter with buy stop above cup with handle pivot.
- Entry TTC 73.50. Stop 69.
Good luck.
Entry summaries:
Buy pullback into very round number CHRW 92. Stop 85.
Buy stop above bull flag pattern PCAR 86.25. Stop 83.50.
Buy stop above cup with handle pivot TTC 73.50. Stop 69.