Caution Warranted:
- Candlesticks are a very useful strategy that can be used in bullish or bearish scenarios. I have found over the years they can offer good risk/reward and be accurate when trying to find a stock that could be bottoming. Calling a top in a specific name or index is a tricky endeavor as the markets do have a long term upward bias, but there is a candlestick that I have found with my experience can be helpful, if not in outrighting shorting, can be useful to exit or reduce one's position. The one I will show in this article, with several examples is the filled-in black candlestick. This often happens at short-term peaks with a stock, and it is when a name opens powerfully higher than the prior sessions CLOSE, but selling pressure appears throughout the day but does CLOSE above the prior sessions finish. It indicates fatigue and offers a good potential short entry with a stop above the filled-in black candlesticks intraday high. Let's take a look at a few situations where this played out. These rare candles often occur with events such as earnings announcements, etc. Use this post purely for educational purposes as some of these stocks have their own earnings reports coming this week.
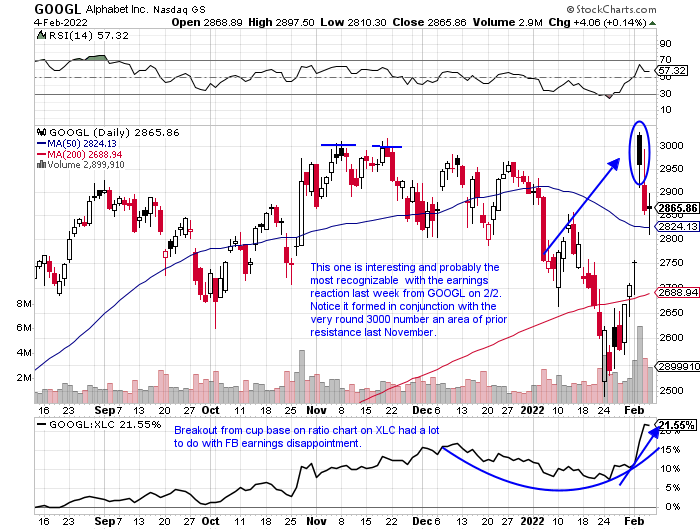
GOOGL:
- Earnings reaction on 2/2 met the very round 3000 number roadblock. A 200 handle range the last 3 days of last week, not a huge amount for this lofty PRICE figure (not much longer with split announced). Holding 50 day SMA and last week rose 7.5% in the best WEEKLY volume in nearly 2 years. The 3000 number very pivotal as it was resistance during an incredibly 3 week taut period between weeks ending 11/5-19 that all CLOSED within just $5 of each other.
AMD:
- Name now 25% off early December 2021 highs even with the WEEKLY gain of 17.5% ending 2/4 (SMH just 15% off its annual peak) . Strong bounce off very round par number week ending 1/28, which retested a WEEKLY cup base pivot the week ending 7/30/21 in a 6 month base.

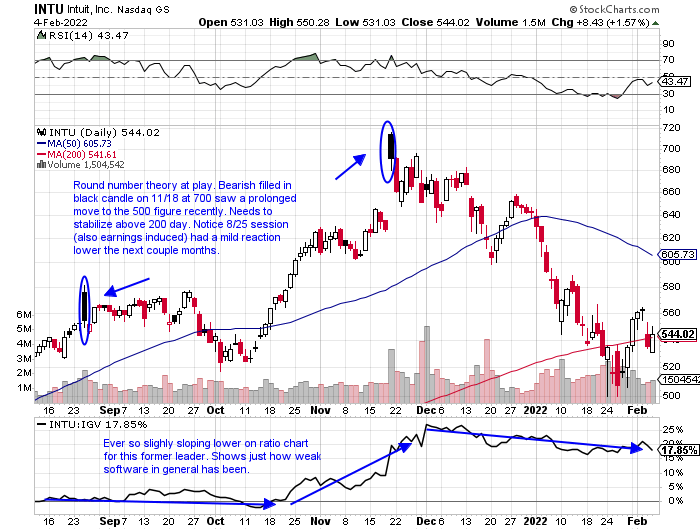
INTU:
- Former best in breed software name attempting to reclaim that status. Bullish hammer candle reversing higher off round 500 number week ending 1/28. Plenty of distribution recently with 12/3, 12/17 and 1/7 all lower in greater than average WEEKLY volume. Filled in black candle from 8/25/21 did not produce sizable drawdown, but did take 2 months before trading above the intraday session highs.
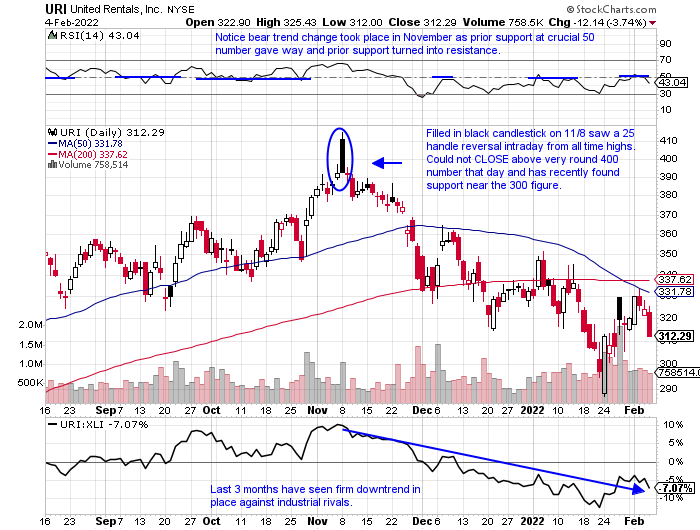
URI:
- Stock did record a bearish death cross last week, but those often occur after most of the technical damage has already been done. Name now lower 8 of the last 12 weeks since the filled in black candle on 11/8. Poor relative strength last week declining 1.7% as the S&P 500 rose 1.6%. XLI now teetering on very round 100 number. ETF has now touched that figure since times since last May, and support there may be giving way.
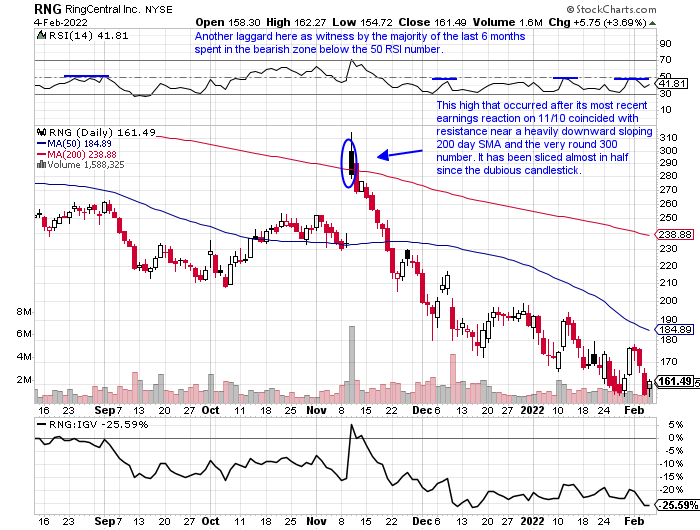
RNG:
- Former software general now 64% off most recent 52 week highs. Not seen before on the chart below, but name had already encountered problems from the 450 level in February 2021. The stock has now lost value 10 of the last 12 weeks, including two that lost more than double digits.
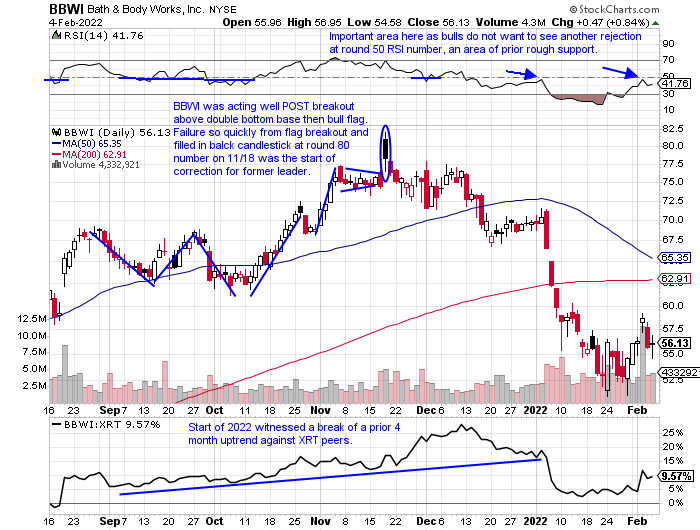
BBWI:
- Name now 32% off most recent 52 week highs and this chart was a positive one up until less than 3 months ago. It shows one not to fall in love with a great story and pay close attention to the technicals as things could change fast. Give credit for the move from a 6 handle in March 2020 to a recent high near 82.
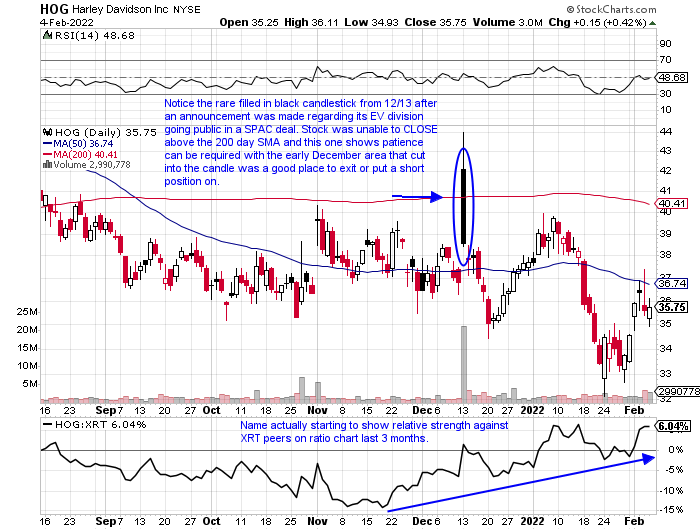
HOG:
- Name now 31% off most recent 52 week highs after a rejection near the very round 50 number in the spring of 2021. Since last September the round 40 number has given the stock push back. It is on a current 2 week winning streak and to demonstrate the stocks overall weakness it has been unable to produce a 3 week winning streak since late April and early May 2021.
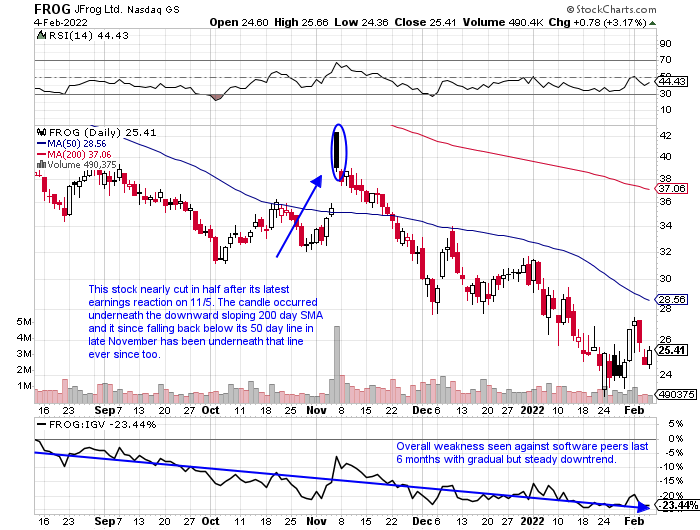
FROG:
- Name now 65% off most recent 52 week highs, and even more from a bearish reversal just weeks after coming public the week ending 10/30/20 not far from the very round 100 number. It has been making WEEKLY highs and lows since September 2020 and has fallen victim most likely to the over abundance of software new issues in recent years.
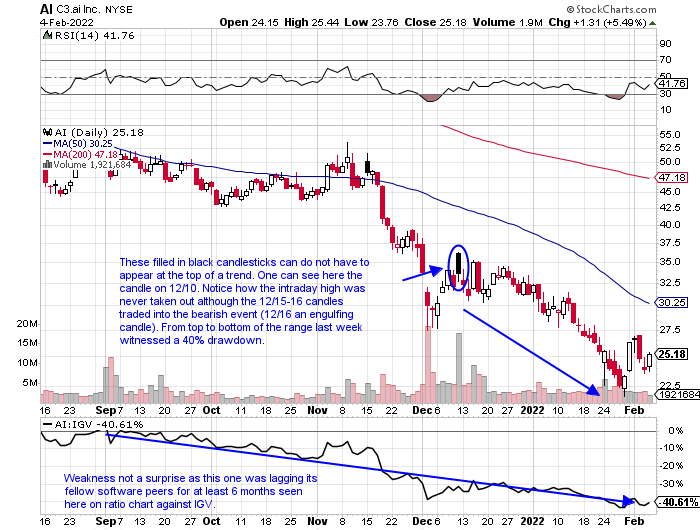
AI:
- The weakest chart in the note now 86% off most recent 52 week highs, not a typo. Chart has almost traced an exact replica of the one just above in FROG. Name came public to much fanfare and since the week ending 2/19/21, almost one year ago, has advanced on a WEEKLY basis just 18 times.
Click here to learn more about ChartSmarter research available through IBKR Account Management.
This article requires a Chartsmarter membership. Please click here to join.
Caution Warranted:
- Candlesticks are a very useful strategy that can be used in bullish or bearish scenarios. I have found over the years they can offer good risk/reward and be accurate when trying to find a stock that could be bottoming. Calling a top in a specific name or index is a tricky endeavor as the markets do have a long term upward bias, but there is a candlestick that I have found with my experience can be helpful, if not in outrighting shorting, can be useful to exit or reduce one's position. The one I will show in this article, with several examples is the filled-in black candlestick. This often happens at short-term peaks with a stock, and it is when a name opens powerfully higher than the prior sessions CLOSE, but selling pressure appears throughout the day but does CLOSE above the prior sessions finish. It indicates fatigue and offers a good potential short entry with a stop above the filled-in black candlesticks intraday high. Let's take a look at a few situations where this played out. These rare candles often occur with events such as earnings announcements, etc. Use this post purely for educational purposes as some of these stocks have their own earnings reports coming this week.
GOOGL:
- Earnings reaction on 2/2 met the very round 3000 number roadblock. A 200 handle range the last 3 days of last week, not a huge amount for this lofty PRICE figure (not much longer with split announced). Holding 50 day SMA and last week rose 7.5% in the best WEEKLY volume in nearly 2 years. The 3000 number very pivotal as it was resistance during an incredibly 3 week taut period between weeks ending 11/5-19 that all CLOSED within just $5 of each other.
AMD:
- Name now 25% off early December 2021 highs even with the WEEKLY gain of 17.5% ending 2/4 (SMH just 15% off its annual peak) . Strong bounce off very round par number week ending 1/28, which retested a WEEKLY cup base pivot the week ending 7/30/21 in a 6 month base.
INTU:
- Former best in breed software name attempting to reclaim that status. Bullish hammer candle reversing higher off round 500 number week ending 1/28. Plenty of distribution recently with 12/3, 12/17 and 1/7 all lower in greater than average WEEKLY volume. Filled in black candle from 8/25/21 did not produce sizable drawdown, but did take 2 months before trading above the intraday session highs.
URI:
- Stock did record a bearish death cross last week, but those often occur after most of the technical damage has already been done. Name now lower 8 of the last 12 weeks since the filled in black candle on 11/8. Poor relative strength last week declining 1.7% as the S&P 500 rose 1.6%. XLI now teetering on very round 100 number. ETF has now touched that figure since times since last May, and support there may be giving way.
RNG:
- Former software general now 64% off most recent 52 week highs. Not seen before on the chart below, but name had already encountered problems from the 450 level in February 2021. The stock has now lost value 10 of the last 12 weeks, including two that lost more than double digits.
BBWI:
- Name now 32% off most recent 52 week highs and this chart was a positive one up until less than 3 months ago. It shows one not to fall in love with a great story and pay close attention to the technicals as things could change fast. Give credit for the move from a 6 handle in March 2020 to a recent high near 82.
HOG:
- Name now 31% off most recent 52 week highs after a rejection near the very round 50 number in the spring of 2021. Since last September the round 40 number has given the stock push back. It is on a current 2 week winning streak and to demonstrate the stocks overall weakness it has been unable to produce a 3 week winning streak since late April and early May 2021.
FROG:
- Name now 65% off most recent 52 week highs, and even more from a bearish reversal just weeks after coming public the week ending 10/30/20 not far from the very round 100 number. It has been making WEEKLY highs and lows since September 2020 and has fallen victim most likely to the over abundance of software new issues in recent years.
AI:
- The weakest chart in the note now 86% off most recent 52 week highs, not a typo. Chart has almost traced an exact replica of the one just above in FROG. Name came public to much fanfare and since the week ending 2/19/21, almost one year ago, has advanced on a WEEKLY basis just 18 times.
Click here to learn more about ChartSmarter research available through IBKR Account Management.