Seasonality Tailwinds?
- As the XLF still trades down 9% YTD and is in the middle of the pack against the 11 major S&P sectors, over the last one month it is just one of 4 groups in the green. Sure the move higher in the ten-year is helping, and that instrument bounced nicely off its rising 50-day SMA and now sports a double bottom right at the "round" 3 number for a possible add-on. The XLF itself has declined 7 of the last 9 weeks and is down another .5% this week heading into Friday, showing little follow-through after the prior week jumped an aggressive 8%. The curious question is why did the banks not act better with the ten-year rising? Could it be that the banks will start to benefit if the ten-year happens to decline and surprise us once again? The TNX is on a 3-week losing streak, the first of this year, and below we see how seasonality factors may come into favor for the XLF. The XLF seems to rise in spurts over the last 5 years, particularly in April-May, July-August, and November-December. Maybe a bit of patience as the XLF tends to undergo weakness in June, but the markets tend to look ahead.

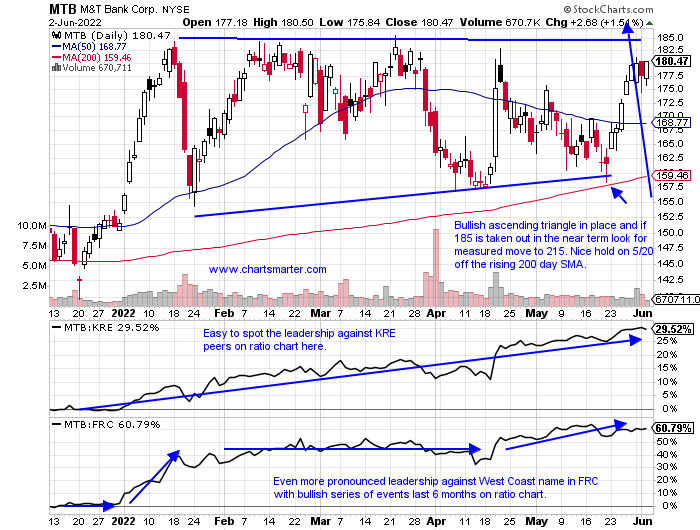
Regional Bank Bifurcation:
- As we will discuss later the regional bank names have been experiencing some softness. But as one wanders through the space and sees strength it is something they should note. If certain stocks are shrugging off the weakness somewhat, that is often a tell as to when the group starts to cooperate with PRICE action those names will normally be the first out of the block higher to lead. Below is a good example of that with the chart of MTB. It is still a bit early for an entry, but keep this on your watch list for any impending strength. MTB is now just 4% off most recent 52-week highs, while the KRE is now 18% off its annual peak made in mid-January. And if you want to compare it to an individual stock laggard, perhaps a good pair would be to sell FRC which is 30% off its most recent 52-week highs and currently dealing with downward sloping 50-day SMA resistance. That line has been a pest since breaking below last December.
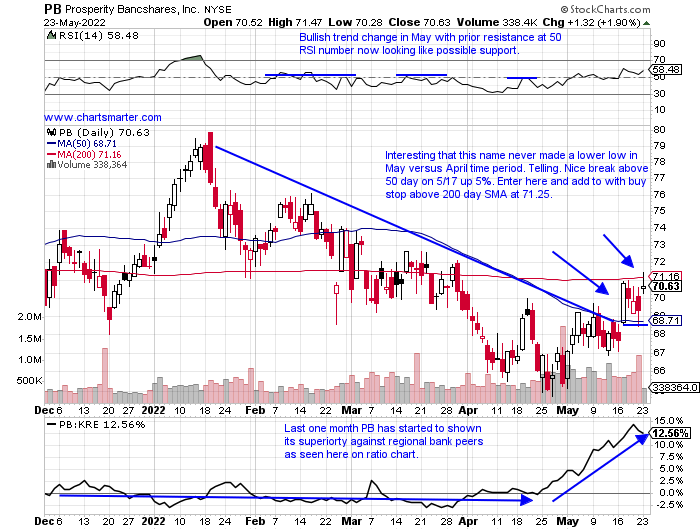
Recent Examples:
- Within the diverse banking sector, the regional banks via the KRE are stuck below the 50 and 200-day SMAs. If one was to look inside the space for strength the chart below may satisfy your needs. It is PB and how it appeared in our 5/24 Financial Note. This one is located in the South which may have an advantage with tax-friendly regions, but all I care about is the PRICE action. It is still right at the suggested entry and after breaking above its 50-day SMA on 5/17 and recording 7 straight CLOSES above the line, it has now recorded five consecutive CLOSES above its 200-day SMA. One has to respect how its 200-day19. SMA never really sloped to hard lower the last 6 months in an overall soft sector. This name can potentially run toward the round 80 number last seen this January with a big reversal there on 1/19.
Special Situations:
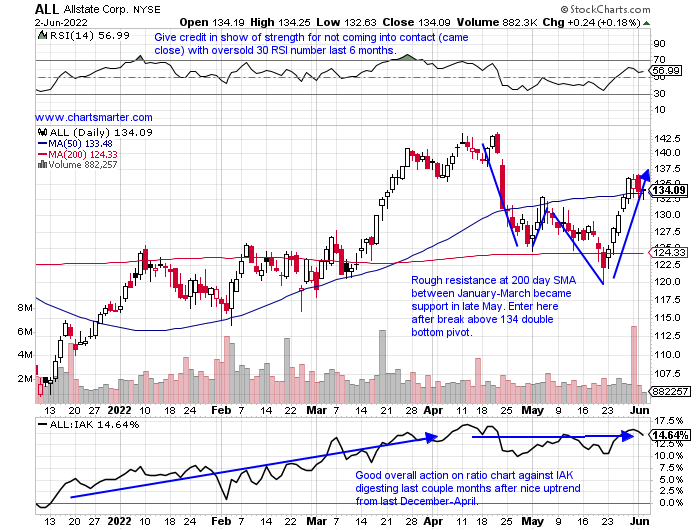
- Insurance name higher by 13% YTD and lower by 3% over last one year period. Dividend yield of 2.5%.
- Name 8% off most recent 52-week highs and rose 11.3% last week. Advanced 15% the 2 weeks ending between 3/18-25 and nice action overall since WEEKLY bullish hammer week ending 2/4 in largest WEEKLY volume since week ending 2/9/18.
- Earnings mostly lower with losses of 1.6, 7.1, and .7% on 5/5, 11/4, and 8/5/21 (rose 3.4% on 2/3).
- Enter on retest of double bottom breakout.
- Entry ALL here. Stop 133.
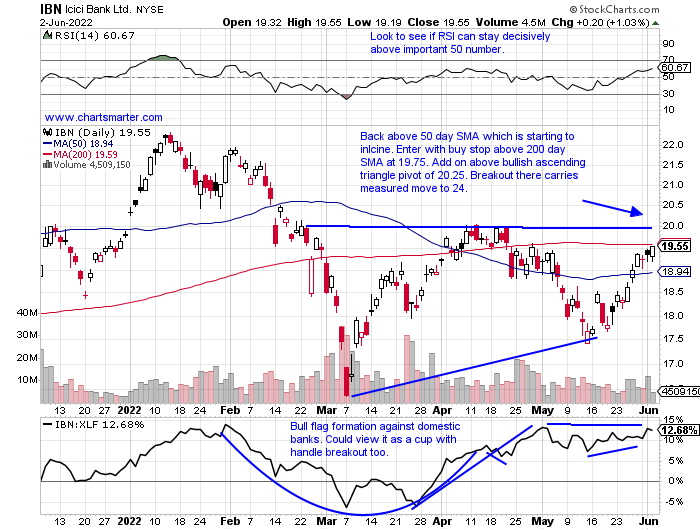
- Indian bank down 1% YTD and higher by 9% over last one year period. Dividend yield of .3%.
- Name 13% off most recent 52 week highs and lower 4 of last 7 weeks, but last 2 up by a combined 10%. Nice overall action since week ending 3/11 which recorded bullish counterattack candle.
- FOUR consecutive positive earnings reactions (7 in total) up 3, .3, 9.9 and .4% on 4/25, 1/24, 10/25 and 7/26/21.
- Enter with buy stop above 200 day SMA.
- Entry IBN 19.75. Stop 18.75.
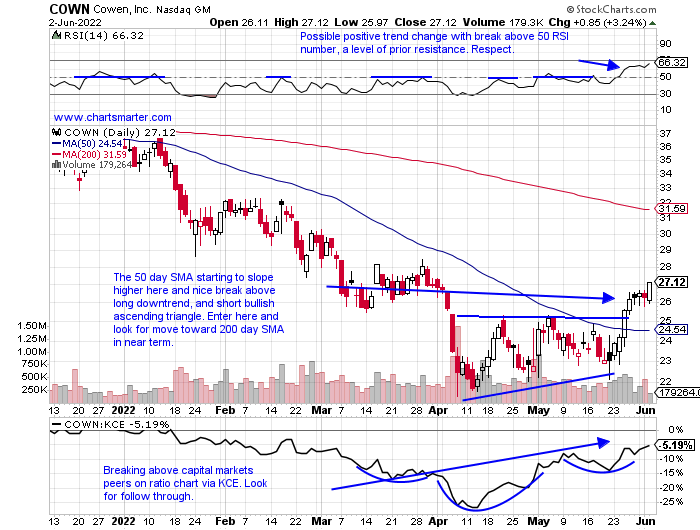
- Capital markets play down 25% YTD and 31% over last one-year period. Dividend yield of 1.8%.
- Name 39% off most recent 52-week highs and rose 14.1% last week, its best WEEKLY advance since week ending 3/12/21. Recorded incredible run between March '20-March '21 down just 16 weeks and traveling from 5 to 43.
- Earnings mixed with gains of 3.6 and 3% on 2/16 and 7/28/21 and losses of .4 and 1% on 4/29 and 10/29/21.
- Enter after break above ascending triangle/50 day SMA.
- Entry COWN here. Stop 25.
Good luck.
Entry summaries:
Buy retest of double bottom breakout ALL here. Stop 133.
Buy stop above 200 day SMA IBN 19.75. Stop 18.75.
Buy after break above ascending triangle/50 day SMA COWN here. Stop 25.
This article requires a Chartsmarter membership. Please click here to join.
Seasonality Tailwinds?
- As the XLF still trades down 9% YTD and is in the middle of the pack against the 11 major S&P sectors, over the last one month it is just one of 4 groups in the green. Sure the move higher in the ten-year is helping, and that instrument bounced nicely off its rising 50-day SMA and now sports a double bottom right at the "round" 3 number for a possible add-on. The XLF itself has declined 7 of the last 9 weeks and is down another .5% this week heading into Friday, showing little follow-through after the prior week jumped an aggressive 8%. The curious question is why did the banks not act better with the ten-year rising? Could it be that the banks will start to benefit if the ten-year happens to decline and surprise us once again? The TNX is on a 3-week losing streak, the first of this year, and below we see how seasonality factors may come into favor for the XLF. The XLF seems to rise in spurts over the last 5 years, particularly in April-May, July-August, and November-December. Maybe a bit of patience as the XLF tends to undergo weakness in June, but the markets tend to look ahead.
Regional Bank Bifurcation:
- As we will discuss later the regional bank names have been experiencing some softness. But as one wanders through the space and sees strength it is something they should note. If certain stocks are shrugging off the weakness somewhat, that is often a tell as to when the group starts to cooperate with PRICE action those names will normally be the first out of the block higher to lead. Below is a good example of that with the chart of MTB. It is still a bit early for an entry, but keep this on your watch list for any impending strength. MTB is now just 4% off most recent 52-week highs, while the KRE is now 18% off its annual peak made in mid-January. And if you want to compare it to an individual stock laggard, perhaps a good pair would be to sell FRC which is 30% off its most recent 52-week highs and currently dealing with downward sloping 50-day SMA resistance. That line has been a pest since breaking below last December.
Recent Examples:
- Within the diverse banking sector, the regional banks via the KRE are stuck below the 50 and 200-day SMAs. If one was to look inside the space for strength the chart below may satisfy your needs. It is PB and how it appeared in our 5/24 Financial Note. This one is located in the South which may have an advantage with tax-friendly regions, but all I care about is the PRICE action. It is still right at the suggested entry and after breaking above its 50-day SMA on 5/17 and recording 7 straight CLOSES above the line, it has now recorded five consecutive CLOSES above its 200-day SMA. One has to respect how its 200-day19. SMA never really sloped to hard lower the last 6 months in an overall soft sector. This name can potentially run toward the round 80 number last seen this January with a big reversal there on 1/19.
Special Situations:
- Insurance name higher by 13% YTD and lower by 3% over last one year period. Dividend yield of 2.5%.
- Name 8% off most recent 52-week highs and rose 11.3% last week. Advanced 15% the 2 weeks ending between 3/18-25 and nice action overall since WEEKLY bullish hammer week ending 2/4 in largest WEEKLY volume since week ending 2/9/18.
- Earnings mostly lower with losses of 1.6, 7.1, and .7% on 5/5, 11/4, and 8/5/21 (rose 3.4% on 2/3).
- Enter on retest of double bottom breakout.
- Entry ALL here. Stop 133.
- Indian bank down 1% YTD and higher by 9% over last one year period. Dividend yield of .3%.
- Name 13% off most recent 52 week highs and lower 4 of last 7 weeks, but last 2 up by a combined 10%. Nice overall action since week ending 3/11 which recorded bullish counterattack candle.
- FOUR consecutive positive earnings reactions (7 in total) up 3, .3, 9.9 and .4% on 4/25, 1/24, 10/25 and 7/26/21.
- Enter with buy stop above 200 day SMA.
- Entry IBN 19.75. Stop 18.75.
- Capital markets play down 25% YTD and 31% over last one-year period. Dividend yield of 1.8%.
- Name 39% off most recent 52-week highs and rose 14.1% last week, its best WEEKLY advance since week ending 3/12/21. Recorded incredible run between March '20-March '21 down just 16 weeks and traveling from 5 to 43.
- Earnings mixed with gains of 3.6 and 3% on 2/16 and 7/28/21 and losses of .4 and 1% on 4/29 and 10/29/21.
- Enter after break above ascending triangle/50 day SMA.
- Entry COWN here. Stop 25.
Good luck.
Entry summaries:
Buy retest of double bottom breakout ALL here. Stop 133.
Buy stop above 200 day SMA IBN 19.75. Stop 18.75.
Buy after break above ascending triangle/50 day SMA COWN here. Stop 25.