Inflation Topping?
- This week's note will have an inflation theme. Of course, this is casting a pall on markets, and if there is some reprieve perhaps the benchmarks can continue to climb the proverbial "wall of worry" during this very nascent, and tenuous rally. One thing that caught my eye this past week was the headline below about the state of the summer rental market. I have some anecdotal evidence as we rent our home on the South Fork of Long Island and every potential occupant is looking for a sizable discount compared to the last couple of summers. This could be an issue related to the prior 2 years due to the COVID premium disappearing, or is it a sign of things to come? They say inflation is a regressive tax, as it hurts the lower income bracket harder, but in this particular situation, we can see it filtering into the affluent.

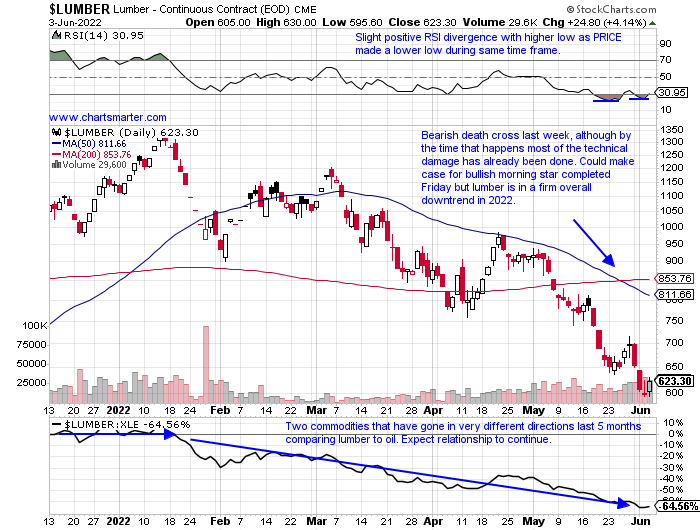
Timber.......
- Some commodities have been flashing warning signs that inflation could be waning. Some steel stock PRICE action could be suggesting that. X is now 37% off most recent 52-week highs as it sports a bear flag formation, trading below its 200-day SMA. The 4 weeks ending between 4/22-5/13 all lost 9-10% each CLOSING right at the bottom of the WEEKLY range. Palladium since a strong reversal in early March near 3400 is now just back below the very round 2000 number. WEAT, the wheat ETF, has come in hard the last couple of weeks and is quickly moving toward the very round 10 figure. In the chart below of timber, one can see the persistent downtrend in 2022 thus far. Round number theory is coming into play as it tries to find a floor, pun intended, at the 600 figure. Perhaps a dead cat bounce is in store but this trend looks firmly in place to the downside.
Energy Surge Lives On:
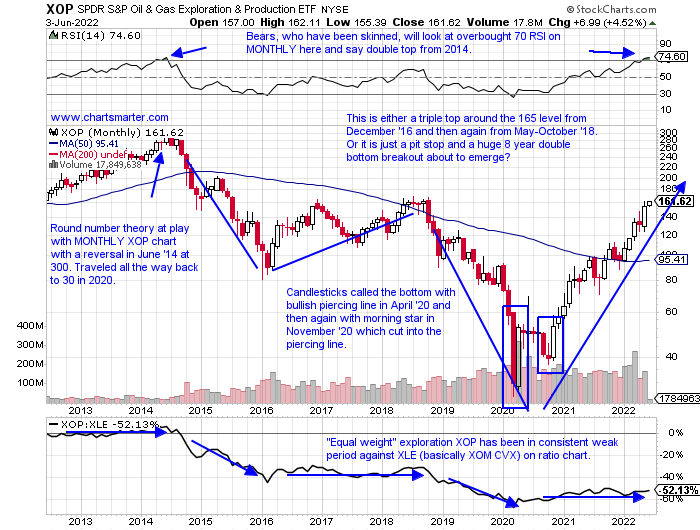
- Of course, unless one has been living under a rock for the last couple of years they know how relentless this uptrend has been. The XLE is easily the best performing major S&P sector this year after doing much of the same in 2021. The ETF is dealing with the very round 90 number here trading into the upper half of a bearish engulfing candle from 5/31. I would not be surprised if this shrugs off that candle and marches toward at least par going into summer. Looking at the OIH it is now in its third stint trading just above the very round 300 number and comfortably above a double bottom breakout pivot of 286.82. Below is an interesting MONTHLY chart of the "equal weight" XOP. This is a major area, and it is advantage for bulls as the trend it has come from into this area of importance is firmly up. This is not crude but names in this diverse ETF will react to the PRICE of oil. The big question is if energy does reverse lower from here, doubtful, will the market react poorly as it loses leadership or with capital be allocated to other sectors?
Materials To Benefit If Inflation Concerns?
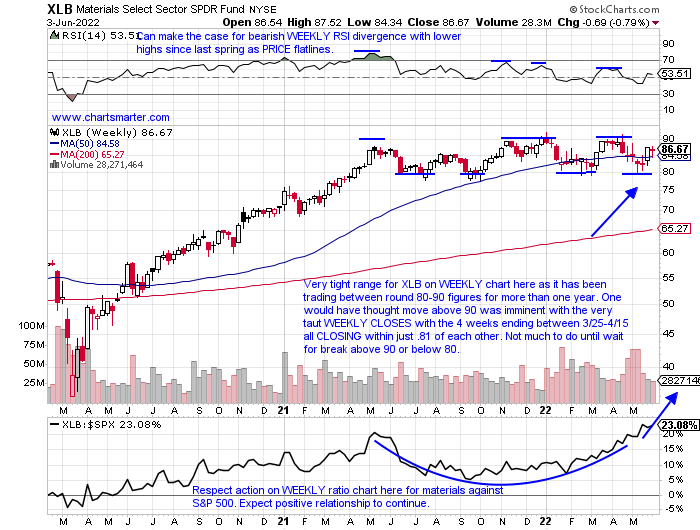
- Looking at the YTD tables of the 11 major S&P sectors there is a defensive flavor atop the leaderboard. Energy is the best behaved followed by the utilities and staples in second and third. Just behind them is the materials group with the XLB lower by 4%. Contributing to the performance in 2022 are steel, gold, paper, and aluminum names. ATI and TS are above both their 50 and 200-day SMAs with TS sporting a bull flag pattern. Within gold NEM and GOLD look most attractive with the latter clinging to the very round 20 number and 200 day SMA. Looking overall at the group the chart of the XLB has been trading in a somewhat narrow range between 80-90 for more than a year. My guess is that it will break to the upside as the digestion was preceded by a robust uptrend, but I only act on PRICE confirmation. A WEEKLY CLOSE above 90 would see a likely move toward par fairly quickly.
Individual Names To Watch In Materials Space:
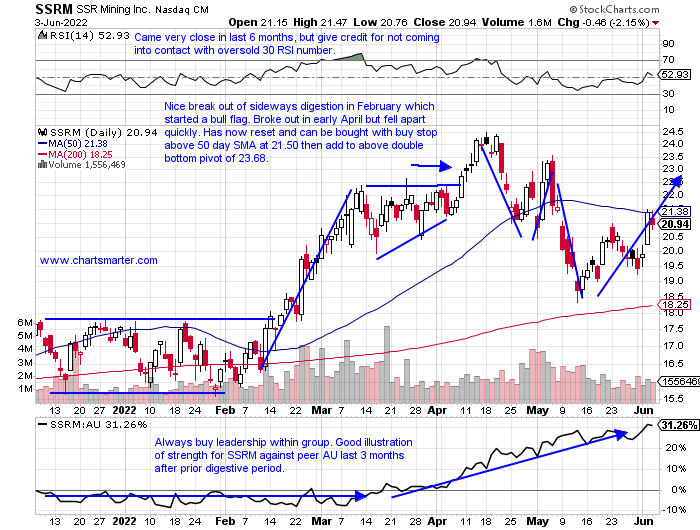
- Gold play up 18% YTD and 19% over last one-year period. Dividend yield of 1.3%.
- Name 15% off most recent 52-week highs while peers NEM and AU are 21 and 34% off their respective annual peaks. Good relative strength last week up 5.9% as GLD was lower by .2%.
- FOUR straight positive earnings reactions up 3.3, 9.5, 10, and 3.8% on 5/4, 2/3, 11/3, and 8/4/21.
- Enter with buy stop above 50-day SMA.
- Entry SSRM 21.50. Stop 19.75.
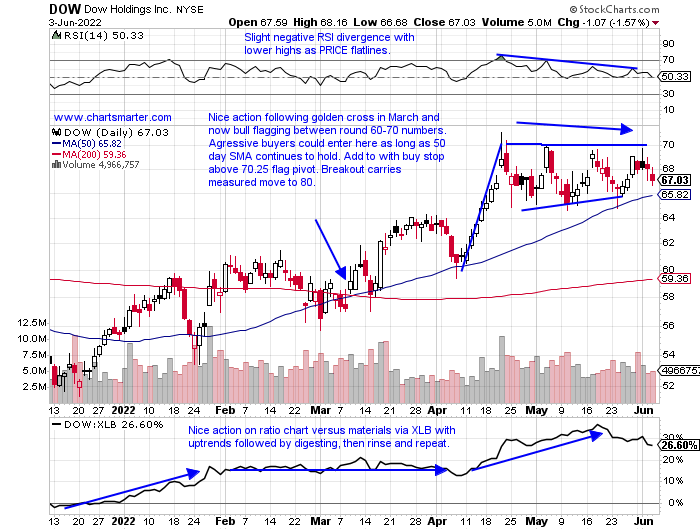
- Chemical play up 18% YTD and down 5% over last one year period. Dividend yield of 4.2%.
- Name 7% from most recent 52-week highs and advanced 8 of last 13 weeks. On the WEEKLY chart could see this as a year-long cup base. Round 70 number playing roadblock role here.
- Earnings mostly higher by 2.9, 5.2, and 1.3% on 4/21, 1/27, and 7/22/21 (fell 1% on 10/21/21).
- Enter with buy stop above bull flag.
- Entry DOW 70.25. Stop 66.
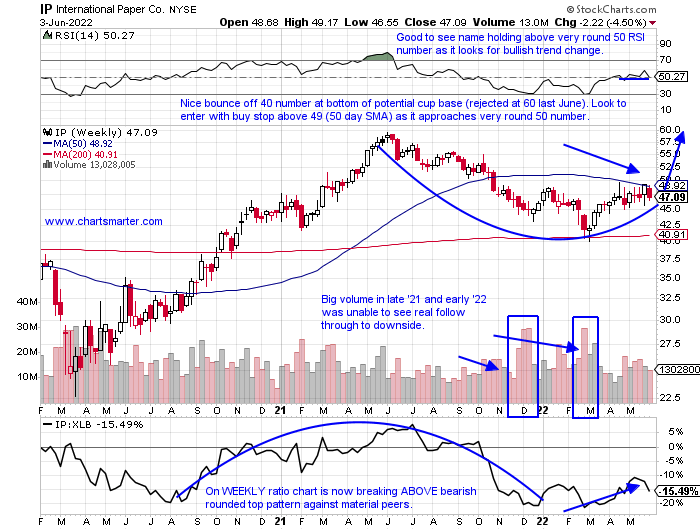
- Paper play UNCH YTD and down 23% over last one year period. Dividend yield of 3.9%.
- Name 24% off most recent 52-week highs and very round 50 number has pushed the stock back this January, April, and currently. Down 4 of the last 6 weeks and this week fell 4.5%.
- Earnings mostly lower by 1.9, 5.4, and .8% on 1/27, 10/27, and 7/29/21 and rose .2% on 4/28.
- Enter with buy stop above WEEKLY 50 day SMA.
- Entry IP 49. Stop 45.
Diner Indigestion (discretionary play feeling inflation pinch):
- Casual diner new issue down 46% YTD and 35% over last 3 month period.
- Name 69% off most recent 52-week highs and lower 8 of the last 10 weeks including FOUR double-digit WEEKLY decliners. Has given back most of huge WEEKLY gain ending 5/20 that jumped 16.6% in strongest WEEKLY volume yet.
- Small sample size with earnings with one gain of 25.4% on 3/4 and a loss of 8.9% on 5/6.
- Enter short on push into very round number.
- Entry SG 19.50. Buy stop 22.

Good luck.
This article requires a Chartsmarter membership. Please click here to join.
Inflation Topping?
- This week's note will have an inflation theme. Of course, this is casting a pall on markets, and if there is some reprieve perhaps the benchmarks can continue to climb the proverbial "wall of worry" during this very nascent, and tenuous rally. One thing that caught my eye this past week was the headline below about the state of the summer rental market. I have some anecdotal evidence as we rent our home on the South Fork of Long Island and every potential occupant is looking for a sizable discount compared to the last couple of summers. This could be an issue related to the prior 2 years due to the COVID premium disappearing, or is it a sign of things to come? They say inflation is a regressive tax, as it hurts the lower income bracket harder, but in this particular situation, we can see it filtering into the affluent.
Timber.......
- Some commodities have been flashing warning signs that inflation could be waning. Some steel stock PRICE action could be suggesting that. X is now 37% off most recent 52-week highs as it sports a bear flag formation, trading below its 200-day SMA. The 4 weeks ending between 4/22-5/13 all lost 9-10% each CLOSING right at the bottom of the WEEKLY range. Palladium since a strong reversal in early March near 3400 is now just back below the very round 2000 number. WEAT, the wheat ETF, has come in hard the last couple of weeks and is quickly moving toward the very round 10 figure. In the chart below of timber, one can see the persistent downtrend in 2022 thus far. Round number theory is coming into play as it tries to find a floor, pun intended, at the 600 figure. Perhaps a dead cat bounce is in store but this trend looks firmly in place to the downside.
Energy Surge Lives On:
- Of course, unless one has been living under a rock for the last couple of years they know how relentless this uptrend has been. The XLE is easily the best performing major S&P sector this year after doing much of the same in 2021. The ETF is dealing with the very round 90 number here trading into the upper half of a bearish engulfing candle from 5/31. I would not be surprised if this shrugs off that candle and marches toward at least par going into summer. Looking at the OIH it is now in its third stint trading just above the very round 300 number and comfortably above a double bottom breakout pivot of 286.82. Below is an interesting MONTHLY chart of the "equal weight" XOP. This is a major area, and it is advantage for bulls as the trend it has come from into this area of importance is firmly up. This is not crude but names in this diverse ETF will react to the PRICE of oil. The big question is if energy does reverse lower from here, doubtful, will the market react poorly as it loses leadership or with capital be allocated to other sectors?
Materials To Benefit If Inflation Concerns?
- Looking at the YTD tables of the 11 major S&P sectors there is a defensive flavor atop the leaderboard. Energy is the best behaved followed by the utilities and staples in second and third. Just behind them is the materials group with the XLB lower by 4%. Contributing to the performance in 2022 are steel, gold, paper, and aluminum names. ATI and TS are above both their 50 and 200-day SMAs with TS sporting a bull flag pattern. Within gold NEM and GOLD look most attractive with the latter clinging to the very round 20 number and 200 day SMA. Looking overall at the group the chart of the XLB has been trading in a somewhat narrow range between 80-90 for more than a year. My guess is that it will break to the upside as the digestion was preceded by a robust uptrend, but I only act on PRICE confirmation. A WEEKLY CLOSE above 90 would see a likely move toward par fairly quickly.
Individual Names To Watch In Materials Space:
- Gold play up 18% YTD and 19% over last one-year period. Dividend yield of 1.3%.
- Name 15% off most recent 52-week highs while peers NEM and AU are 21 and 34% off their respective annual peaks. Good relative strength last week up 5.9% as GLD was lower by .2%.
- FOUR straight positive earnings reactions up 3.3, 9.5, 10, and 3.8% on 5/4, 2/3, 11/3, and 8/4/21.
- Enter with buy stop above 50-day SMA.
- Entry SSRM 21.50. Stop 19.75.
- Chemical play up 18% YTD and down 5% over last one year period. Dividend yield of 4.2%.
- Name 7% from most recent 52-week highs and advanced 8 of last 13 weeks. On the WEEKLY chart could see this as a year-long cup base. Round 70 number playing roadblock role here.
- Earnings mostly higher by 2.9, 5.2, and 1.3% on 4/21, 1/27, and 7/22/21 (fell 1% on 10/21/21).
- Enter with buy stop above bull flag.
- Entry DOW 70.25. Stop 66.
- Paper play UNCH YTD and down 23% over last one year period. Dividend yield of 3.9%.
- Name 24% off most recent 52-week highs and very round 50 number has pushed the stock back this January, April, and currently. Down 4 of the last 6 weeks and this week fell 4.5%.
- Earnings mostly lower by 1.9, 5.4, and .8% on 1/27, 10/27, and 7/29/21 and rose .2% on 4/28.
- Enter with buy stop above WEEKLY 50 day SMA.
- Entry IP 49. Stop 45.
Diner Indigestion (discretionary play feeling inflation pinch):
- Casual diner new issue down 46% YTD and 35% over last 3 month period.
- Name 69% off most recent 52-week highs and lower 8 of the last 10 weeks including FOUR double-digit WEEKLY decliners. Has given back most of huge WEEKLY gain ending 5/20 that jumped 16.6% in strongest WEEKLY volume yet.
- Small sample size with earnings with one gain of 25.4% on 3/4 and a loss of 8.9% on 5/6.
- Enter short on push into very round number.
- Entry SG 19.50. Buy stop 22.
Good luck.