Complacency:
- Are we tired of hearing that word yet? It is the new "transitory", and that word in itself is an oxymoron as we have heard that word daily for it feels like a couple of years. Well, complacency is what could describe the WEEKLY chart below of the VIX. The instrument, believe it or not, is in your technical definition of a bear market, 20% off the high made in January near 39. It has produced back-to-back double-digit gains, but each time pressing the 35 area on a WEEKLY CLOSING basis it is repelled. To me, this has the feeling of a potential beach ball held underwater breakout. Meaning when we climb above 40 that is when we may begin to see the "white in their eyes" panic feeling and this could burst upward in a violent fashion. Throughout 2022 the VIX has found a floor at the very round 20 number and support at its rising 50 and 200-day SMAs, recording a bullish golden cross in the process. The right side of a cup-base could be forming and I am not sure it will reach the peak of 85 in March 2020 but higher PRICES feel necessary.

Rates Topping?
- This seems to be the consensus, and as much as I like being somewhat of a "contrarian" I have been taught that consensus is usually correct. Some bearish candlesticks were recorded with a big reversal Thursday on the TBT (20-year note) as that session engulfed the first 3 days of this week. The resolution downward Friday was somewhat muted as it filled in a gap from 6/10. Below is that chart of the ten-year yield and as we can see it has produced some bearish candlesticks as of late, but a bull market tends to ignore them somewhat (I find over the years the bullish candlesticks work better at bottoms than bearish ones near tops). This instrument also filled in a gap but a retest of the double bottom breakout above the 3 level on 6/6 could be in play. That would also be the area of the 50-day SMA catching up in PRICE, often a good entry the initial time that occurs following a recent breakout. Put me in the camp of rates not having peaked yet.
News Reactions:
- Market participants should always pay attention to how individual stocks react to good and bad news. Obviously a positive is when a stock shrugs off perceived bad news with a nice reaction and vice versa. Earnings are often a good indication and this week was soft on reports but ORCL reacted well on Tuesday CLOSING higher by 10%. It was its third consecutive positive reaction but the present looks similar to the 12/10/21 reaction that rose 15.6% but very quickly closed in the gap just 7 sessions later. FDX actually held its announcement of a nice dividend hike. It recorded a WEEKLY bullish engulfing candle after the very round 200 number held up well since March. On its daily chart, it is currently doing battle with its 200-day SMA. On the chart below of BABA however an initial pop higher premarket turned sour by the CLOSE, registering a familiar bearish candlestick. One confident conclusion is that each of the three successive drawdowns has been smaller than the last and it did hold the very round par number. My guess is a move back toward 95 and then see how the name reacts.
Nuclear Gaining Traction:
- As the price of crude keeps escalating many are searching for viable alternatives. The world is embracing nuclear as South Korea has turned its plants back on and even the Biden administration recently announced its support for the technology. A couple of the main names in the space are CCJ and CEG. The former is now 36% off most recent 52-week highs which occurred just 2 months ago. The stock fell nearly 19% last week as it approaches the very round 20 number which held precisely last month. It is now back toward the lower end of the range that recorded a 10 of 11 week winning streak the weeks ending between 2/4-4/15. Below is the chart in CEG which is acting better, now off just 15% from its annual peak made on 4/20 which recorded a bearish dark cloud cover candle. Last week it fell 2.8%, but CLOSED well into the upper half of the WEEKLY range. I think both of these stocks will be higher 12 months out, although I prefer CEG a bit more.
Banking On Gains?
- The banks seem to always be under a microscope. They are always thought of having to be active participants in a healthy overall market rally. Of course, we are not in one, but perhaps there are some glimmers of hope of a possible bounce. The MONTHLY chart below of the XLF indicates we may be in for some support, although that is not for sure, and if it does occur will it be meaningful? We will only know after the fact, but the chart is coming into a former area of resistance at the round 30 number, which was the scene of a cup-base breakout, and that would also be the first time touching the rising 50-day SMA since the move. The fund is showing some nascent relative "strength" (this is no absolute strength presently) as it is the second-best major S&P sector of 11 down 9.4%, trailing just healthcare. Over the last 3 months, it was just the 10th best of 11. On its daily chart Friday it recorded a doji, which was also a bullish harmai cross, which is adept at spotting possible trend changes from the prevailing direction.
Notable Ideas:
Coal In The Stocking?
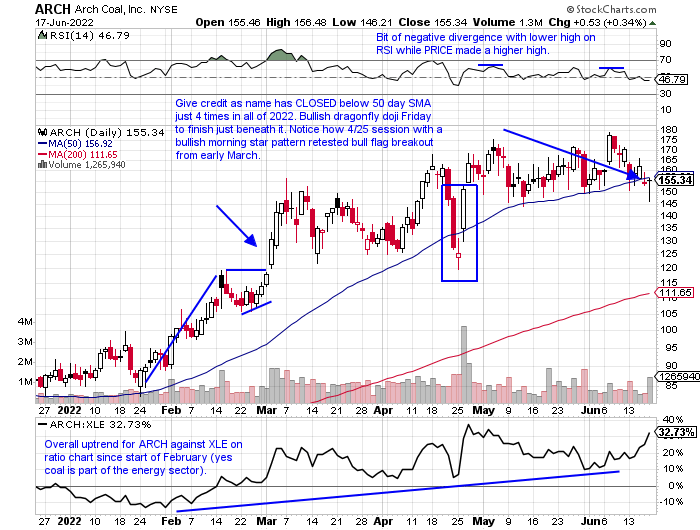
- The energy sector was pounded this past week with the XLE slumping 17.2%, its worst WEEKLY decline since March 2020 after the prior week recorded a bearish shooting star candle. It was long overdue and it has not lost ground in 3 consecutive weeks in almost 11 months. The XOP fell by more than 20%. Perhaps now that the last group standing has been taken out can the market begin the long healing process. Within the diverse energy space is the long forgotten coal group. These names held up relatively well this past week considering. HCC after not able to CLOSE above a 41.34 double bottom pivot on 6/7 folded a bit. CEIX broke its 50 day SMA Friday losing 6%, and AMR CLOSED everyday last week under the line. But other names like BTU which recorded a bullish hammer off the very round 20 number and the chart below of ARCH looks constructive. A move back above 158 should be purchased.
Biotech Opportunity:
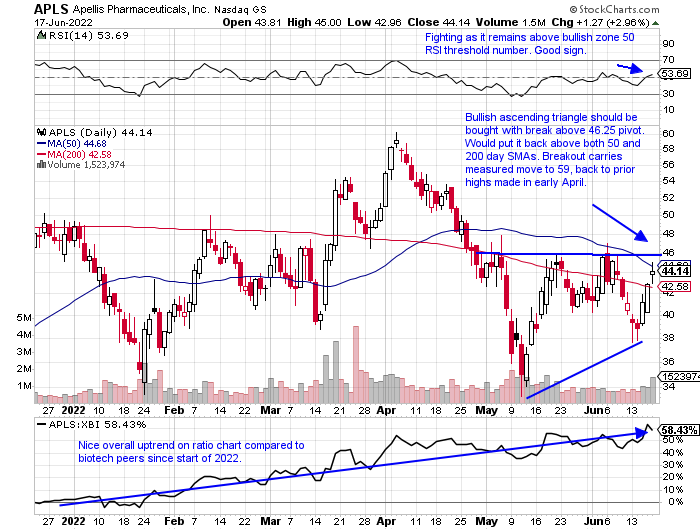
- The biotech sector was somewhat of a bright spot this week with the XBI gaining 1% on the week. That came via a big move Friday of nearly 6% in very active volume. It was most likely spurred by more M&A talk regarding SGEN and opex. The ETF is now higher 4 of the last 5 weeks and give it credit for CLOSING at or near highs for the daily range the last 4 days of this past week. Gains continue to be made in the CRISPR names like TWST, CRSP and BEAM with those names advancing 16, 9.8 and 8% respectively last week. A speculative play I identified charting last night that includes round number theory is ALLO now on a 5 week winning streak, up by a combined 45%. A second strong move above the 10 figure, after being resistance there between March-May, adds to the bullish case. Below is the chart of APLS which has the look of breaking above a bearish head and shoulders formation that aligned with the 40 number (with exception of move in second week of May). A move above 46 would put the stock back above both its 50 and 200 day SMAs, when just 10% off the S&P 500 is above its 50 day SMA and 13% above their 200 day SMAs.
Good luck.
This article requires a Chartsmarter membership. Please click here to join.
Complacency:
- Are we tired of hearing that word yet? It is the new "transitory", and that word in itself is an oxymoron as we have heard that word daily for it feels like a couple of years. Well, complacency is what could describe the WEEKLY chart below of the VIX. The instrument, believe it or not, is in your technical definition of a bear market, 20% off the high made in January near 39. It has produced back-to-back double-digit gains, but each time pressing the 35 area on a WEEKLY CLOSING basis it is repelled. To me, this has the feeling of a potential beach ball held underwater breakout. Meaning when we climb above 40 that is when we may begin to see the "white in their eyes" panic feeling and this could burst upward in a violent fashion. Throughout 2022 the VIX has found a floor at the very round 20 number and support at its rising 50 and 200-day SMAs, recording a bullish golden cross in the process. The right side of a cup-base could be forming and I am not sure it will reach the peak of 85 in March 2020 but higher PRICES feel necessary.
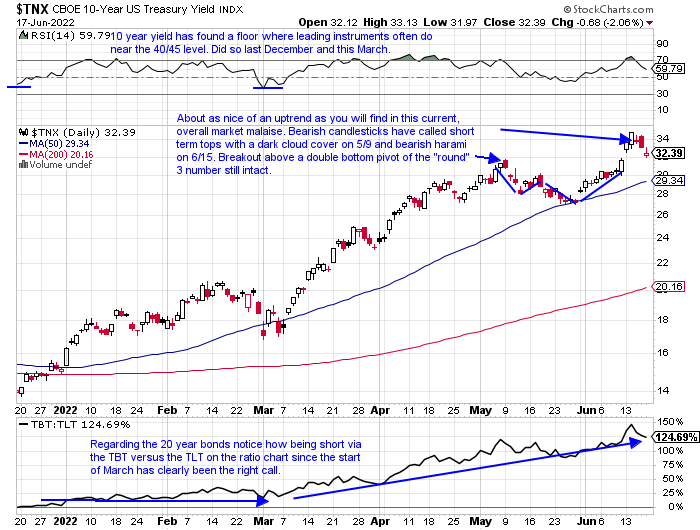
Rates Topping?
- This seems to be the consensus, and as much as I like being somewhat of a "contrarian" I have been taught that consensus is usually correct. Some bearish candlesticks were recorded with a big reversal Thursday on the TBT (20-year note) as that session engulfed the first 3 days of this week. The resolution downward Friday was somewhat muted as it filled in a gap from 6/10. Below is that chart of the ten-year yield and as we can see it has produced some bearish candlesticks as of late, but a bull market tends to ignore them somewhat (I find over the years the bullish candlesticks work better at bottoms than bearish ones near tops). This instrument also filled in a gap but a retest of the double bottom breakout above the 3 level on 6/6 could be in play. That would also be the area of the 50-day SMA catching up in PRICE, often a good entry the initial time that occurs following a recent breakout. Put me in the camp of rates not having peaked yet.
News Reactions:
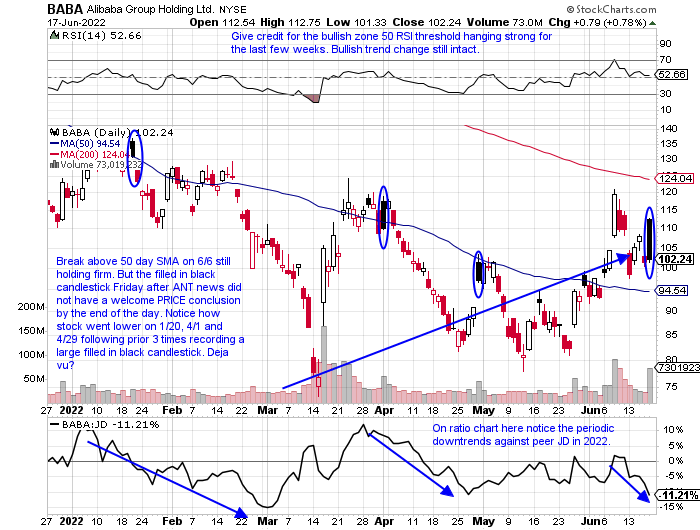
- Market participants should always pay attention to how individual stocks react to good and bad news. Obviously a positive is when a stock shrugs off perceived bad news with a nice reaction and vice versa. Earnings are often a good indication and this week was soft on reports but ORCL reacted well on Tuesday CLOSING higher by 10%. It was its third consecutive positive reaction but the present looks similar to the 12/10/21 reaction that rose 15.6% but very quickly closed in the gap just 7 sessions later. FDX actually held its announcement of a nice dividend hike. It recorded a WEEKLY bullish engulfing candle after the very round 200 number held up well since March. On its daily chart, it is currently doing battle with its 200-day SMA. On the chart below of BABA however an initial pop higher premarket turned sour by the CLOSE, registering a familiar bearish candlestick. One confident conclusion is that each of the three successive drawdowns has been smaller than the last and it did hold the very round par number. My guess is a move back toward 95 and then see how the name reacts.
Nuclear Gaining Traction:
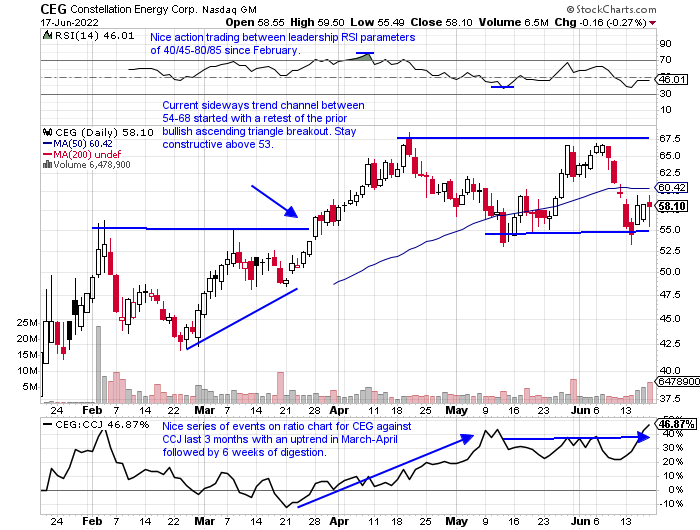
- As the price of crude keeps escalating many are searching for viable alternatives. The world is embracing nuclear as South Korea has turned its plants back on and even the Biden administration recently announced its support for the technology. A couple of the main names in the space are CCJ and CEG. The former is now 36% off most recent 52-week highs which occurred just 2 months ago. The stock fell nearly 19% last week as it approaches the very round 20 number which held precisely last month. It is now back toward the lower end of the range that recorded a 10 of 11 week winning streak the weeks ending between 2/4-4/15. Below is the chart in CEG which is acting better, now off just 15% from its annual peak made on 4/20 which recorded a bearish dark cloud cover candle. Last week it fell 2.8%, but CLOSED well into the upper half of the WEEKLY range. I think both of these stocks will be higher 12 months out, although I prefer CEG a bit more.
Banking On Gains?
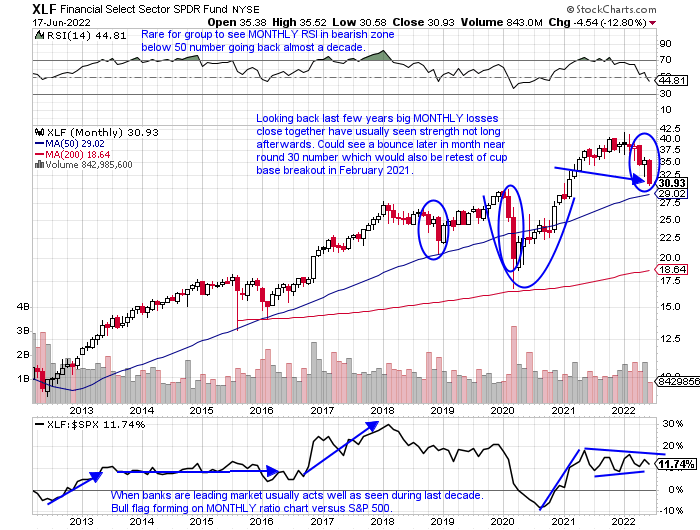
- The banks seem to always be under a microscope. They are always thought of having to be active participants in a healthy overall market rally. Of course, we are not in one, but perhaps there are some glimmers of hope of a possible bounce. The MONTHLY chart below of the XLF indicates we may be in for some support, although that is not for sure, and if it does occur will it be meaningful? We will only know after the fact, but the chart is coming into a former area of resistance at the round 30 number, which was the scene of a cup-base breakout, and that would also be the first time touching the rising 50-day SMA since the move. The fund is showing some nascent relative "strength" (this is no absolute strength presently) as it is the second-best major S&P sector of 11 down 9.4%, trailing just healthcare. Over the last 3 months, it was just the 10th best of 11. On its daily chart Friday it recorded a doji, which was also a bullish harmai cross, which is adept at spotting possible trend changes from the prevailing direction.
Notable Ideas:
Coal In The Stocking?
- The energy sector was pounded this past week with the XLE slumping 17.2%, its worst WEEKLY decline since March 2020 after the prior week recorded a bearish shooting star candle. It was long overdue and it has not lost ground in 3 consecutive weeks in almost 11 months. The XOP fell by more than 20%. Perhaps now that the last group standing has been taken out can the market begin the long healing process. Within the diverse energy space is the long forgotten coal group. These names held up relatively well this past week considering. HCC after not able to CLOSE above a 41.34 double bottom pivot on 6/7 folded a bit. CEIX broke its 50 day SMA Friday losing 6%, and AMR CLOSED everyday last week under the line. But other names like BTU which recorded a bullish hammer off the very round 20 number and the chart below of ARCH looks constructive. A move back above 158 should be purchased.
Biotech Opportunity:
- The biotech sector was somewhat of a bright spot this week with the XBI gaining 1% on the week. That came via a big move Friday of nearly 6% in very active volume. It was most likely spurred by more M&A talk regarding SGEN and opex. The ETF is now higher 4 of the last 5 weeks and give it credit for CLOSING at or near highs for the daily range the last 4 days of this past week. Gains continue to be made in the CRISPR names like TWST, CRSP and BEAM with those names advancing 16, 9.8 and 8% respectively last week. A speculative play I identified charting last night that includes round number theory is ALLO now on a 5 week winning streak, up by a combined 45%. A second strong move above the 10 figure, after being resistance there between March-May, adds to the bullish case. Below is the chart of APLS which has the look of breaking above a bearish head and shoulders formation that aligned with the 40 number (with exception of move in second week of May). A move above 46 would put the stock back above both its 50 and 200 day SMAs, when just 10% off the S&P 500 is above its 50 day SMA and 13% above their 200 day SMAs.
Good luck.