Inflation Pause?
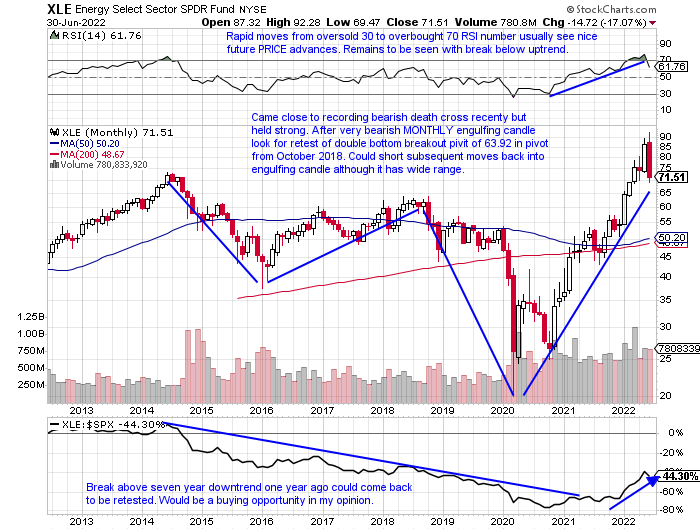
- Last Thursday we had the benefit of being able to examine some MONTHLY candlesticks. In general the longer the timeframe the more meaningful. The most powerful sector by far in the first half of 2022 was energy and that had a big impact, many felt a negative way on the consumer in a myriad of ways. Not just filling up at the pump, but the cost of the goods they purchased was also boosted as a result of the inflated PRICE. Below is the chart of the XLE and its MONTHLY bearish engulfing candle may be providing some relief. Round number theory came into play with a precise bounce off the very round 20 figure in March 2020, and the very next month recorded a bullish piercing line candle. Now the tricky part is the range between those two months was very large, like the present engulfing candle in June. The XLE doubled to a high above 40 just 4 months later until finally, a bullish morning star pattern was complete in November. The 20-point range we saw in June could see some wild swings and I would not be surprised to see it trade up to the middle of that range into the 80s, but I think June pretty much said energy inflation will be easing heading into the back half of 2022.
Housing Relief On The Way?
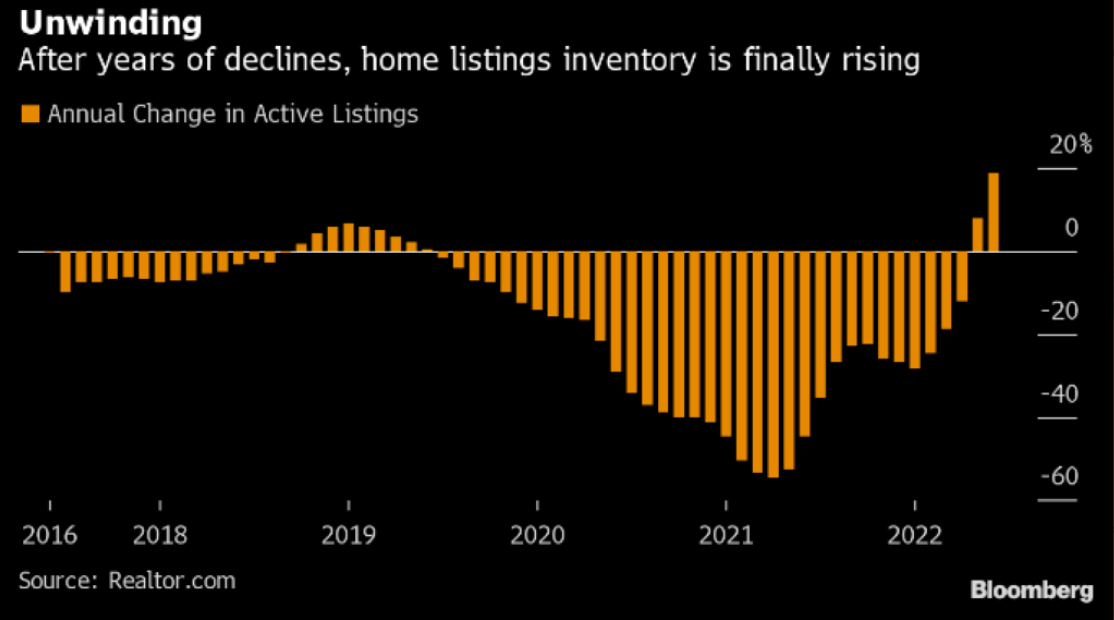
- Another source of frustration with inflation, and many thought that needed to finally be addressed, was the affordability of houses. It is a way many judge their net worth, so it has an impact on how they feel. The chart below that I saw from Petr Pinkhasov this past week was interesting as we are seeing more inventory flood the market for the first time in 3 years. Simply put more supply gives the buyer better prices. Looking at this from a chart perspective, the ITB has lost ground 5 of the first 6 months beginning with a bearish engulfing candle in January, and the fund is 34% off the peak from 12/13/21. The jump in housing names, up 4.5% on Friday alone, propelled the discretionary space to the second-best of the 11 major S&P sectors. Last week the ETF rose 2.4%, nice follow-through after the former bullish inside WEEKLY candle gained 9%. The chips are falling one by one.
If Rates Begin To Fall Who Benefits?
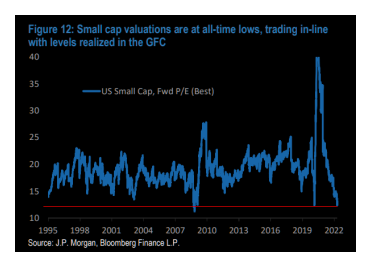
- Small businesses would get a boost from financing costs if rates were to come in in a significant way. Most of these companies are struggling with wage inflation among other issues, so relief could be on the way. The ten-year yield fell below the "round" 3 number this week and its 50-day SMA last week for the first time in 4 months, but the last time that occurred turned out to be a bear trap. But getting back to the theme of the paragraph headline I think small caps would prosper. The chart below from Will Nutting this week suggests fundamentally they may be at an inflection point. From a technical perspective looking at the group as a whole, the IWM may be attractive. The small-cap ETF last month filled in a WEEKLY gap dating back to November 2020, and that is compelling as gaps rarely occur on indexes. On a YTD basis, the Russell 2000 is trailing off 23%, compared to the Dow and S&P 500 which are off lower by 14 and 20% respectively.
Boring Can Be Beautiful:
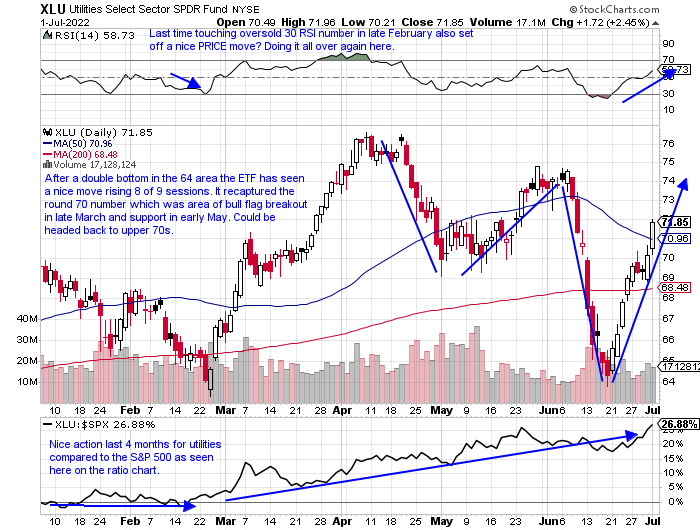
- Are the utilities sniffing out rates may be coming in as well? From their recent PRICE action, one could say yes. Investors may begin to start searching for yield, and the group would satisfy the urge. On a YTD basis, they are the second-best behaved major S&P sector of 11. Last week they were easily the strongest up more than 4%, tripling the runner-up with the XLE up 1.4%. And to demonstrate their consistency over the last one and 3 month periods they are in the top 3 as well. From a technical stance, it is currently the only major S&P sector above both its 50 and 200-day SMAs, and the XLU is higher in the last 2 weeks by more than a combined 10%. It can be bought here and add to above a double bottom pivot of 75.36. One may question the current leadership, but this group may be the spot to park capital while other growth areas attempt to catch their footing.
More Sober Leadership:
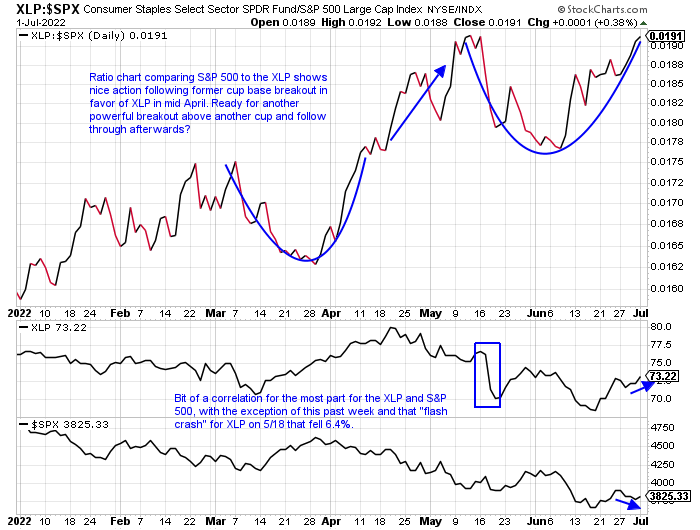
- Even with the 18% energy slump in June it still holds a commanding lead YTD against its 10 other major S&P sector peers. Making a race for second place is two stable, steady groups in the utilities and staples both hovering somewhat around the UNCH like so far in 2022. For the last 3 months, the XLP has been trading roughly between the round 70-80 figures. Last week was aided by some strong gains in the food products group with GIS hitting an all-time high while breaking above a 74.09 cup base pivot. It was accompanied by the best WEEKLY volume in the last 15 months. FDP is on a 9 session winning streak and rose by more than double digits last week. THS broke above a bullish inverse head and shoulders pattern and PPC completed a handle on its cup base with a pivot of 32.78. The largest contributor however to the XLP's gain this week came from the soft drinks. Let's take a look at a couple leaders.
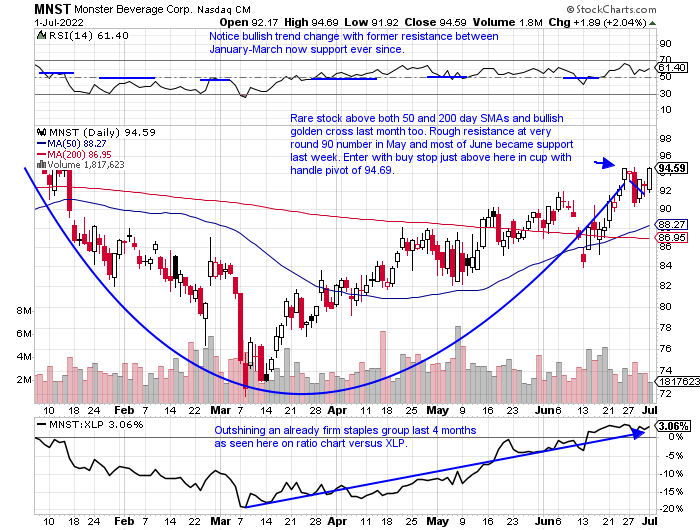
- Beverage play down 2% YTD and higher by 4% over last one year period.
- Name 5% off most recent 52 week highs and up 11 of last 16 weeks following 10% jump week ending 3/18. Very round par number WEEKLY resistance in April, August '21. WEEKLY double bottom add on pivot of 98.83 in base 11 months long.
- FOUR straight positive earnings reactions up 4.4, 5.2, 4.4, and 5.5% on 5/6, 2/25, 11/5, and 8/6/21.
- Enter with buy stop above cup with handle pivot.
- Entry MNST 94.69. Stop 88.
- Beverage play higher by 9% YTD and 19% over last one year period. Dividend yield of 2.7%.
- Name 4% off all-time highs, last week was nice follow through up 2.1% after prior week rose 6.1% recording bullish WEEKLY engulfing candle off rising 50-day SMA. Fought off distribution weeks ending 5/20, and 6/17 that fell 7.2 and 3.2%.
- FOUR straight positive earnings reactions up 1.1, .6, 1.9 and 1.3% on 4/25, 2/10, 10/27 and 7/21/21.
- Enter with buy stop above double bottom pivot.
- Entry KO 64.73. Stop 61.50.

Good luck.
This article requires a Chartsmarter membership. Please click here to join.
Inflation Pause?
- Last Thursday we had the benefit of being able to examine some MONTHLY candlesticks. In general the longer the timeframe the more meaningful. The most powerful sector by far in the first half of 2022 was energy and that had a big impact, many felt a negative way on the consumer in a myriad of ways. Not just filling up at the pump, but the cost of the goods they purchased was also boosted as a result of the inflated PRICE. Below is the chart of the XLE and its MONTHLY bearish engulfing candle may be providing some relief. Round number theory came into play with a precise bounce off the very round 20 figure in March 2020, and the very next month recorded a bullish piercing line candle. Now the tricky part is the range between those two months was very large, like the present engulfing candle in June. The XLE doubled to a high above 40 just 4 months later until finally, a bullish morning star pattern was complete in November. The 20-point range we saw in June could see some wild swings and I would not be surprised to see it trade up to the middle of that range into the 80s, but I think June pretty much said energy inflation will be easing heading into the back half of 2022.
Housing Relief On The Way?
- Another source of frustration with inflation, and many thought that needed to finally be addressed, was the affordability of houses. It is a way many judge their net worth, so it has an impact on how they feel. The chart below that I saw from Petr Pinkhasov this past week was interesting as we are seeing more inventory flood the market for the first time in 3 years. Simply put more supply gives the buyer better prices. Looking at this from a chart perspective, the ITB has lost ground 5 of the first 6 months beginning with a bearish engulfing candle in January, and the fund is 34% off the peak from 12/13/21. The jump in housing names, up 4.5% on Friday alone, propelled the discretionary space to the second-best of the 11 major S&P sectors. Last week the ETF rose 2.4%, nice follow-through after the former bullish inside WEEKLY candle gained 9%. The chips are falling one by one.
If Rates Begin To Fall Who Benefits?
- Small businesses would get a boost from financing costs if rates were to come in in a significant way. Most of these companies are struggling with wage inflation among other issues, so relief could be on the way. The ten-year yield fell below the "round" 3 number this week and its 50-day SMA last week for the first time in 4 months, but the last time that occurred turned out to be a bear trap. But getting back to the theme of the paragraph headline I think small caps would prosper. The chart below from Will Nutting this week suggests fundamentally they may be at an inflection point. From a technical perspective looking at the group as a whole, the IWM may be attractive. The small-cap ETF last month filled in a WEEKLY gap dating back to November 2020, and that is compelling as gaps rarely occur on indexes. On a YTD basis, the Russell 2000 is trailing off 23%, compared to the Dow and S&P 500 which are off lower by 14 and 20% respectively.
Boring Can Be Beautiful:
- Are the utilities sniffing out rates may be coming in as well? From their recent PRICE action, one could say yes. Investors may begin to start searching for yield, and the group would satisfy the urge. On a YTD basis, they are the second-best behaved major S&P sector of 11. Last week they were easily the strongest up more than 4%, tripling the runner-up with the XLE up 1.4%. And to demonstrate their consistency over the last one and 3 month periods they are in the top 3 as well. From a technical stance, it is currently the only major S&P sector above both its 50 and 200-day SMAs, and the XLU is higher in the last 2 weeks by more than a combined 10%. It can be bought here and add to above a double bottom pivot of 75.36. One may question the current leadership, but this group may be the spot to park capital while other growth areas attempt to catch their footing.
More Sober Leadership:
- Even with the 18% energy slump in June it still holds a commanding lead YTD against its 10 other major S&P sector peers. Making a race for second place is two stable, steady groups in the utilities and staples both hovering somewhat around the UNCH like so far in 2022. For the last 3 months, the XLP has been trading roughly between the round 70-80 figures. Last week was aided by some strong gains in the food products group with GIS hitting an all-time high while breaking above a 74.09 cup base pivot. It was accompanied by the best WEEKLY volume in the last 15 months. FDP is on a 9 session winning streak and rose by more than double digits last week. THS broke above a bullish inverse head and shoulders pattern and PPC completed a handle on its cup base with a pivot of 32.78. The largest contributor however to the XLP's gain this week came from the soft drinks. Let's take a look at a couple leaders.
- Beverage play down 2% YTD and higher by 4% over last one year period.
- Name 5% off most recent 52 week highs and up 11 of last 16 weeks following 10% jump week ending 3/18. Very round par number WEEKLY resistance in April, August '21. WEEKLY double bottom add on pivot of 98.83 in base 11 months long.
- FOUR straight positive earnings reactions up 4.4, 5.2, 4.4, and 5.5% on 5/6, 2/25, 11/5, and 8/6/21.
- Enter with buy stop above cup with handle pivot.
- Entry MNST 94.69. Stop 88.
- Beverage play higher by 9% YTD and 19% over last one year period. Dividend yield of 2.7%.
- Name 4% off all-time highs, last week was nice follow through up 2.1% after prior week rose 6.1% recording bullish WEEKLY engulfing candle off rising 50-day SMA. Fought off distribution weeks ending 5/20, and 6/17 that fell 7.2 and 3.2%.
- FOUR straight positive earnings reactions up 1.1, .6, 1.9 and 1.3% on 4/25, 2/10, 10/27 and 7/21/21.
- Enter with buy stop above double bottom pivot.
- Entry KO 64.73. Stop 61.50.
Good luck.