Energy Energized:
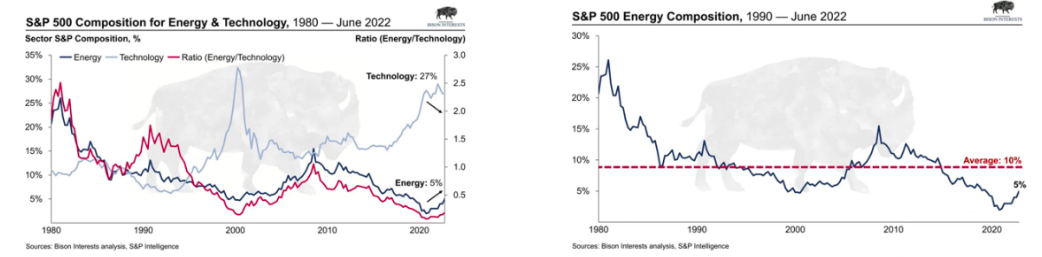
- The XLE on a YTD basis is higher by more than 40% thus far and would be shocking if it was caught by year-end. This would be a very rare example of the sector being the best of 11 in back-to-back years as the fund rose more than 50% in 2021. Remember trends once in place are more likely to remain than to reverse. Of course, this group suffered a 29.8% drawdown top to the bottom of the range between weeks ending 6/3-7/15 but the space looks to be on the mend. In a very basic sense IF we are already coming out of a recession the PRICE of crude should have tailwinds going forward. From a PRICE perspective, the XLE is now back above its 50-day SMA for the first time in 2 months as it looks to build the right side of a cup base that found comfort at its rising 200-day SMA. On the charts below one can see how historically the sector comprises an average of 10% of the S&P 500 and still remains half of that presently. On the ratio chart, it looks like some mean reversion is already underway.
"Drilling" Down:
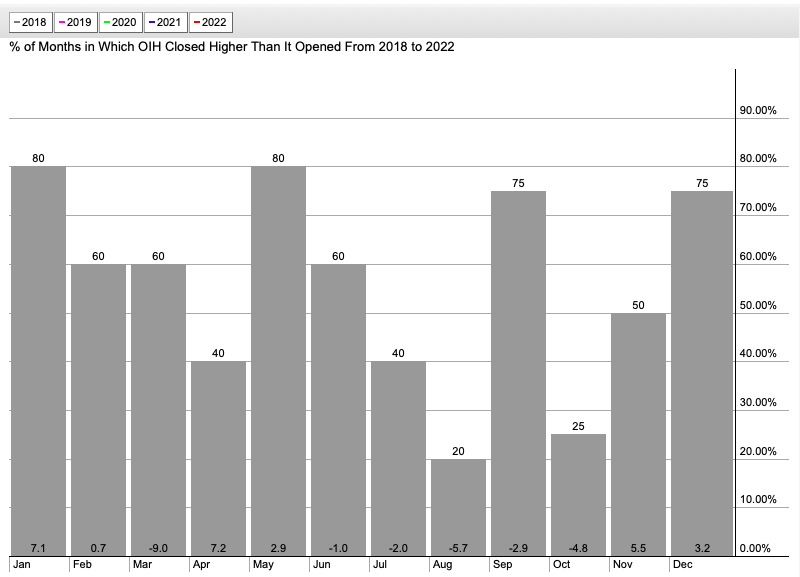
- Digging deeper into the energy space we can see from a seasonality look the 5 months between June-October incredibly see an average MONTHLY loss with August and October easily the worst of the bunch off 5.7 and 4.8% the last 5 years (outside of that the 9% average loss is an outlier). In our opening paragraph, we used the XLE, but if we compare the more "equal-weight" XOP to the OIH we see some sizable differences. So far in 2022, the XOP has gained 46% as the OIH rose a respectable 31%. The contrast is much different if we view the 3-month look-back period with the XOP higher by 5% as the OIH fell 7%. This does not mean you should avoid drillers altogether, in fact, look for names that are showing strength amid the seasonality headwinds and displaying relative strength overall. VAL is a good example if it can keep its head above the very round 50 number. Use a stop of 47.
Energy Lookers:
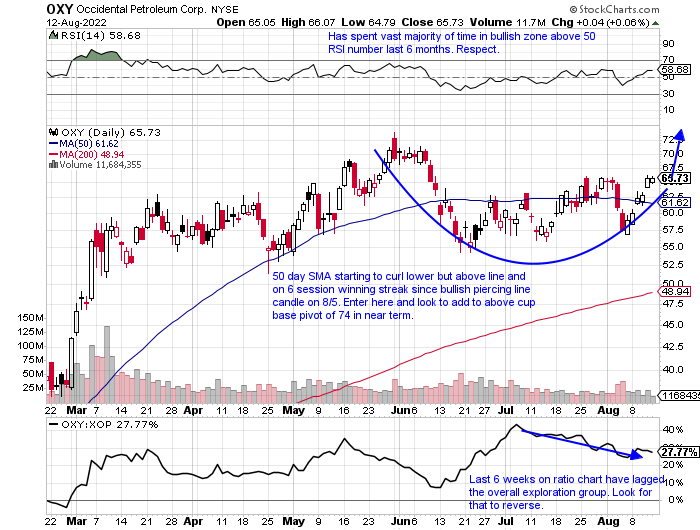
- Energy play up 127% YTD and 145% over last one-year period. Dividend yield of .8%.
- Name 11% off most recent 52-week highs and still almost 20% above the huge week ending 3/4 that screamed higher by 44% in enormous WEEKLY volume. Good relative strength this week up 11.4% as XLE advanced 7.4%.
- Earnings mostly lower down 6.5, .5, and 1% on 8/3, 2/25, and 11/5/21 and rose 1.2% on 5/11.
- Enter as right side of cup base takes shape.
- Entry OXY here. Stop 59.
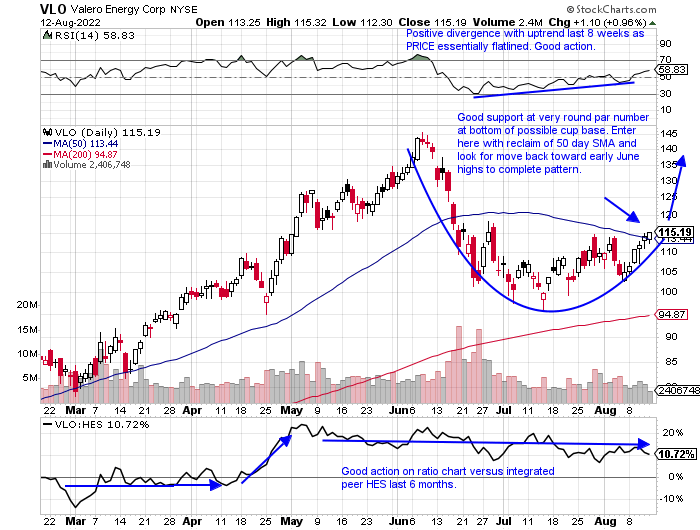
- Integrated energy play higher by 53% YTD and 71% over last one-year period. Dividend yield of 3.4%.
- Name 22% off most recent 52-week highs and nice WEEKLY gain of 9.7% was the first advancer to CLOSE at highs for the range since the week ending 6/3. Up just 3 of last 9 weeks. Time in penalty box complete.
- Earnings mostly higher up 4.2, .8, and 1.2% on 4/26, 1/27, and 10/21/21, and fell 1.8% on 7/28.
- Enter with reclaim of 50-day SMA.
- Entry VLO here. Stop 107.
Psychological Factor:
- Below is a chart from GasBuddy that tracks the price of gas in real-time not only in the United States but in Canada and Australia too. Indeed it shows a nice decline every day during the last 2 months, from a peak at the "round" 5 number in mid-June. This also happened to be the low of the major benchmarks. Is it a coincidence or not? To me, it was always amusing because the money one saves from an arbitrary 25 cents on a gallon when filling up the tank is nominal. For conversational sake, let us say one puts 12 gallons into their tank from the high of $5 to the rough $4 area here. They are saving $12. If this inflation era that will barely get you a Big Mac combo. But it is the "psychological effect" that makes one feel better. It affects consumer confidence and perhaps spills over into heightened spending habits which have been confirmed with recent credit card data. I just thought it was interesting that markets bottomed just as gasoline peaked.
Excesses "Wrung Out"?:
- Margin debt is a double-edged sword. On the way up it can provide fuel to the fire and of course, you can get burnt on the way down when the market softens. This chart by Yardeni below shows the yearly change in margin debt and the latest figure is from June when the indexes caught their breath and reversed. Notice prior bear markets shaded on the chart seemed to coincide roughly with bottoms from the 2000-02 after the collapse of tech stocks at the turn of the century and the 9/11 attacks and again with the financial crisis in 2007-08. Could that be happening again here? We will not know of course until hindsight, but at the very least this seems like a positive flush of any prior speculative excess.

Broad-Based Gains:
- Since the move off the lows in mid-June participation has been broad. This is obviously a good sign. Below is a look at all eleven of the major S&P sectors and we can each of them advanced. The "worst" actor was healthcare still up almost an impressive 4%. Notice rounding out 4 of the 5 at the bottom (staples, utilities, and real estate) were mostly defensive as growth has come back into vogue. Last week growth took a "pause", as again every major sector rose but it was energy, financials, and materials that were the 3 best giving "value" the nod. Utilities shined last week and easily look the best of the "defensives" as they trade just 1% off most recent 52-week highs as the XLU and broke above a 75.30 double bottom pivot. Even on a 3-month look-back period, every sector has gained ground. Peering one more time below at the one-month gains, with 7 of the 11 advancing by at least double digits some healthy consolidation is in order.
Good luck.
This article requires a Chartsmarter membership. Please click here to join.
Energy Energized:
- The XLE on a YTD basis is higher by more than 40% thus far and would be shocking if it was caught by year-end. This would be a very rare example of the sector being the best of 11 in back-to-back years as the fund rose more than 50% in 2021. Remember trends once in place are more likely to remain than to reverse. Of course, this group suffered a 29.8% drawdown top to the bottom of the range between weeks ending 6/3-7/15 but the space looks to be on the mend. In a very basic sense IF we are already coming out of a recession the PRICE of crude should have tailwinds going forward. From a PRICE perspective, the XLE is now back above its 50-day SMA for the first time in 2 months as it looks to build the right side of a cup base that found comfort at its rising 200-day SMA. On the charts below one can see how historically the sector comprises an average of 10% of the S&P 500 and still remains half of that presently. On the ratio chart, it looks like some mean reversion is already underway.
"Drilling" Down:
- Digging deeper into the energy space we can see from a seasonality look the 5 months between June-October incredibly see an average MONTHLY loss with August and October easily the worst of the bunch off 5.7 and 4.8% the last 5 years (outside of that the 9% average loss is an outlier). In our opening paragraph, we used the XLE, but if we compare the more "equal-weight" XOP to the OIH we see some sizable differences. So far in 2022, the XOP has gained 46% as the OIH rose a respectable 31%. The contrast is much different if we view the 3-month look-back period with the XOP higher by 5% as the OIH fell 7%. This does not mean you should avoid drillers altogether, in fact, look for names that are showing strength amid the seasonality headwinds and displaying relative strength overall. VAL is a good example if it can keep its head above the very round 50 number. Use a stop of 47.
Energy Lookers:
- Energy play up 127% YTD and 145% over last one-year period. Dividend yield of .8%.
- Name 11% off most recent 52-week highs and still almost 20% above the huge week ending 3/4 that screamed higher by 44% in enormous WEEKLY volume. Good relative strength this week up 11.4% as XLE advanced 7.4%.
- Earnings mostly lower down 6.5, .5, and 1% on 8/3, 2/25, and 11/5/21 and rose 1.2% on 5/11.
- Enter as right side of cup base takes shape.
- Entry OXY here. Stop 59.
- Integrated energy play higher by 53% YTD and 71% over last one-year period. Dividend yield of 3.4%.
- Name 22% off most recent 52-week highs and nice WEEKLY gain of 9.7% was the first advancer to CLOSE at highs for the range since the week ending 6/3. Up just 3 of last 9 weeks. Time in penalty box complete.
- Earnings mostly higher up 4.2, .8, and 1.2% on 4/26, 1/27, and 10/21/21, and fell 1.8% on 7/28.
- Enter with reclaim of 50-day SMA.
- Entry VLO here. Stop 107.
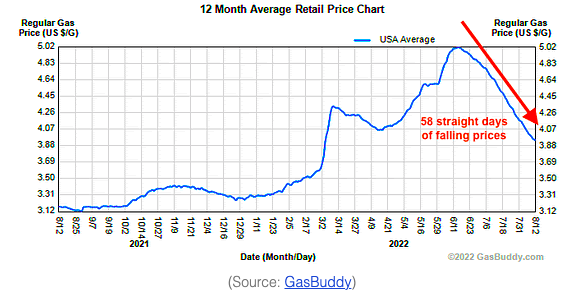
Psychological Factor:
- Below is a chart from GasBuddy that tracks the price of gas in real-time not only in the United States but in Canada and Australia too. Indeed it shows a nice decline every day during the last 2 months, from a peak at the "round" 5 number in mid-June. This also happened to be the low of the major benchmarks. Is it a coincidence or not? To me, it was always amusing because the money one saves from an arbitrary 25 cents on a gallon when filling up the tank is nominal. For conversational sake, let us say one puts 12 gallons into their tank from the high of $5 to the rough $4 area here. They are saving $12. If this inflation era that will barely get you a Big Mac combo. But it is the "psychological effect" that makes one feel better. It affects consumer confidence and perhaps spills over into heightened spending habits which have been confirmed with recent credit card data. I just thought it was interesting that markets bottomed just as gasoline peaked.
Excesses "Wrung Out"?:
- Margin debt is a double-edged sword. On the way up it can provide fuel to the fire and of course, you can get burnt on the way down when the market softens. This chart by Yardeni below shows the yearly change in margin debt and the latest figure is from June when the indexes caught their breath and reversed. Notice prior bear markets shaded on the chart seemed to coincide roughly with bottoms from the 2000-02 after the collapse of tech stocks at the turn of the century and the 9/11 attacks and again with the financial crisis in 2007-08. Could that be happening again here? We will not know of course until hindsight, but at the very least this seems like a positive flush of any prior speculative excess.
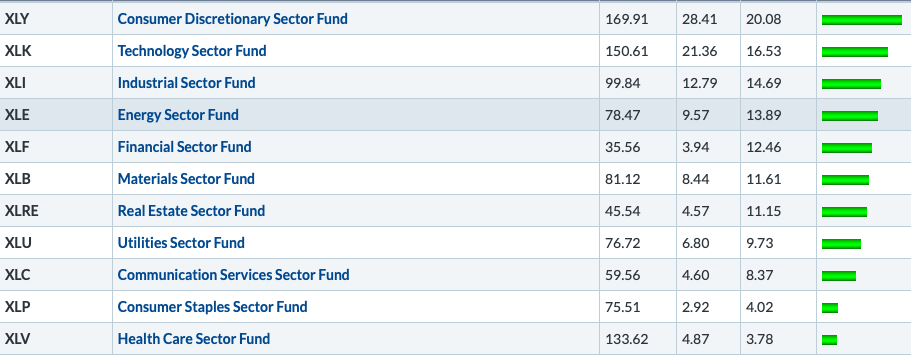
Broad-Based Gains:
- Since the move off the lows in mid-June participation has been broad. This is obviously a good sign. Below is a look at all eleven of the major S&P sectors and we can each of them advanced. The "worst" actor was healthcare still up almost an impressive 4%. Notice rounding out 4 of the 5 at the bottom (staples, utilities, and real estate) were mostly defensive as growth has come back into vogue. Last week growth took a "pause", as again every major sector rose but it was energy, financials, and materials that were the 3 best giving "value" the nod. Utilities shined last week and easily look the best of the "defensives" as they trade just 1% off most recent 52-week highs as the XLU and broke above a 75.30 double bottom pivot. Even on a 3-month look-back period, every sector has gained ground. Peering one more time below at the one-month gains, with 7 of the 11 advancing by at least double digits some healthy consolidation is in order.
Good luck.