Tech Must Participate:
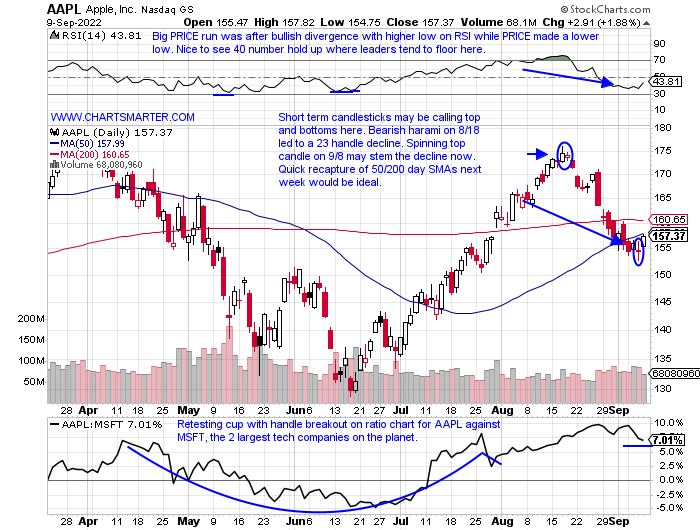
- This past week was a well-received one with all 11 major S&P sectors gaining ground. The consumer discretionary space was the best actor with the XLY higher by more than 5%, and energy was in the cellar up .8%. Bulls want to see that type of "breadth" if this move off the June lows will continue to go anywhere. Over the last one-month period technology via the XLK is dead last of the 11 groups with the XLK off nearly 5% (on a YTD basis it is lower by more than 20% and 10th best of 11). Pick your bias. If you are bearish the obvious weakness is your narrative, if you are a bull you feel there is plenty of runway to go into year-end if the space can catch some love. The nascent financial strength is to be admired, but if this market move off 11500 for the Nasdaq and 3900 for the S&P 500 is too have legs technology must participate. The chart below of AAPL will have a major influence on that premise. On a WEEKLY basis, the round 180 number has been a roadblock since last December with no CLOSES above the figure. This past week recorded a bullish WEEKLY hammer candle and the intraweek low of 152.68 should be considered a clear line in the sand for the bullish thesis.
Exposure Revealed:
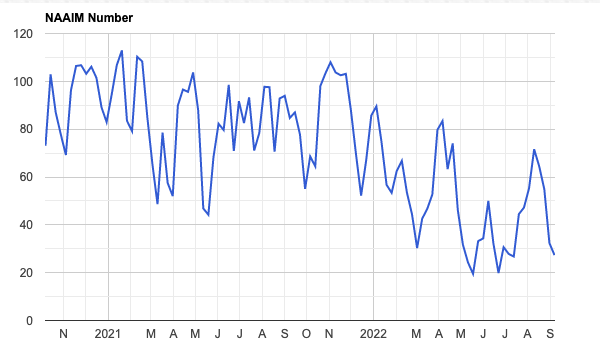
- Investment managers often like to talk about their books, but we know talk is cheap. Below is the chart of the NAAIM Exposure Index and it indicates the actual positioning of what the members are doing with client money. It is not perceived to be a tool to predict markets, and indeed one can see the overall downtrend with lower highs throughout 2021, with the exception of that powerful bull trap move in November, as markets that year trended higher in basically a straight smooth line. In 2022 we can see the downtrend continuing and could we be setting up for a triple bottom near the very round 20 number? No one knows but this chart does argue that many money managers are not situated for a potential year-end run higher, and this could add fuel to the fire for this nascent rally we witnessed in the latter half of last week. This theme echoes a tweet by Sentiment Trader this week that mentioned institutions "panic hedged" purchasing more than $8B worth of put options versus a mere $1B of calls.
Twenty For Twenty:
- With the midterm elections coming up in 2 months the chart below by Ryan Detrick shows pretty good odds of having a positive gain from this November to November 2023. One can make up whatever reason they would like but remember PRICE does not lie, people do. Often you will hear it is gridlock within Congress but the average gain the year following the midterm elections is better than 14%. Now there will be some outlier years like 1954, or the 1990s which all 3 rose more than 22%. As strategies like the Santa Claus rally become well known they lose their relevance (markets in recent years have done very well in November and not so much in December). Perhaps this is what is occurring with 3 of the last 4 examples between 2006-2014 seeing "mild" single digit returns, at least compared to the years looking left on the chart between 1950-2002. As always look for this to be a stock pickers market going forward favoring active management for those seeking alpha.

Truss Pivots:
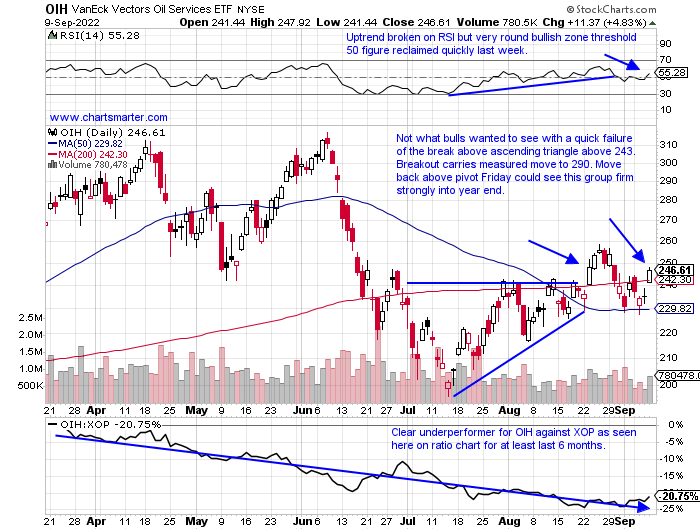
- And do not get me wrong I think it is the correct measure considering the dire energy circumstances at the moment. Of course, I am not naive enough to believe the spigots will be turned right back on but this is a move in the right direction. And PRICE is the motivating factor is my decision process and the chart below of the OIH shows a break back above a bullish ascending triangle and its 200 day SMA last Friday. The original break came on 8/23 and the fact that it failed so rapidly was a red flag and a bull trap. But to see if recapture the 243 in quick fashion shows the bears have little control here in my opinion. On the ratio chart below comparing the OIH to the XOP it is easy to see the weakness for the former and perhaps it is ready to play catch up going forward. SLB and HAL dominate the fund making up more than one third of it, but SLB looks much better to me as it carves out a cup with handle pivot of 41. Last week it rose 4.2% as HAL fell 1.1%. Others that look more attractive include VAL FTI and TDW.
Supportive Seasonality:
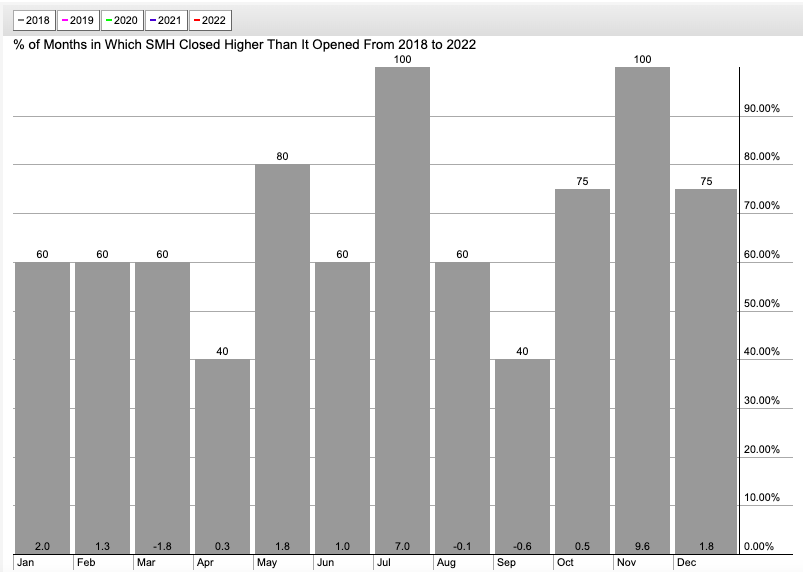
- Technology has obviously been out of favor for some time now, and semiconductors have been unable to buck that trend. Recently we have seen software start to show some nascent strength with nice earnings reaction from the likes of PANW TTD QLYS ZS and NTNX to name a few. Semiconductors have been overlooked over the last 3 months, which seems justified compared to software as the IGV has gained 5% while the SMH has declined 3%. Looking at the seasonality chart below however one should pay close attention as the SMH is coming into its best 3-month period over the last few years which is Q4. Notice the average gain in November for the last 4 years alone is nearly 10%, not a typo. Last November saw the SMH record a 3-week winning streak between weeks ending 11/5/19 that jumped 14%. In 2020 there was an outlier week ending 11/6 that rose 12.6% to boost the average. We normally like to buy strength but there are a couple of names below in NVDA and QCOM that offer good risk/reward here and are ripe for strong year-end gains in our opinion.
Semiconductor Opportunities:
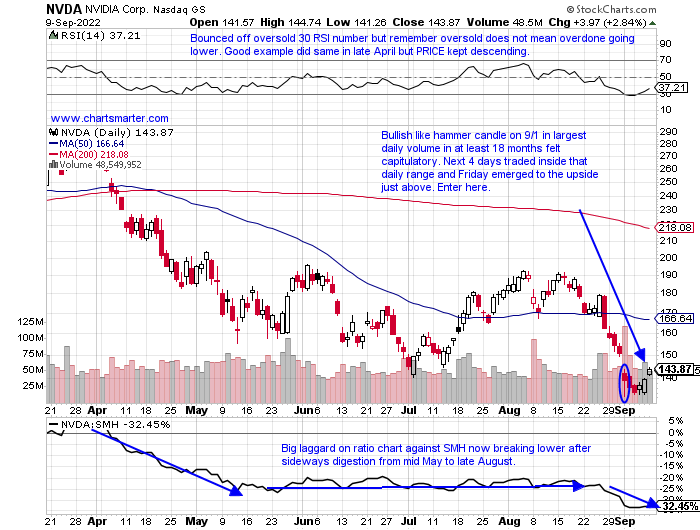
- Chip play down 51% YTD and 35% over last one year period. Dividend yield of .1%.
- Name 58% off most recent 52-week highs and now into the 140 area a rough area of support dating back from September 20-May '21. Slight relative strength this week up 5.4% last week with SMH gaining 4.3%.
- Earnings mostly higher up 4, 5.2, and 8.2% on 8/25, 5/26, and 11/18/21, and fell 7.6% on 2/17.
- Enter after bullish hammer candle/capitulation.
- Entry NVDA here. Stop 133.
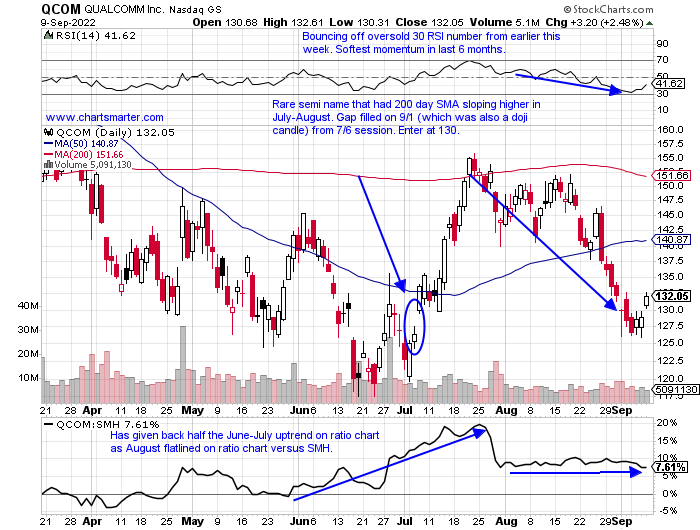
- Chip play down 28% YTD and 7% over last one year period. Dividend yield of 2.3%.
- Name 32% off most recent 52-week highs and in June-July the round 120 number on WEEKLY chart held up once again (support March, May, and October 2021 too) with bullish engulfing candle week ending 7/8 that rose 10%. Currently trading back into bullish three white soldiers WEEKLY pattern from weeks ending between 7/8-22
- Earnings mixed with larger gains of 9.7 and 12.7% on 4/28 and 11/4/21 and losses of 4.5 and 4.8% on 7/28 and 2/3.
- Enter after recent gap fill/doji candle.
- Entry QCOM 130. Stop 124.
Good luck.
This article requires a Chartsmarter membership. Please click here to join.
Tech Must Participate:
- This past week was a well-received one with all 11 major S&P sectors gaining ground. The consumer discretionary space was the best actor with the XLY higher by more than 5%, and energy was in the cellar up .8%. Bulls want to see that type of "breadth" if this move off the June lows will continue to go anywhere. Over the last one-month period technology via the XLK is dead last of the 11 groups with the XLK off nearly 5% (on a YTD basis it is lower by more than 20% and 10th best of 11). Pick your bias. If you are bearish the obvious weakness is your narrative, if you are a bull you feel there is plenty of runway to go into year-end if the space can catch some love. The nascent financial strength is to be admired, but if this market move off 11500 for the Nasdaq and 3900 for the S&P 500 is too have legs technology must participate. The chart below of AAPL will have a major influence on that premise. On a WEEKLY basis, the round 180 number has been a roadblock since last December with no CLOSES above the figure. This past week recorded a bullish WEEKLY hammer candle and the intraweek low of 152.68 should be considered a clear line in the sand for the bullish thesis.
Exposure Revealed:
- Investment managers often like to talk about their books, but we know talk is cheap. Below is the chart of the NAAIM Exposure Index and it indicates the actual positioning of what the members are doing with client money. It is not perceived to be a tool to predict markets, and indeed one can see the overall downtrend with lower highs throughout 2021, with the exception of that powerful bull trap move in November, as markets that year trended higher in basically a straight smooth line. In 2022 we can see the downtrend continuing and could we be setting up for a triple bottom near the very round 20 number? No one knows but this chart does argue that many money managers are not situated for a potential year-end run higher, and this could add fuel to the fire for this nascent rally we witnessed in the latter half of last week. This theme echoes a tweet by Sentiment Trader this week that mentioned institutions "panic hedged" purchasing more than $8B worth of put options versus a mere $1B of calls.
Twenty For Twenty:
- With the midterm elections coming up in 2 months the chart below by Ryan Detrick shows pretty good odds of having a positive gain from this November to November 2023. One can make up whatever reason they would like but remember PRICE does not lie, people do. Often you will hear it is gridlock within Congress but the average gain the year following the midterm elections is better than 14%. Now there will be some outlier years like 1954, or the 1990s which all 3 rose more than 22%. As strategies like the Santa Claus rally become well known they lose their relevance (markets in recent years have done very well in November and not so much in December). Perhaps this is what is occurring with 3 of the last 4 examples between 2006-2014 seeing "mild" single digit returns, at least compared to the years looking left on the chart between 1950-2002. As always look for this to be a stock pickers market going forward favoring active management for those seeking alpha.
Truss Pivots:
- And do not get me wrong I think it is the correct measure considering the dire energy circumstances at the moment. Of course, I am not naive enough to believe the spigots will be turned right back on but this is a move in the right direction. And PRICE is the motivating factor is my decision process and the chart below of the OIH shows a break back above a bullish ascending triangle and its 200 day SMA last Friday. The original break came on 8/23 and the fact that it failed so rapidly was a red flag and a bull trap. But to see if recapture the 243 in quick fashion shows the bears have little control here in my opinion. On the ratio chart below comparing the OIH to the XOP it is easy to see the weakness for the former and perhaps it is ready to play catch up going forward. SLB and HAL dominate the fund making up more than one third of it, but SLB looks much better to me as it carves out a cup with handle pivot of 41. Last week it rose 4.2% as HAL fell 1.1%. Others that look more attractive include VAL FTI and TDW.
Supportive Seasonality:
- Technology has obviously been out of favor for some time now, and semiconductors have been unable to buck that trend. Recently we have seen software start to show some nascent strength with nice earnings reaction from the likes of PANW TTD QLYS ZS and NTNX to name a few. Semiconductors have been overlooked over the last 3 months, which seems justified compared to software as the IGV has gained 5% while the SMH has declined 3%. Looking at the seasonality chart below however one should pay close attention as the SMH is coming into its best 3-month period over the last few years which is Q4. Notice the average gain in November for the last 4 years alone is nearly 10%, not a typo. Last November saw the SMH record a 3-week winning streak between weeks ending 11/5/19 that jumped 14%. In 2020 there was an outlier week ending 11/6 that rose 12.6% to boost the average. We normally like to buy strength but there are a couple of names below in NVDA and QCOM that offer good risk/reward here and are ripe for strong year-end gains in our opinion.
Semiconductor Opportunities:
- Chip play down 51% YTD and 35% over last one year period. Dividend yield of .1%.
- Name 58% off most recent 52-week highs and now into the 140 area a rough area of support dating back from September 20-May '21. Slight relative strength this week up 5.4% last week with SMH gaining 4.3%.
- Earnings mostly higher up 4, 5.2, and 8.2% on 8/25, 5/26, and 11/18/21, and fell 7.6% on 2/17.
- Enter after bullish hammer candle/capitulation.
- Entry NVDA here. Stop 133.
- Chip play down 28% YTD and 7% over last one year period. Dividend yield of 2.3%.
- Name 32% off most recent 52-week highs and in June-July the round 120 number on WEEKLY chart held up once again (support March, May, and October 2021 too) with bullish engulfing candle week ending 7/8 that rose 10%. Currently trading back into bullish three white soldiers WEEKLY pattern from weeks ending between 7/8-22
- Earnings mixed with larger gains of 9.7 and 12.7% on 4/28 and 11/4/21 and losses of 4.5 and 4.8% on 7/28 and 2/3.
- Enter after recent gap fill/doji candle.
- Entry QCOM 130. Stop 124.
Good luck.