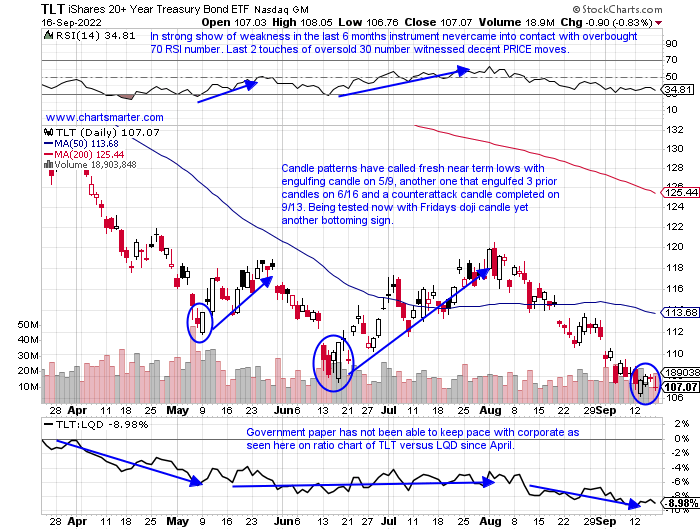
All Eyes On Yields:
- The Treasury market continues to be under hyper-focus as many take their cues from the "smarter" market. As many take their clues from the 10-year, which is extended from its rising 50-day SMA as it has been all year and on a current 7-week winning streak, below I take a look at the 20-year via the TLT. The vehicle is at an inflection point here which must hold this area or a likely magnetic push toward the very round par number, most likely resulting in further equity weakness. PRICE is omnipotent but candles can help guide and a bullish counterattack candle from 9/13 in strong volume. Friday recorded a doji which further strengthens the potential "bottoming" case as they are adept at sniffing out possible trend changes from the prevailing direction. Of course, they are not foolproof as for the second consecutive Friday a doji candle was recorded with the 9/9 session one too (bullish harami cross as well). Next week feels very important for the markets and the S&P 500 must quickly reclaim that 3900 level or the pain can just be getting started. The theme in this note is to be patient and wait for strength to resume before investing on the long side with confidence. How long that will take no one knows.
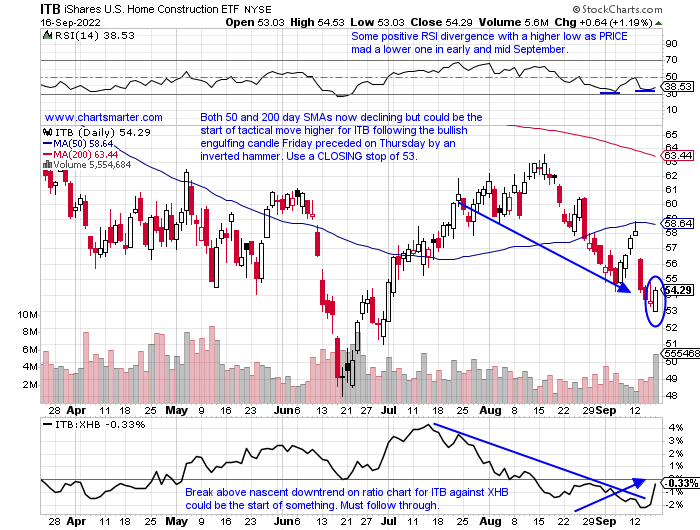
The Week That Was:
- There is no question last week was brutal and if one denies that the phrase that comes to mind is "there are none so blind as those who will not see". Every major S&P sector declined, and almost half of the 11 fell by at least 6% including tech, industrials, real estate, materials, and communication services. Not only was every sector attacked, but I could count on less than one hand the subsectors within the 11 that rose on a WEEKLY basis. They were automobiles, diversified REITs, recreational services, and gold miners. Friday may have shown some green shoots but it was mired by quadruple witching. One group that caught my attention as it went green early on in the session was the homebuilders, and more importantly, they CLOSED the day positive. No, I am not talking about the XHB which fell .5%, but the more "pure play" ITB which recorded a bullish engulfing candle. The reason this could be important as this group is interest rate sensitive.
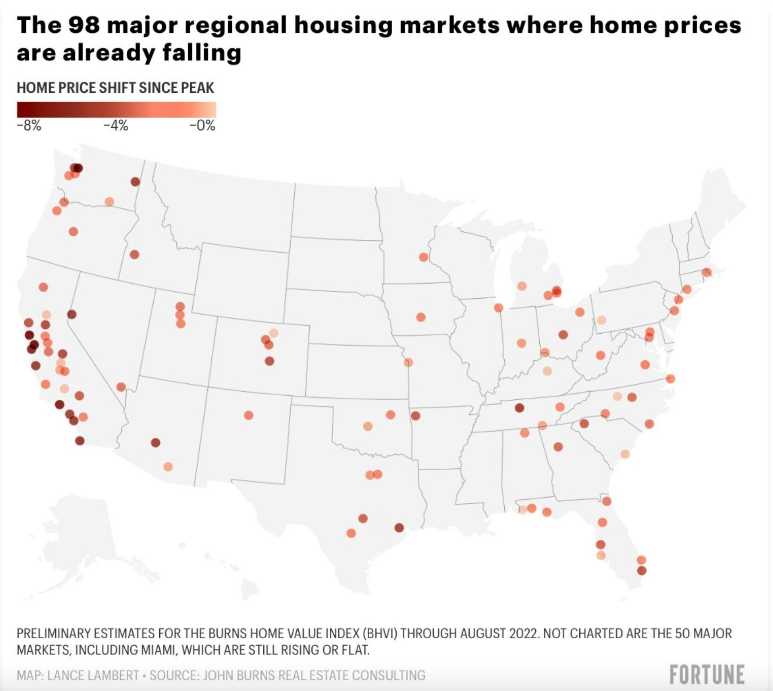
Taking On Water:
- The Fed has already declared they do not want stock market appreciation and perhaps they are thinking of home values depreciating too. The chart below from Fortune already shows that occurring. And keep in mind this is a big factor sentiment wise, as many feel their house is there proper net worth. Looking at stocks within the group, all are not created equal. TOL may be able to weather the storm best as it caters to luxury consumers and it currently trades between the round 40-50 numbers and until one of those levels is taken out to the up or downside it is probably best to be patient. Some of the periphery plays may be better a little lower from here like a WSM which feels like it wants to retest a bullish ascending triangle breakout at the 130 level (which began at the very round par figure and already achieved its measured move to 160). MHK on the other hand may find temporary respite at the 100 figure here with two consecutive doji candles last Thursday-Friday but its downtrend should resume in quick fashion.
Semi Outlier:
- Within the bifurcated semiconductor group, albeit mostly laggards, a couple of names are standing tall among the wreckage. We have spoken of ON recently which continues to trade above a double bottom pivot of 67.29 taken out on 8/3. It had witnessed strong call buying for November at the 80 strikes. Last week it fell less than 4%, a good showing as the SMH slumped by 6%. Give the ETF credit Friday for CLOSING up on a soft tech tape, reversing higher off the very round 200 number. The outlier in the arena however is in the chart below of WOLF, the former CREE. It is 1 of 3 names in the group to have been in the news this month regarding new projects thanks to the CHIPS act. MU in Idaho, INTC in Ohio, and WOLF now in North Carolina. Micron and Intel are cellar dwellers off 46 and 48% from their most recent respective 52-week highs, while WOLF is "only" 16% off its own annual peak. Incredibly it has doubled during a current 10 of 11-week winning streak and this one feels poised to make a strong year-end run.

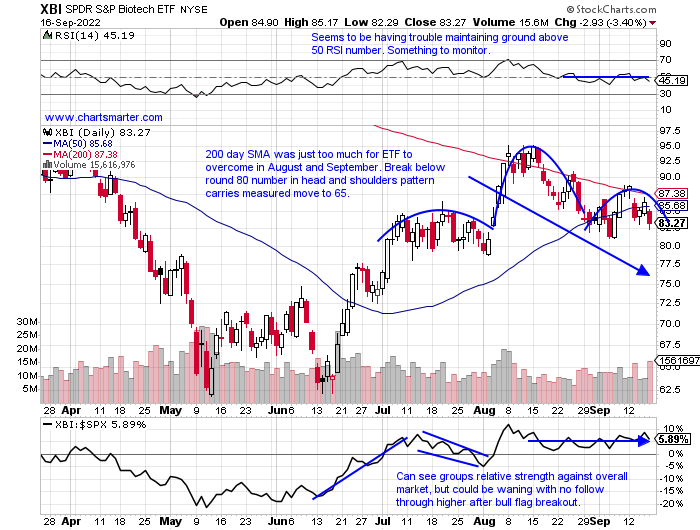
Bastion Of Strength Waning?
- When the tide of the market is outgoing even the strongest areas will have trouble circumventing the powerful current. The energetic areas on the tape have been few and far between and it looks like they may succumb soon. The biotech space has been respectable as over the last 3 months it is higher by 23%, although over the last one month period it has receded by 10%. On the chart below of the XBI, one can see the bearish head and shoulders and its reluctance to CLOSE meaningfully above its 200-day SMA. In fact, it broke BELOW a bull flag pattern that had a 95 pivot that was never taken out on the upside (we know from FALSE moves come fast ones in the opposite direction). Investors may be seeking comfort in the larger cap biotech plays as for the last 3 weeks the IBB has "outperformed" the XBI. Last week the XBI dropped by 5.3% and the IBB fell by 4.2%. But this begs the question if market participants are happy outperforming on a relative basis, but losing capital on an absolute basis. If the XBI surrenders the 80 number "cash is king" may be a phrase thrown around plenty. Below we take a look at 2 individual names that if the market can regain its composure look attractive.
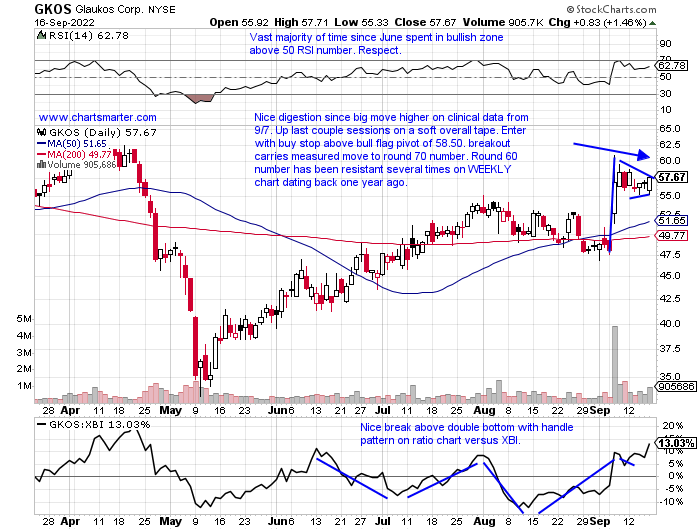
Healthcare Prospects:
- Biotech play higher by 30% YTD and 9% over last one year period.
- Name 11% off most recent 52-week highs and good action this week up 2.5% with XBI down 5.3%, and that was on top of prior week jumping by 15% in the second strongest WEEKLY volume in 2 1/2 years.
- Earnings mostly higher up .3, 3.8, and 18.6% on 8/4, 2/23, and 11/3/21, and a loss of 5.5% on 5/5.
- Enter with buy stop above bull flag pivot.
- Entry GKOS 58.50. Stop 54.
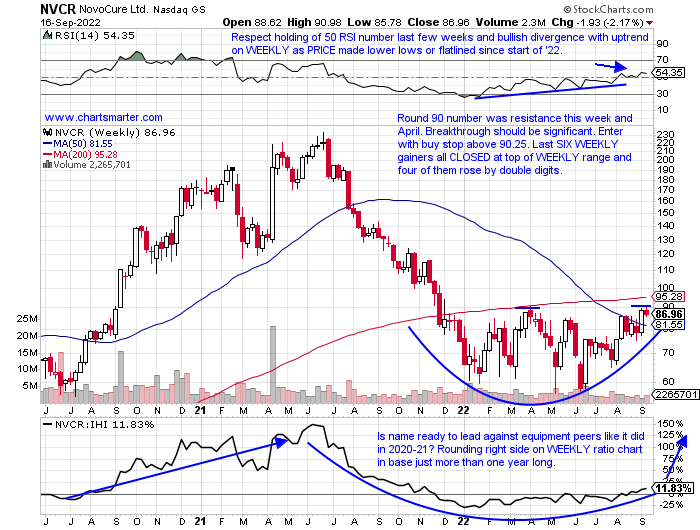
- Medical equipment play up 16% YTD and lower by 32% over last one year period.
- Name 34% off most recent 52-week highs and nice action since 30.4% WEEKLY gain ending 6/24 that was accompanied by third largest WEEKLY volume in 2022. Round 60 number on WEEKLY chart good support since COVID lows.
- Earnings mixed with gains of .3 and 6.8% on 4/28 and 2/24 and losses of 5 and 8.2% on 7/28 and 10/28/21.
- Enter with buy stop above very round number on WEEKLY chart.
- Entry NVCR 90.25. Stop 82.75.
Good luck.
This article requires a Chartsmarter membership. Please click here to join.
All Eyes On Yields:
- The Treasury market continues to be under hyper-focus as many take their cues from the "smarter" market. As many take their clues from the 10-year, which is extended from its rising 50-day SMA as it has been all year and on a current 7-week winning streak, below I take a look at the 20-year via the TLT. The vehicle is at an inflection point here which must hold this area or a likely magnetic push toward the very round par number, most likely resulting in further equity weakness. PRICE is omnipotent but candles can help guide and a bullish counterattack candle from 9/13 in strong volume. Friday recorded a doji which further strengthens the potential "bottoming" case as they are adept at sniffing out possible trend changes from the prevailing direction. Of course, they are not foolproof as for the second consecutive Friday a doji candle was recorded with the 9/9 session one too (bullish harami cross as well). Next week feels very important for the markets and the S&P 500 must quickly reclaim that 3900 level or the pain can just be getting started. The theme in this note is to be patient and wait for strength to resume before investing on the long side with confidence. How long that will take no one knows.
The Week That Was:
- There is no question last week was brutal and if one denies that the phrase that comes to mind is "there are none so blind as those who will not see". Every major S&P sector declined, and almost half of the 11 fell by at least 6% including tech, industrials, real estate, materials, and communication services. Not only was every sector attacked, but I could count on less than one hand the subsectors within the 11 that rose on a WEEKLY basis. They were automobiles, diversified REITs, recreational services, and gold miners. Friday may have shown some green shoots but it was mired by quadruple witching. One group that caught my attention as it went green early on in the session was the homebuilders, and more importantly, they CLOSED the day positive. No, I am not talking about the XHB which fell .5%, but the more "pure play" ITB which recorded a bullish engulfing candle. The reason this could be important as this group is interest rate sensitive.
Taking On Water:
- The Fed has already declared they do not want stock market appreciation and perhaps they are thinking of home values depreciating too. The chart below from Fortune already shows that occurring. And keep in mind this is a big factor sentiment wise, as many feel their house is there proper net worth. Looking at stocks within the group, all are not created equal. TOL may be able to weather the storm best as it caters to luxury consumers and it currently trades between the round 40-50 numbers and until one of those levels is taken out to the up or downside it is probably best to be patient. Some of the periphery plays may be better a little lower from here like a WSM which feels like it wants to retest a bullish ascending triangle breakout at the 130 level (which began at the very round par figure and already achieved its measured move to 160). MHK on the other hand may find temporary respite at the 100 figure here with two consecutive doji candles last Thursday-Friday but its downtrend should resume in quick fashion.
Semi Outlier:
- Within the bifurcated semiconductor group, albeit mostly laggards, a couple of names are standing tall among the wreckage. We have spoken of ON recently which continues to trade above a double bottom pivot of 67.29 taken out on 8/3. It had witnessed strong call buying for November at the 80 strikes. Last week it fell less than 4%, a good showing as the SMH slumped by 6%. Give the ETF credit Friday for CLOSING up on a soft tech tape, reversing higher off the very round 200 number. The outlier in the arena however is in the chart below of WOLF, the former CREE. It is 1 of 3 names in the group to have been in the news this month regarding new projects thanks to the CHIPS act. MU in Idaho, INTC in Ohio, and WOLF now in North Carolina. Micron and Intel are cellar dwellers off 46 and 48% from their most recent respective 52-week highs, while WOLF is "only" 16% off its own annual peak. Incredibly it has doubled during a current 10 of 11-week winning streak and this one feels poised to make a strong year-end run.
Bastion Of Strength Waning?
- When the tide of the market is outgoing even the strongest areas will have trouble circumventing the powerful current. The energetic areas on the tape have been few and far between and it looks like they may succumb soon. The biotech space has been respectable as over the last 3 months it is higher by 23%, although over the last one month period it has receded by 10%. On the chart below of the XBI, one can see the bearish head and shoulders and its reluctance to CLOSE meaningfully above its 200-day SMA. In fact, it broke BELOW a bull flag pattern that had a 95 pivot that was never taken out on the upside (we know from FALSE moves come fast ones in the opposite direction). Investors may be seeking comfort in the larger cap biotech plays as for the last 3 weeks the IBB has "outperformed" the XBI. Last week the XBI dropped by 5.3% and the IBB fell by 4.2%. But this begs the question if market participants are happy outperforming on a relative basis, but losing capital on an absolute basis. If the XBI surrenders the 80 number "cash is king" may be a phrase thrown around plenty. Below we take a look at 2 individual names that if the market can regain its composure look attractive.
Healthcare Prospects:
- Biotech play higher by 30% YTD and 9% over last one year period.
- Name 11% off most recent 52-week highs and good action this week up 2.5% with XBI down 5.3%, and that was on top of prior week jumping by 15% in the second strongest WEEKLY volume in 2 1/2 years.
- Earnings mostly higher up .3, 3.8, and 18.6% on 8/4, 2/23, and 11/3/21, and a loss of 5.5% on 5/5.
- Enter with buy stop above bull flag pivot.
- Entry GKOS 58.50. Stop 54.
- Medical equipment play up 16% YTD and lower by 32% over last one year period.
- Name 34% off most recent 52-week highs and nice action since 30.4% WEEKLY gain ending 6/24 that was accompanied by third largest WEEKLY volume in 2022. Round 60 number on WEEKLY chart good support since COVID lows.
- Earnings mixed with gains of .3 and 6.8% on 4/28 and 2/24 and losses of 5 and 8.2% on 7/28 and 10/28/21.
- Enter with buy stop above very round number on WEEKLY chart.
- Entry NVCR 90.25. Stop 82.75.
Good luck.