Semis Ready To Stretch Their Legs?
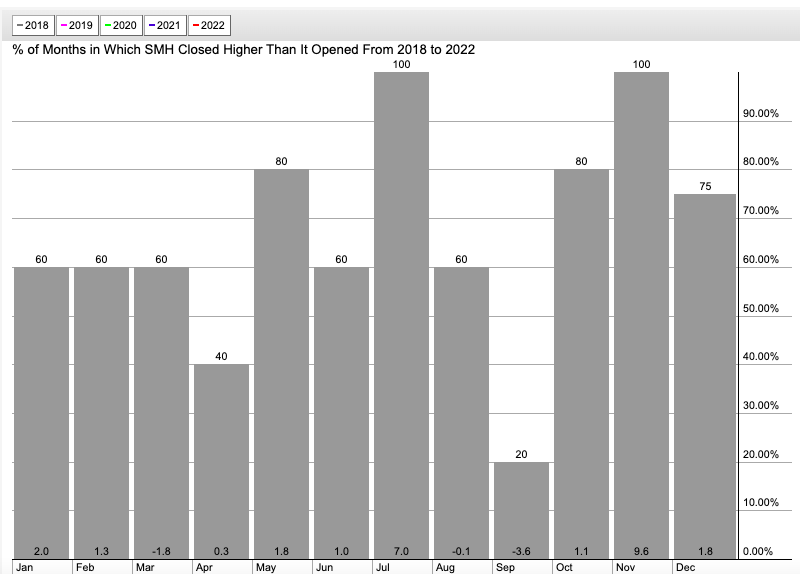
- The seasonality chart below of the SMH shows a very positive trend coming into play with a 5-month stretch that sees the ETF CLOSE higher than it started the month (notice how September was true to form with an average loss of 3.6% dating back to 2018). Obviously, November is the outlier up every month for the last 4 years and by an average of nearly 10%. There have been some green shoots recently too with MU acting well AFTER a nasty earnings reaction and INTC's Mobileye filing for an IPO. The SMH is 37% from its peak made last November, but this week is up 8% already heading into Wednesday. It is touching up here right at the very round 200 number but look for strength from top holding TSM which so far has the look of the bullish WEEKLY piercing line candle that it last recorded the week ending 7/8 that led to a 6-week winning streak. QCOM and AMD completed classic bullish morning star patterns Monday, and KLAC is breaking ABOVE a bear flag pattern. So far, so good.
Equipment Check:
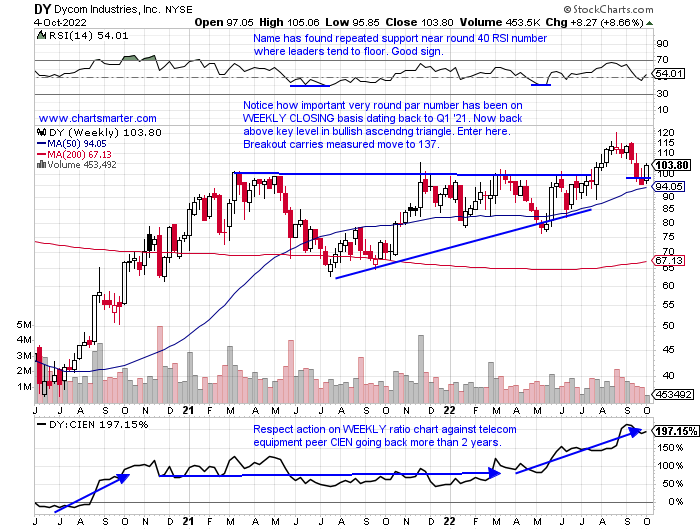
- The telecom equipment space has seen some nice winners and takeovers in the group. Always a good sign to see the perceived value. SWIR was a good example of that and its chart was acting well before the breakout, perhaps someone knew but more importantly PRICE action was a good indication to stay long through the turbulence. HLIT is just 2% off most recent 52-week highs and PI continues to act well as it looks to carve out a double bottom pattern. CLFD fell 5% Monday on a very nice tape but Tuesday regained almost all those losses. CIEN and LITE have been laggards. Below is the chart of mid-cap DY and it is a good-looking one (it has recorded FOUR straight positive earnings reactions). It is at a line in the sand level here at the very round par number. Prior to CLOSING above the 100 figure the week ending 7/29, it was above the number intraweek 9 times dating back to March '21 and it CLOSED above 100 just 1 of those 9 times. Good risk reward here with a stop of 93.
Recent Examples:
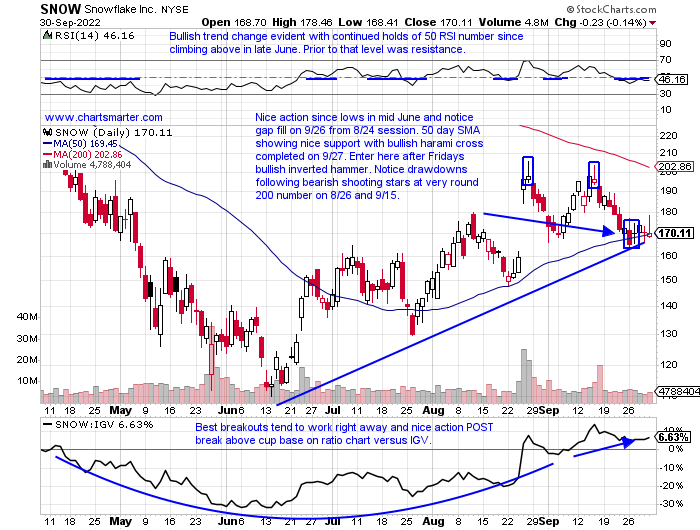
- Select software names have shown an ability to shrug off bad action within the sector. Among the larger cap names, PCTY comes to mind as it recently filled in the gap from the earings-related 8/4 session, and now looks like it's ready to potentially build the right side of a cup base pattern. CDNS is another nice chart that found some comfort at its 200-day SMA and is working its way toward a double bottom trigger of 176.07. Below is another one with the chart of SNOW and how it appeared in our 10/3 Technology Note. SNOW is still 55% off most recent 52-week highs but look for this name to charge into the very round 200 area very soon and it is back into the upper half of that huge WEEKLY gain ending 8/26 that rose more than 28% in the SECOND largest WEEKLY volume ever. Monday it filled in a gap from the 8/24 session, nearly to the penny, and CLOSED above the 165 stop.
Special Situations:
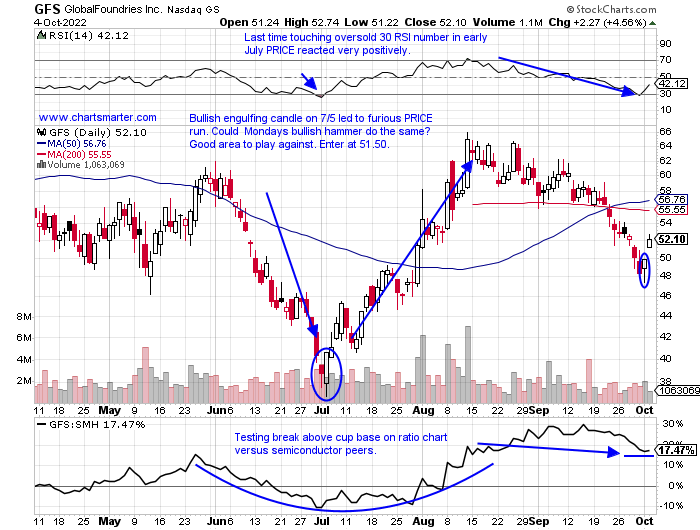
- Recent semiconductor new issue down 20% YTD but higher by 28% over last 3 months.
- Name 34% off most recent 52-week highs and down 6 of last 7 weeks. This week higher by 7.7% and is now back to the mid point of big 6-week winning streak the weeks ending between 7/8-8/12 which rose 79.2% top to bottom of range.
- Earnings mostly lower down 5.9, 7, and 4.3% on 8/9, 5/11, and 12/1/21 and rose 1.7% on 2/9.
- Enter on pullback into bullish hammer candle.
- Entry GFS 51.50. Stop 48.
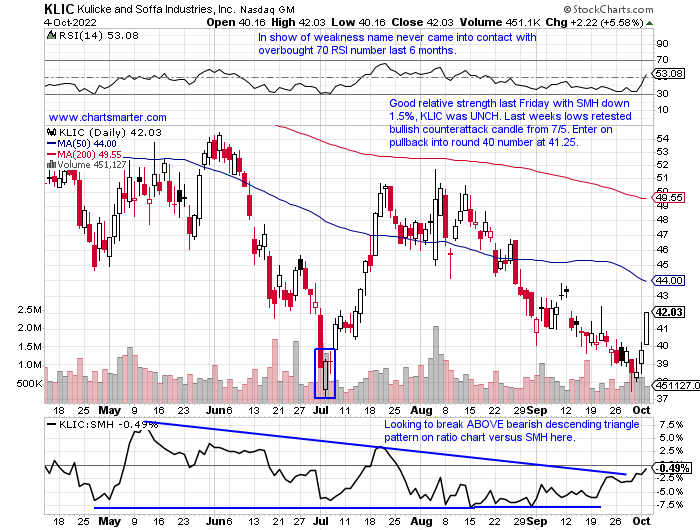
- Semi play down 31% YTD and 24% over last one year period. Dividend yield of 1.6%.
- Name 43% off most recent 52-week highs and has declined 7 of last 8 weeks but respect that it never took out its July lows, which if it holds would break series of lower lows dating back one year.
- Earnings mostly lower with losses of 1.4, 2.7 and 2.8% on 5/5, 2/3 and 11/18/21 before recent gain of 3.2% on 8/4.
- Enter on pullback into round number.
- Entry KLIC 41.25. Stop 38.50.
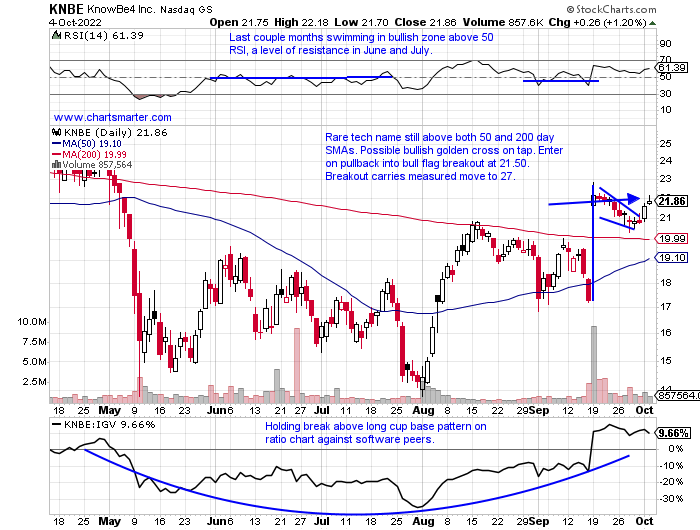
- Cyber security play down 5% YTD and higher by 3% over last one year period.
- Name 26% off 52-week highs and nice accumulation with big volume accompanying gains of 27.4 and 23.9% weeks ending 8/5 and 9/3. Looks comfortable above very round 20 number, an impediment since week ending 5/13.
- Earnings mixed with larger losses down 10 and 9.2% on 5/10 and 2/17 and gains of 6.4 and 1.1% on 8/4 and 11/3/21.
- Enter on pullback into break above bull flag.
- Entry KNBE 21.50. Stop 19.
Good luck.
Entry summaries:
Buy pullback into bullish hammer candle GFS 51.50. Stop 48.
Buy pullback into round number KLIC 41.25. Stop 38.50.
Buy pullback into break above bull flag breakout KNBE 21.50. Stop 19.
This article requires a Chartsmarter membership. Please click here to join.
Semis Ready To Stretch Their Legs?
- The seasonality chart below of the SMH shows a very positive trend coming into play with a 5-month stretch that sees the ETF CLOSE higher than it started the month (notice how September was true to form with an average loss of 3.6% dating back to 2018). Obviously, November is the outlier up every month for the last 4 years and by an average of nearly 10%. There have been some green shoots recently too with MU acting well AFTER a nasty earnings reaction and INTC's Mobileye filing for an IPO. The SMH is 37% from its peak made last November, but this week is up 8% already heading into Wednesday. It is touching up here right at the very round 200 number but look for strength from top holding TSM which so far has the look of the bullish WEEKLY piercing line candle that it last recorded the week ending 7/8 that led to a 6-week winning streak. QCOM and AMD completed classic bullish morning star patterns Monday, and KLAC is breaking ABOVE a bear flag pattern. So far, so good.
Equipment Check:
- The telecom equipment space has seen some nice winners and takeovers in the group. Always a good sign to see the perceived value. SWIR was a good example of that and its chart was acting well before the breakout, perhaps someone knew but more importantly PRICE action was a good indication to stay long through the turbulence. HLIT is just 2% off most recent 52-week highs and PI continues to act well as it looks to carve out a double bottom pattern. CLFD fell 5% Monday on a very nice tape but Tuesday regained almost all those losses. CIEN and LITE have been laggards. Below is the chart of mid-cap DY and it is a good-looking one (it has recorded FOUR straight positive earnings reactions). It is at a line in the sand level here at the very round par number. Prior to CLOSING above the 100 figure the week ending 7/29, it was above the number intraweek 9 times dating back to March '21 and it CLOSED above 100 just 1 of those 9 times. Good risk reward here with a stop of 93.
Recent Examples:
- Select software names have shown an ability to shrug off bad action within the sector. Among the larger cap names, PCTY comes to mind as it recently filled in the gap from the earings-related 8/4 session, and now looks like it's ready to potentially build the right side of a cup base pattern. CDNS is another nice chart that found some comfort at its 200-day SMA and is working its way toward a double bottom trigger of 176.07. Below is another one with the chart of SNOW and how it appeared in our 10/3 Technology Note. SNOW is still 55% off most recent 52-week highs but look for this name to charge into the very round 200 area very soon and it is back into the upper half of that huge WEEKLY gain ending 8/26 that rose more than 28% in the SECOND largest WEEKLY volume ever. Monday it filled in a gap from the 8/24 session, nearly to the penny, and CLOSED above the 165 stop.
Special Situations:
- Recent semiconductor new issue down 20% YTD but higher by 28% over last 3 months.
- Name 34% off most recent 52-week highs and down 6 of last 7 weeks. This week higher by 7.7% and is now back to the mid point of big 6-week winning streak the weeks ending between 7/8-8/12 which rose 79.2% top to bottom of range.
- Earnings mostly lower down 5.9, 7, and 4.3% on 8/9, 5/11, and 12/1/21 and rose 1.7% on 2/9.
- Enter on pullback into bullish hammer candle.
- Entry GFS 51.50. Stop 48.
- Semi play down 31% YTD and 24% over last one year period. Dividend yield of 1.6%.
- Name 43% off most recent 52-week highs and has declined 7 of last 8 weeks but respect that it never took out its July lows, which if it holds would break series of lower lows dating back one year.
- Earnings mostly lower with losses of 1.4, 2.7 and 2.8% on 5/5, 2/3 and 11/18/21 before recent gain of 3.2% on 8/4.
- Enter on pullback into round number.
- Entry KLIC 41.25. Stop 38.50.
- Cyber security play down 5% YTD and higher by 3% over last one year period.
- Name 26% off 52-week highs and nice accumulation with big volume accompanying gains of 27.4 and 23.9% weeks ending 8/5 and 9/3. Looks comfortable above very round 20 number, an impediment since week ending 5/13.
- Earnings mixed with larger losses down 10 and 9.2% on 5/10 and 2/17 and gains of 6.4 and 1.1% on 8/4 and 11/3/21.
- Enter on pullback into break above bull flag.
- Entry KNBE 21.50. Stop 19.
Good luck.
Entry summaries:
Buy pullback into bullish hammer candle GFS 51.50. Stop 48.
Buy pullback into round number KLIC 41.25. Stop 38.50.
Buy pullback into break above bull flag breakout KNBE 21.50. Stop 19.