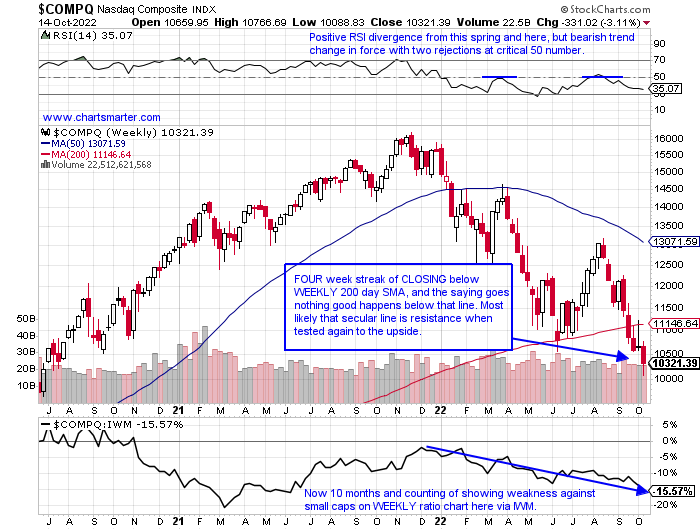
Round Number Rescue:
- For long time readers that know my affinity with round number theory it was a good example with the bounce off the very round 10000 number on Thursday for the Nasdaq (from the peak near 16000 almost one year ago thats a nearly 40% haircut). Could say the same thing about the S&P 500 at 3500. LRCX off 300. You get the picture. The leadership in mega cap tech has been nonexistent since August, but for the most part for longer than that. AAPL, the most valubale tech company on the planet, itself has a larger market cap than the entire energy sector. GOOGL now looks as if a bear flag formation has been carved out with resistance at the very round par number and a break below 95 would carry a measured move lower toward 70, which would not even touch the March 2020 lows. AMZN which flirted with 100 this spring-summer looks like another trip there is likely and it may not hold this time around. META has now lost two-thirds of its value, not a typo, since its peak last August. NVDA has sliced off roughly the same, from just last November. TSLA which REPORTS Wednesday on its WEEKLY chart has a rough neckline in a head and shoulders pattern in a base nearly 2 years long. Tech is disproportionately hurt by rising rates and the chart of the Nasdaq below better hold that 10000 figure it touched Thursday.
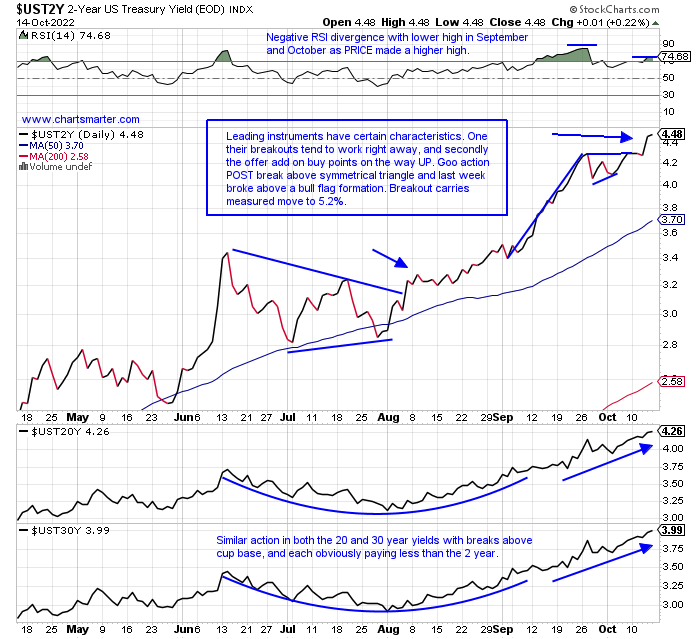
Bonds Did Not Get The Memo Thursday:
- The old saying goes the bond market is smarter than the equity market. It is much larger, to begin with, but remember this has been a distorted market now with the FED intervening in recent times. The relentless purchasing kept rates very low and now that they have backed off the accelerator they have furiously moved in the opposite direction. The fixed-income market continues to forecast a weak economy and the action on Thursday was telling. When the S&P 500 roared higher with a wild upside reversal the TLT fell on the session to the tune of 1%. The AGG also fell but did CLOSE near the top of its daily range (give credit for the HYG and LQD ending positively Thursday, albeit modestly). Was that a canary in the coal mine moment for a weak Friday? Looking below at the chart of the 2-year yield which everyone seems to be focused on it now, it carries a measured move to just above 5, and it continues to provide competition to the equity market with a yield of nearly 4.5% here. Remember not too long ago the Fed was worried about disinflation, and plenty of international bond yields were negative?
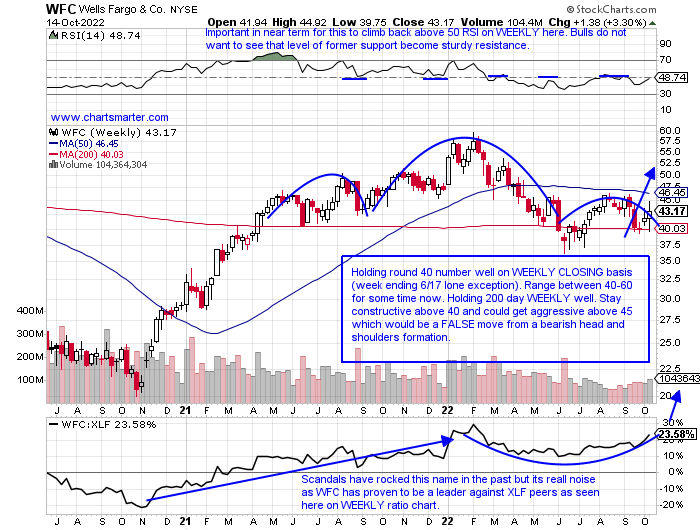
Earnings Period Kickoff:
- The finnies are starting to swim upstream somewhat. Last week the XLF was just one of three of the 11 major S&P sectors to gain ground (on a 3-month look-back period it is just one of two, along with energy in the green). Of course, earnings season is traditionally started with the group and they started to trickle in late last week. Some that reported earnings already include BLK which jumped 6.6% on Thursday near the very round 500 number after nearly touching four digits 11 months ago. C found support at the familiar 40 figure, and JPM was not far from par. BAC REPORTS Monday before the open and it still looks ok if it can hold 30, which held last week as a double bottom, and also successfully retested the bullish morning star pattern that was completed on 7/15. There were some outliers with FRC a former best-in-breed name plummeting more than 16% after an ill-received earnings reaction Friday. Below has been one of my favorite names in the space, along with MTB, in WFC which has its report behind it. Admire how it never made a lower low from the June-July lows like the majority of its peers did. Give this name the benefit of the doubt above 40 and extra credit above 45.
Conflicting Signals:
- If one were to look at the chart from a simple PRICE perspective one would see the 35 area roadblock. In fact, on a MONTHLY CLOSING basis dating back over a decade, there were only three finishes above the number (February-March 2020 and again in October 2020). So one can understand the shy behavior in the neighborhood. Many believe the VIX has lost its luster, and on Friday it was essentially UNCH on a very soft tape, recording a spinning top candle which often predicts a reversal of the prevailing trend (last Wednesday was a doji candle that retested the large bearish engulfing candle from 9/28). Notice on the MONTHLY chart below although the range has been wide the 35 area has been sticky. Is it readying itself to bust through to the upside? Or is it going to break its uptrend from August when it completed a double bottom that began at the very round 20 figure? I do not trade and do not put much credence into it either. Maybe soon it will gain its relevance once again.

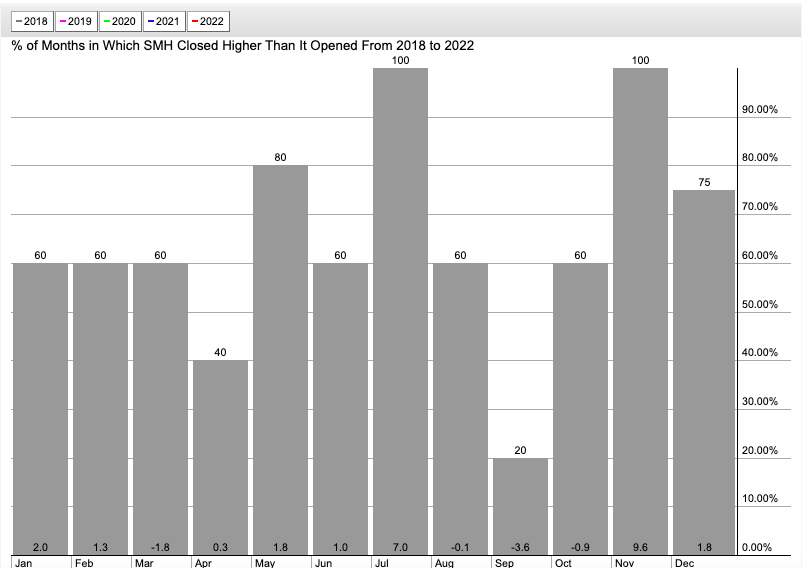
Seasons Greetings?
- Or early coal in the stocking? I have highlighted this seasonality chart for the SMH in recent weeks and thought maybe it would be a good time to revisit it. Just 2 weeks away starts easily the firmest month action of the year with the last 4 November's all CLOSING higher than where they began the month. I went back and took a peek and none of them obviously witnessed a downtrend coming into the month like they are now and the last two years witnessed the SMH get off to a robust start. The week ending 11/6/20 jumped 12.6% and the fund never looked back, and the week ending 11/5/21 rose 8.4% and then traded sideways before topping this January. This prolonged downtrend speaks to the old adage "time kills more than PRICE". Usually, I will mention a couple of ideas within the group but with the current market climate, it is best to be in plenty of cash and monitor from the sidelines. One look this week at INTC and it may offer some "value" here with a tight stop.
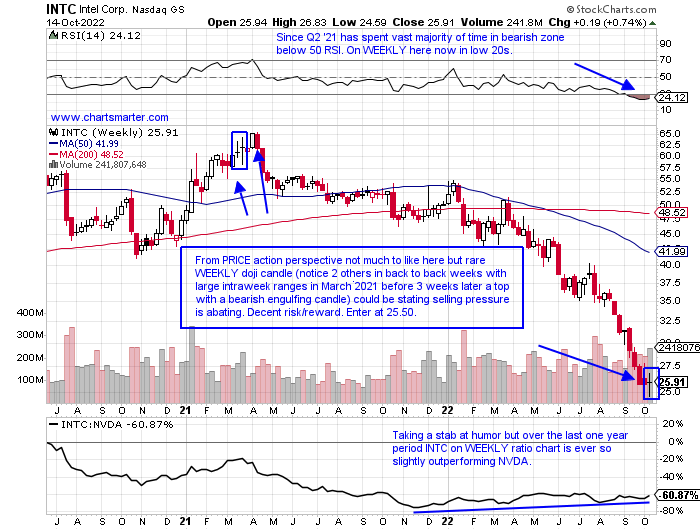
Contrarian Thinking:
- Chip laggard down 50% YTD and 51% over last one year period. Dividend yield of 5.6%.
- Name 54% off 52-week highs and last week was UP .7% recording WEEKLY doji candle (SMH fell 8.2%), that are adept at predicting trend changes from prevailing direction. Last 3 weeks all CLOSED very taut within just .19 of each other.
- FOUR straight negative earnings reactions (NINE in a row too) off 8.6, 6.9, 7, and 11.7% on 7/29, 4/29, 1/27, and 10/22/21.
- Enter after recent WEEKLY doji candle.
- Entry INTC 25.50. Stop 24 (REPORTS 10/27 after CLOSE).
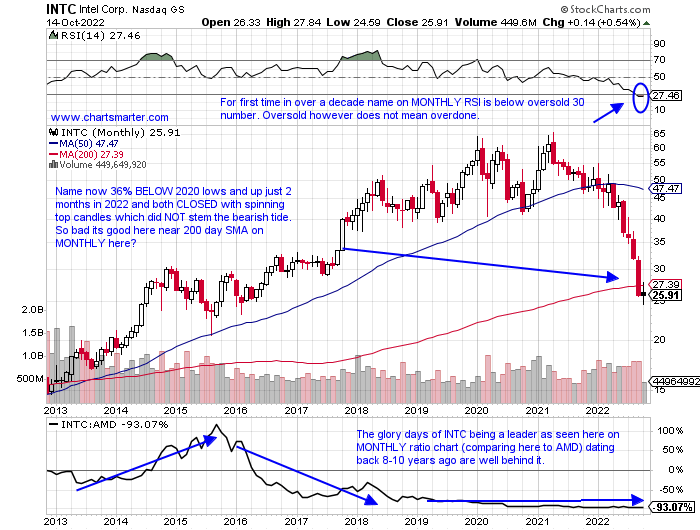
I thought I would add a MONTHLY chart on the name as well here. "New" CEO Pat Gelsinger, a 30-year veteran of the firm who would become its first CTO after his initial stint, has been unable to steer the ship since coming on board again in February 2021. The good feeling of new blood was short-lived as one can see the bearish MONTHLY engulfing candle in April 2021 which recorded a double top near 65. For those looking for yield, not me as I prefer PRICE appreciation, it pays more than the surging 2-year yield!
Good luck.
Round Number Rescue:
- For long time readers that know my affinity with round number theory it was a good example with the bounce off the very round 10000 number on Thursday for the Nasdaq (from the peak near 16000 almost one year ago thats a nearly 40% haircut). Could say the same thing about the S&P 500 at 3500. LRCX off 300. You get the picture. The leadership in mega cap tech has been nonexistent since August, but for the most part for longer than that. AAPL, the most valubale tech company on the planet, itself has a larger market cap than the entire energy sector. GOOGL now looks as if a bear flag formation has been carved out with resistance at the very round par number and a break below 95 would carry a measured move lower toward 70, which would not even touch the March 2020 lows. AMZN which flirted with 100 this spring-summer looks like another trip there is likely and it may not hold this time around. META has now lost two-thirds of its value, not a typo, since its peak last August. NVDA has sliced off roughly the same, from just last November. TSLA which REPORTS Wednesday on its WEEKLY chart has a rough neckline in a head and shoulders pattern in a base nearly 2 years long. Tech is disproportionately hurt by rising rates and the chart of the Nasdaq below better hold that 10000 figure it touched Thursday.
Bonds Did Not Get The Memo Thursday:
- The old saying goes the bond market is smarter than the equity market. It is much larger, to begin with, but remember this has been a distorted market now with the FED intervening in recent times. The relentless purchasing kept rates very low and now that they have backed off the accelerator they have furiously moved in the opposite direction. The fixed-income market continues to forecast a weak economy and the action on Thursday was telling. When the S&P 500 roared higher with a wild upside reversal the TLT fell on the session to the tune of 1%. The AGG also fell but did CLOSE near the top of its daily range (give credit for the HYG and LQD ending positively Thursday, albeit modestly). Was that a canary in the coal mine moment for a weak Friday? Looking below at the chart of the 2-year yield which everyone seems to be focused on it now, it carries a measured move to just above 5, and it continues to provide competition to the equity market with a yield of nearly 4.5% here. Remember not too long ago the Fed was worried about disinflation, and plenty of international bond yields were negative?
Earnings Period Kickoff:
- The finnies are starting to swim upstream somewhat. Last week the XLF was just one of three of the 11 major S&P sectors to gain ground (on a 3-month look-back period it is just one of two, along with energy in the green). Of course, earnings season is traditionally started with the group and they started to trickle in late last week. Some that reported earnings already include BLK which jumped 6.6% on Thursday near the very round 500 number after nearly touching four digits 11 months ago. C found support at the familiar 40 figure, and JPM was not far from par. BAC REPORTS Monday before the open and it still looks ok if it can hold 30, which held last week as a double bottom, and also successfully retested the bullish morning star pattern that was completed on 7/15. There were some outliers with FRC a former best-in-breed name plummeting more than 16% after an ill-received earnings reaction Friday. Below has been one of my favorite names in the space, along with MTB, in WFC which has its report behind it. Admire how it never made a lower low from the June-July lows like the majority of its peers did. Give this name the benefit of the doubt above 40 and extra credit above 45.
Conflicting Signals:
- If one were to look at the chart from a simple PRICE perspective one would see the 35 area roadblock. In fact, on a MONTHLY CLOSING basis dating back over a decade, there were only three finishes above the number (February-March 2020 and again in October 2020). So one can understand the shy behavior in the neighborhood. Many believe the VIX has lost its luster, and on Friday it was essentially UNCH on a very soft tape, recording a spinning top candle which often predicts a reversal of the prevailing trend (last Wednesday was a doji candle that retested the large bearish engulfing candle from 9/28). Notice on the MONTHLY chart below although the range has been wide the 35 area has been sticky. Is it readying itself to bust through to the upside? Or is it going to break its uptrend from August when it completed a double bottom that began at the very round 20 figure? I do not trade and do not put much credence into it either. Maybe soon it will gain its relevance once again.
Seasons Greetings?
- Or early coal in the stocking? I have highlighted this seasonality chart for the SMH in recent weeks and thought maybe it would be a good time to revisit it. Just 2 weeks away starts easily the firmest month action of the year with the last 4 November's all CLOSING higher than where they began the month. I went back and took a peek and none of them obviously witnessed a downtrend coming into the month like they are now and the last two years witnessed the SMH get off to a robust start. The week ending 11/6/20 jumped 12.6% and the fund never looked back, and the week ending 11/5/21 rose 8.4% and then traded sideways before topping this January. This prolonged downtrend speaks to the old adage "time kills more than PRICE". Usually, I will mention a couple of ideas within the group but with the current market climate, it is best to be in plenty of cash and monitor from the sidelines. One look this week at INTC and it may offer some "value" here with a tight stop.
Contrarian Thinking:
- Chip laggard down 50% YTD and 51% over last one year period. Dividend yield of 5.6%.
- Name 54% off 52-week highs and last week was UP .7% recording WEEKLY doji candle (SMH fell 8.2%), that are adept at predicting trend changes from prevailing direction. Last 3 weeks all CLOSED very taut within just .19 of each other.
- FOUR straight negative earnings reactions (NINE in a row too) off 8.6, 6.9, 7, and 11.7% on 7/29, 4/29, 1/27, and 10/22/21.
- Enter after recent WEEKLY doji candle.
- Entry INTC 25.50. Stop 24 (REPORTS 10/27 after CLOSE).
I thought I would add a MONTHLY chart on the name as well here. "New" CEO Pat Gelsinger, a 30-year veteran of the firm who would become its first CTO after his initial stint, has been unable to steer the ship since coming on board again in February 2021. The good feeling of new blood was short-lived as one can see the bearish MONTHLY engulfing candle in April 2021 which recorded a double top near 65. For those looking for yield, not me as I prefer PRICE appreciation, it pays more than the surging 2-year yield!
Good luck.