"If You Can Meet With Triumph And Disaster And Treat Those Two Impostors Just The Same" -Rudyard Kipling
Monthly Nasdaq Confusion:
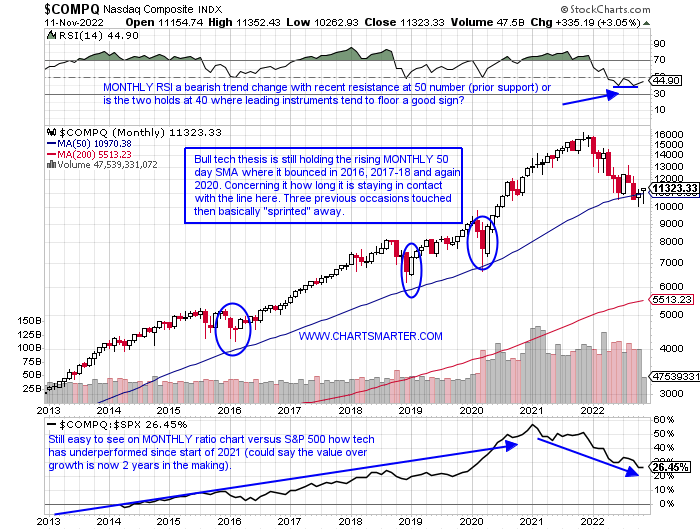
- That eloquent quote above hangs just above the entrance to the hallowed grounds at the All England Club at Wimbledon. It is meant to keep emotions in check, no matter what the outcome, on the tennis court at one of the most famous sporting venues under enormous pressure. Certainly, it could be applied to market participants who have tried to navigate this very difficult landscape recently. Huge highs and lows have occurred and in my opinion, it is not the healthiest of actions. Thursday the Nasdaq jumped 7.3% in very firm volume and give credit for Friday up another 2%. I was always taught that bottoms formed in a smooth, gradual fashion, not this wild volatile nature we are presently seeing. Perhaps it will end up being as simple as round number theory with the MONTHLY gravestone doji candle in November 2021 at 16000 as the top, and the spinning top candle at 10000 in October at the low. There is still 2 1/2 weeks left this month and a CLOSE above 11000 has to be viewed through a bullish lens. Call me skeptical but PRICE as always will let us know.
Santa Out Of Steam?
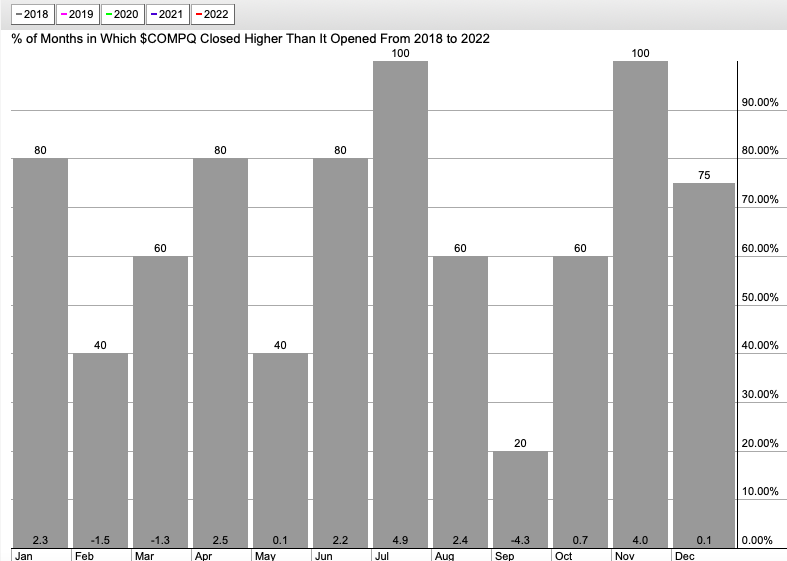
- Sometimes the anticipation of something is better than the act itself. Tell that to those who are believers not in Santa Claus, but in the perceived rally, he brings into year-end. Over the last 4-5 years the "Santa Claus Rally" has been muted at best. The seasonality chart below illustrates this fact. For the Nasdaq, November is easily the second-best MONTHLY return in the last half-decade with an average return of 4% (up every November the last four years). Noticeable is December's lackluster performance basically UNCH, even though it advanced 3 of the last 4 Decembers (for the S&P 500, Dow, and Russell 2000 the stats are remarkably similar for those who were wondering). Of course, the tech-heavy benchmark is up just more than 3% this month so far thanks to last week's surge so maybe it will be muted going forward. As always indicators or strategies tend to lose their edge the more people follow them and they become mainstream. Could we have seen our Santa Claus Rally already less than halfway into November already?
Semis Showing Their Traditional Predictability:
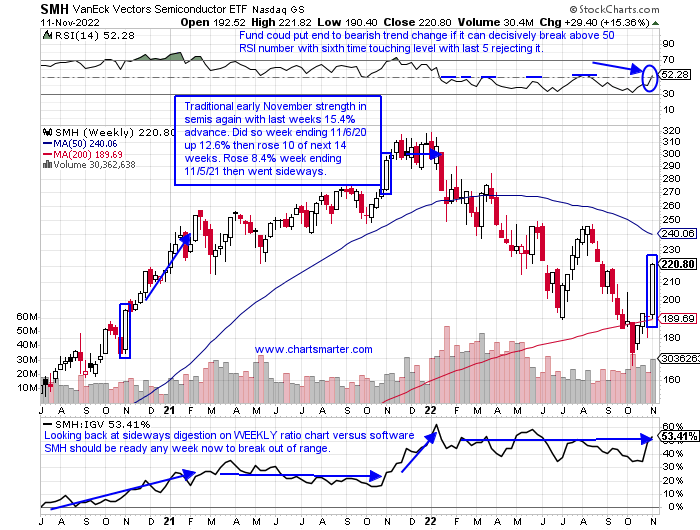
- If one is discussing technology the dialogue must include semiconductors. They are an important group and they are seen to display vigor at the beginning of November. Below on the WEEKLY chart that action is evident (not shown was the SMH week ending 11/2/18 gain of 7.5%). Sometimes it sets off a furious pace higher, and others it stalls or shows the vast majority of the MONTHLY gain in that one week. Last week's jump higher of more than 15% came from a depressed level and it is anyone's guess where the rest of November will travel toward. Of course, this space will be a big factor in what technology does into year-end, but to me, the best thing to do is to play individual leading names that sport valid buy points. ON should be at the top of one list as Thursday broke above a double bottom pivot of 71.68. ACLS is another one that screamed above a double bottom trigger of 68.93. Give these some room and wait for a 3-4% pullback instead of chasing here.
Still Overweight Value Against Growth:
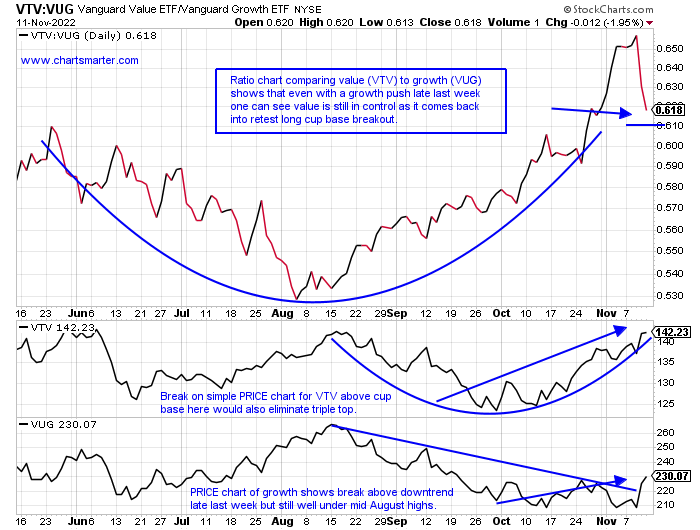
- With all the chat about tech thus far in this note we are still in a "show me" game. PRICE action via the ratio chart below with value versus growth via the VTV against the VUG still favors the former. That is even with last week's divergence with the VUG jumping 8.9%, nearly tripling the VTV advance of 3.3%. Over the near term, the VTV is higher 5 of the last 6 weeks and the fund trades just 6% off its most recent 52-week highs, compared to the VUG 30% off its own annual peak. On its WEEKLY chart, the VTV is just beneath a double bottom pivot of 144.06, while the VUG is just trying to find its footing. The VTV top holding in BRKB Friday jumped above its 200-day SMA for the first time in five months and I like the mix of healthcare, financials, energy, and staples. The weighting of technology inside the VUG is better than 50% and that space still has lots to prove. Advantage value until proven WRONG through PRICE behavior.
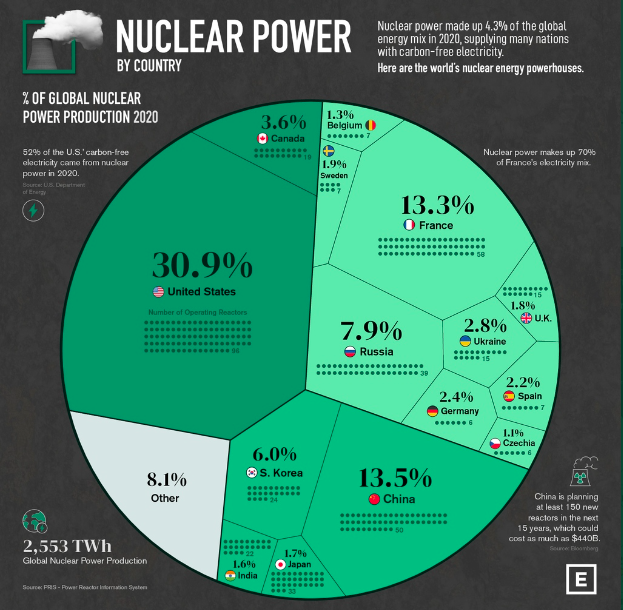
Nuclear Aspirations:
- The need for nuclear as a reliable power source is making more and more sense for energy needs worldwide. It is a clean and stable way to transition going forward which will take a lot longer than many think. Below is the chart from elements.visualcapitalist.com and the part I see most compelling is how China is planning to spend almost half a trillion dollars on new nuclear reactors. Uranium plays are not abundant, but the most recognizable name is most likely the Canadian play CCJ. It has been repelled at its 200-day SMA and an upside gap fill from the 10/11 session since falling below the secular line on 10/12. Most others are single-digit names with UUUU looking attractive here as it attempts to build the right side of a WEEKLY double bottom base with a potential pivot on 11.10. Looking at some periphery plays that I think to make the most sense are two charts at the bottom of this note, both of which have been acting very well even when the overall market was stumbling, a great sign in and of itself.
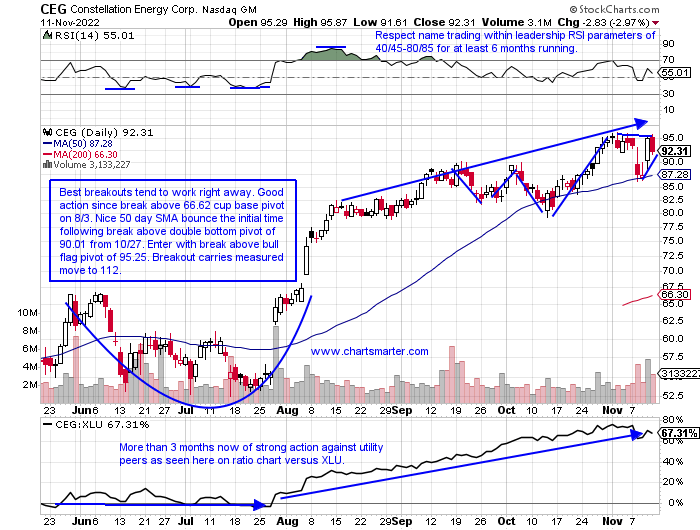
Constellation Energy:
- Nuclear (renewable) utility play up 120% YTD and sports a dividend yield of .6%.
- Name 4% off most recent 52-week highs and overall superior action after 3-week winning streak the weeks ending 7/29-8/12 screamed higher by 44%. Very impressive next 3 weeks all CLOSED very taut within just .24 of each other.
- Earnings mostly lower down 6.4 and 6.8% on 11/8 and 5/12 and a gain of 10.1% on 8/5.
- Enter with buy stop above bull flag pivot.
- Entry CEG 95.25. Stop 89.
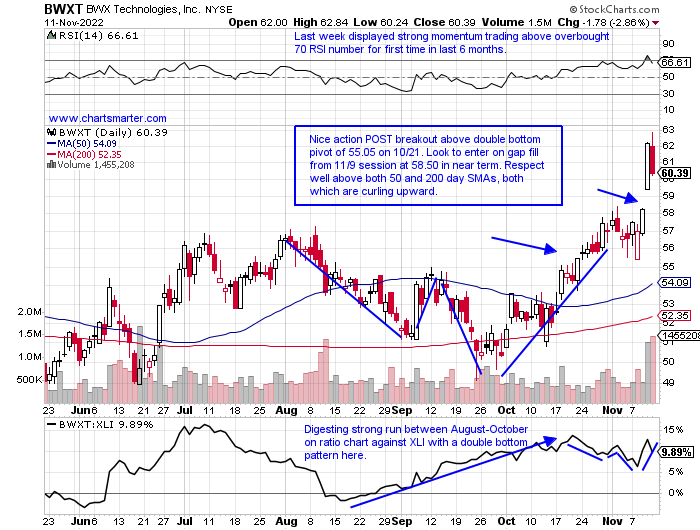
BWX Technologies:
- Classified as nuclear industrial play up 26% YTD and 16% over last one year period. Dividend yield of 1.5%.
- Name 4% off most recent 52-week highs, up 4 of last 6 weeks after WEEKLY doji candle at very round 50 number week ending 9/30. Last week rose 6.7%, its best WEEKLY advance since week ending 3/4 in firm WEEKLY volume.
- Earnings mixed down .8 and .3% on 11/8 and 8/2 and gains of .6 and 5.5% on 5/10 and 2/23.
- Enter on pullback into gap fill.
- Entry BWXT 58.50. Stop 55.
Good luck.
This article requires a Chartsmarter membership. Please click here to join.
"If You Can Meet With Triumph And Disaster And Treat Those Two Impostors Just The Same" -Rudyard Kipling
Monthly Nasdaq Confusion:
- That eloquent quote above hangs just above the entrance to the hallowed grounds at the All England Club at Wimbledon. It is meant to keep emotions in check, no matter what the outcome, on the tennis court at one of the most famous sporting venues under enormous pressure. Certainly, it could be applied to market participants who have tried to navigate this very difficult landscape recently. Huge highs and lows have occurred and in my opinion, it is not the healthiest of actions. Thursday the Nasdaq jumped 7.3% in very firm volume and give credit for Friday up another 2%. I was always taught that bottoms formed in a smooth, gradual fashion, not this wild volatile nature we are presently seeing. Perhaps it will end up being as simple as round number theory with the MONTHLY gravestone doji candle in November 2021 at 16000 as the top, and the spinning top candle at 10000 in October at the low. There is still 2 1/2 weeks left this month and a CLOSE above 11000 has to be viewed through a bullish lens. Call me skeptical but PRICE as always will let us know.
Santa Out Of Steam?
- Sometimes the anticipation of something is better than the act itself. Tell that to those who are believers not in Santa Claus, but in the perceived rally, he brings into year-end. Over the last 4-5 years the "Santa Claus Rally" has been muted at best. The seasonality chart below illustrates this fact. For the Nasdaq, November is easily the second-best MONTHLY return in the last half-decade with an average return of 4% (up every November the last four years). Noticeable is December's lackluster performance basically UNCH, even though it advanced 3 of the last 4 Decembers (for the S&P 500, Dow, and Russell 2000 the stats are remarkably similar for those who were wondering). Of course, the tech-heavy benchmark is up just more than 3% this month so far thanks to last week's surge so maybe it will be muted going forward. As always indicators or strategies tend to lose their edge the more people follow them and they become mainstream. Could we have seen our Santa Claus Rally already less than halfway into November already?
Semis Showing Their Traditional Predictability:
- If one is discussing technology the dialogue must include semiconductors. They are an important group and they are seen to display vigor at the beginning of November. Below on the WEEKLY chart that action is evident (not shown was the SMH week ending 11/2/18 gain of 7.5%). Sometimes it sets off a furious pace higher, and others it stalls or shows the vast majority of the MONTHLY gain in that one week. Last week's jump higher of more than 15% came from a depressed level and it is anyone's guess where the rest of November will travel toward. Of course, this space will be a big factor in what technology does into year-end, but to me, the best thing to do is to play individual leading names that sport valid buy points. ON should be at the top of one list as Thursday broke above a double bottom pivot of 71.68. ACLS is another one that screamed above a double bottom trigger of 68.93. Give these some room and wait for a 3-4% pullback instead of chasing here.
Still Overweight Value Against Growth:
- With all the chat about tech thus far in this note we are still in a "show me" game. PRICE action via the ratio chart below with value versus growth via the VTV against the VUG still favors the former. That is even with last week's divergence with the VUG jumping 8.9%, nearly tripling the VTV advance of 3.3%. Over the near term, the VTV is higher 5 of the last 6 weeks and the fund trades just 6% off its most recent 52-week highs, compared to the VUG 30% off its own annual peak. On its WEEKLY chart, the VTV is just beneath a double bottom pivot of 144.06, while the VUG is just trying to find its footing. The VTV top holding in BRKB Friday jumped above its 200-day SMA for the first time in five months and I like the mix of healthcare, financials, energy, and staples. The weighting of technology inside the VUG is better than 50% and that space still has lots to prove. Advantage value until proven WRONG through PRICE behavior.
Nuclear Aspirations:
- The need for nuclear as a reliable power source is making more and more sense for energy needs worldwide. It is a clean and stable way to transition going forward which will take a lot longer than many think. Below is the chart from elements.visualcapitalist.com and the part I see most compelling is how China is planning to spend almost half a trillion dollars on new nuclear reactors. Uranium plays are not abundant, but the most recognizable name is most likely the Canadian play CCJ. It has been repelled at its 200-day SMA and an upside gap fill from the 10/11 session since falling below the secular line on 10/12. Most others are single-digit names with UUUU looking attractive here as it attempts to build the right side of a WEEKLY double bottom base with a potential pivot on 11.10. Looking at some periphery plays that I think to make the most sense are two charts at the bottom of this note, both of which have been acting very well even when the overall market was stumbling, a great sign in and of itself.
Constellation Energy:
- Nuclear (renewable) utility play up 120% YTD and sports a dividend yield of .6%.
- Name 4% off most recent 52-week highs and overall superior action after 3-week winning streak the weeks ending 7/29-8/12 screamed higher by 44%. Very impressive next 3 weeks all CLOSED very taut within just .24 of each other.
- Earnings mostly lower down 6.4 and 6.8% on 11/8 and 5/12 and a gain of 10.1% on 8/5.
- Enter with buy stop above bull flag pivot.
- Entry CEG 95.25. Stop 89.
BWX Technologies:
- Classified as nuclear industrial play up 26% YTD and 16% over last one year period. Dividend yield of 1.5%.
- Name 4% off most recent 52-week highs, up 4 of last 6 weeks after WEEKLY doji candle at very round 50 number week ending 9/30. Last week rose 6.7%, its best WEEKLY advance since week ending 3/4 in firm WEEKLY volume.
- Earnings mixed down .8 and .3% on 11/8 and 8/2 and gains of .6 and 5.5% on 5/10 and 2/23.
- Enter on pullback into gap fill.
- Entry BWXT 58.50. Stop 55.
Good luck.