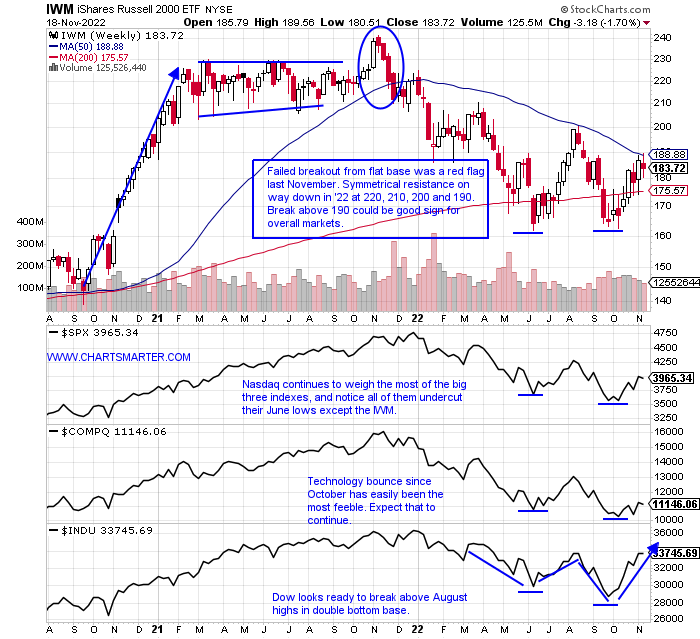
Size Matters:
- As everyone looks to the direction of the greenback, interest rates, and crypto for signs of what the market may do next, could it be as simple as what the small caps do? Keep in mind this space tends to lead and remember how one of the most telegraphed breakouts in some time almost 1 year ago fell apart in rapid fashion. On the chart below one could see the very clean breakout above a flat base with the IWM jumping 6% the week ending 11/5/20. The saying goes "if it's obvious it's obviously WRONG" comes into play here. The ETF subsequently went on a 4-week losing streak falling by a combined 12%. It "led" in this situation too as the S&P 500 and Nasdaq did not start their descents until 3 weeks later (Dow fell roughly in line the same as the IWM). The point I am trying to make here is the IWM has been demonstrating some relative strength as the only of the 4 aforementioned benchmarks NOT to undercut their June lows. If they can break this string of lower highs that began at 220 to start 2022, could that be a sign that a real bottom is in, as they potentially "lead" to the upside here? A decisive CLOSING break above 190 next week could be the catalyst.
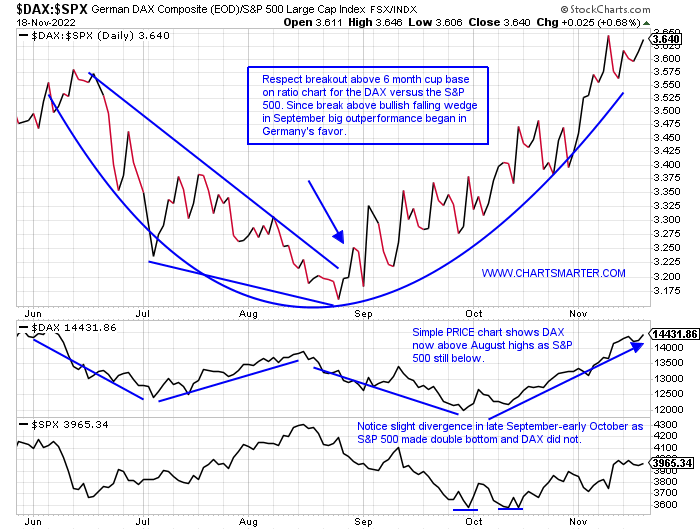
Oktoberfest Continues:
- There has been no hangover for the German DAX this month so far as seen below on the ratio chart comparing it to the S&P 500. The DAX is now on a current 7-week winning streak with the last 4 CLOSING at the highs for the WEEKLY range since a bullish engulfing candle the week ending 10/7. With a diverse mix of names acting very well this action could continue for some time. SIEGY is on an 8-week winning streak with the last two jumping 20% alone. SAP has advanced 6 of the last 8 weeks and last week fell fractionally after the prior week soared almost 15%, easily scoring its best WEEKLY gain since the week ending 4/10/20. DB has risen 4 of the last 6 weeks with all 4 gainers up between 7-9%. BMWYY is carving out a handle on its cup base just below the round 30 number. Even ADDYY jumped almost a combined 40% in the 2 weeks ending between 11/4-11. Most of these examples are coming off very depressed levels, and it will be interesting to see going forward how this ratio chart holds up.
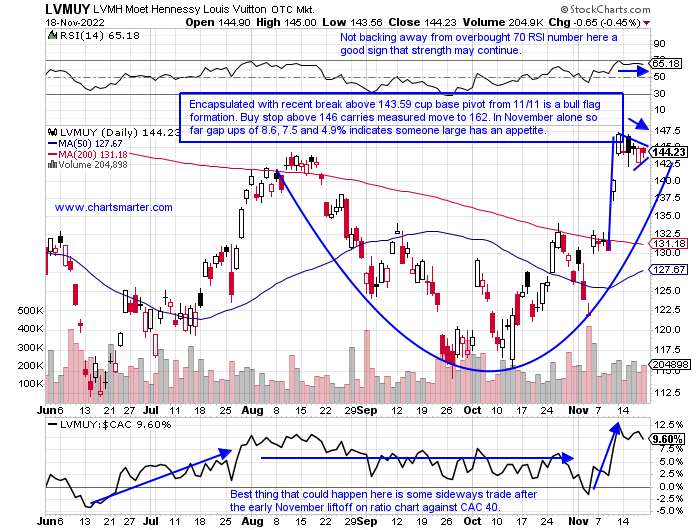
Vive la France:
- Luxury goods stocks are thriving around the globe. Here at home, we have to look no further than the solid PRICE action as of late in CPRI or TPR. Both are bull flagging above their respective 50 and 200-day SMAs. Within Europe, it is more of the same with Italian plays such as RACE, or even a ZGN which may one day break above a very taut after almost 2 years of sideways trade. A headline that did not get much attention this week was France overtaking London to become Europe's largest stock market. The largest holding by far in the CAC 40, by almost double is LVMH. Below is the chart that almost singlehandedly is responsible for Frances's triumph. This week ended a 7-week winning streak falling a very modest 1.9%, completely acceptable given the prior week screamed higher by 11% (only its third double-digit WEEKLY gain in 2 years). By market cap, it is the second largest international company on Earth besides Aramco and this name looks like its recent rally has legs, dare I say frog legs?
Chinese Standout:
- Continuing with the international theme we head to the Far East. China's internet via the KWEB lost one-quarter of its value during a 3-week losing streak between the weeks ending 10/14-28. The week ending 10/28 slumped 11.1% recording a WEEKLY spinning top candle, a good indication that a bottom was possibly in. It was accompanied by the second largest WEEKLY volume in at least 5 years further supporting a bounce. The ETF did just that but remember all stocks are not created equal and the best ones rise more than others. The most recognizable names are JD and BABA and over the last month period, JD is the leader up 25% compared to BABA's rise of "just" 5%. The chart below of PDD, which REPORTS next Friday before the open, has been the clear winner. On a YTD basis, it is up 20% as JD and BABA are down 20 and 32%. On a 3 month look back period PDD is higher by 53% while JD rose 2% and BABA is down 10%. PDD is knocking on the door of a big WEEKLY breakout above an ascending triangle. If the China bounce continues this should continue to outperform handily.

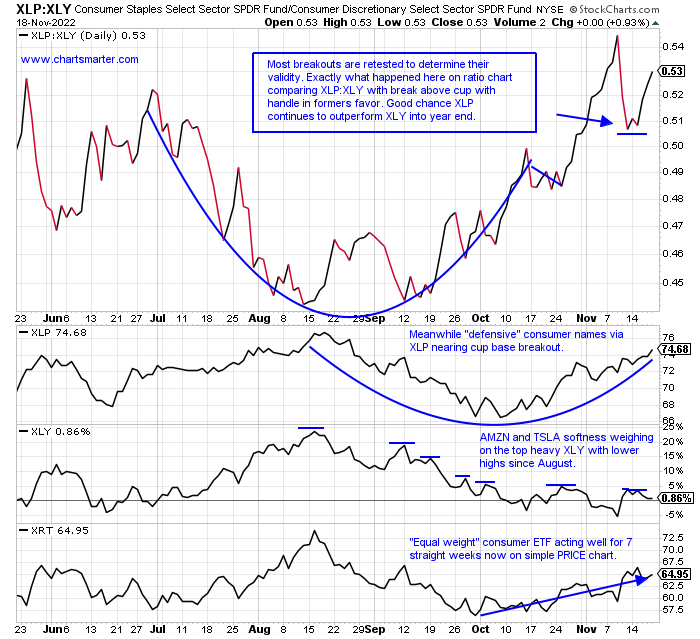
Defensive Posture:
- When one looks to interpret the "risk on" feel within the markets there are numerous ways to do so. Within the consumer space, the most familiar way to determine this is to compare the staples to discretionary. Just judging from the last one-week period one could easily see why the ratio chart below strongly favors the defensive names of the staples. Last week the XLP was the best major S&P sector of 11 rising 1.6% and the XLY was the worst falling 2.8%. ELF was a big factor for the staples last week jumping more than 10%, and that stock is now higher an incredible 21 of the last 26 weeks. WMT added 5%. Weighing on discretionary was TSLA, the second-largest holding in the XLY. Give credit to some names that REPORTED earnings and witnessed nice reactions in the specialty retail group including FL GPS and BBWI to name a few. The staples are essentially UNCH on a YTD basis with a dividend yield of 3% with consistent positive action among food product plays (including junk food names like TR TWNK and UTZ). And with AMZN still, 50% off its peak one year ago expect the ratio chart below to have a bias toward defense. Let's take a look at one name from each group that is attractive.
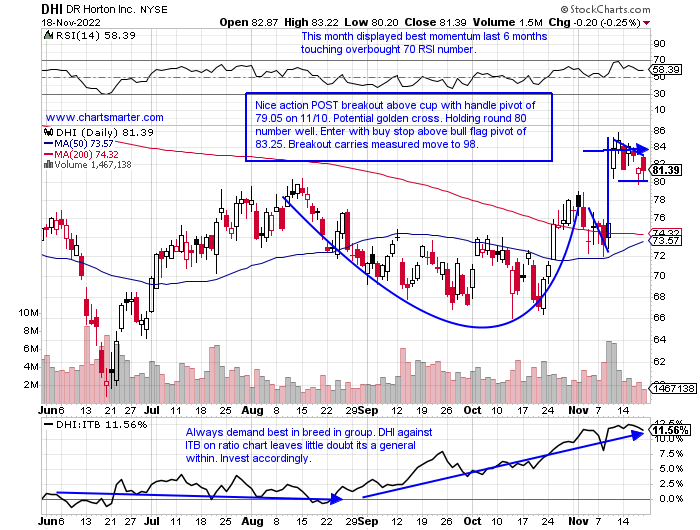
DR Horton Inc:
- Best-in-breed housing down 25% YTD and 20% over the last one year period. Dividend yield of 1.2%.
- Name 26% off most recent 52-week highs (ITB down 30% off its own annual peak) and over last 3 months displaying fine relative strength up 10% as ITB is lower by 3%.
- Earnings mostly higher up 3, 3.8, and 1.6% on 11/9, 7/21, and 2/2, and fell 2.7% on 4/26.
- Enter with buy stop above bull flag pivot.
- Entry DHI 83.25. Stop 79.
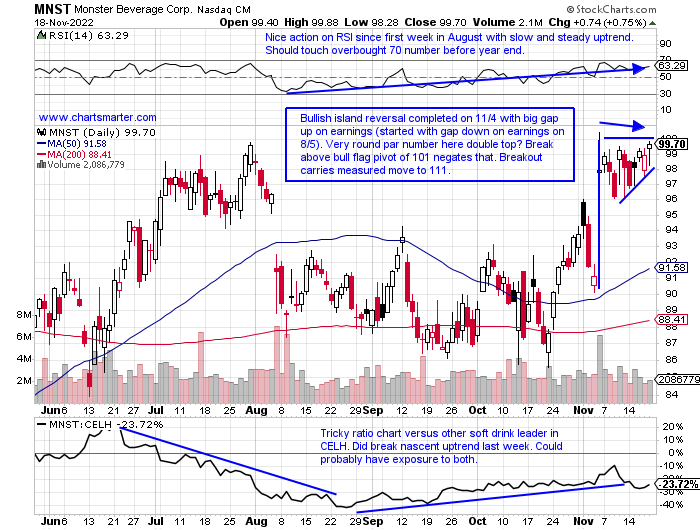
Monster Beverage:
- Beverage leader up 4% YTD and 12% over last one year period.
- Name just 1% off most recent 52-week highs and sitting right at the very round par number which has been WEEKLY resistance in April and August '21 and January and July this year. Break above could be powerful.
- Earnings mostly higher up 7.5, 4.4, and 5.2% on 11/4, 5/6, and 2/25, and fell 5.2% on 8/5.
- Enter with buy stop above bull flag pivot.
- Entry MNST 101. Stop 96.25.
Good luck.
This article requires a Chartsmarter membership. Please click here to join.
Size Matters:
- As everyone looks to the direction of the greenback, interest rates, and crypto for signs of what the market may do next, could it be as simple as what the small caps do? Keep in mind this space tends to lead and remember how one of the most telegraphed breakouts in some time almost 1 year ago fell apart in rapid fashion. On the chart below one could see the very clean breakout above a flat base with the IWM jumping 6% the week ending 11/5/20. The saying goes "if it's obvious it's obviously WRONG" comes into play here. The ETF subsequently went on a 4-week losing streak falling by a combined 12%. It "led" in this situation too as the S&P 500 and Nasdaq did not start their descents until 3 weeks later (Dow fell roughly in line the same as the IWM). The point I am trying to make here is the IWM has been demonstrating some relative strength as the only of the 4 aforementioned benchmarks NOT to undercut their June lows. If they can break this string of lower highs that began at 220 to start 2022, could that be a sign that a real bottom is in, as they potentially "lead" to the upside here? A decisive CLOSING break above 190 next week could be the catalyst.
Oktoberfest Continues:
- There has been no hangover for the German DAX this month so far as seen below on the ratio chart comparing it to the S&P 500. The DAX is now on a current 7-week winning streak with the last 4 CLOSING at the highs for the WEEKLY range since a bullish engulfing candle the week ending 10/7. With a diverse mix of names acting very well this action could continue for some time. SIEGY is on an 8-week winning streak with the last two jumping 20% alone. SAP has advanced 6 of the last 8 weeks and last week fell fractionally after the prior week soared almost 15%, easily scoring its best WEEKLY gain since the week ending 4/10/20. DB has risen 4 of the last 6 weeks with all 4 gainers up between 7-9%. BMWYY is carving out a handle on its cup base just below the round 30 number. Even ADDYY jumped almost a combined 40% in the 2 weeks ending between 11/4-11. Most of these examples are coming off very depressed levels, and it will be interesting to see going forward how this ratio chart holds up.
Vive la France:
- Luxury goods stocks are thriving around the globe. Here at home, we have to look no further than the solid PRICE action as of late in CPRI or TPR. Both are bull flagging above their respective 50 and 200-day SMAs. Within Europe, it is more of the same with Italian plays such as RACE, or even a ZGN which may one day break above a very taut after almost 2 years of sideways trade. A headline that did not get much attention this week was France overtaking London to become Europe's largest stock market. The largest holding by far in the CAC 40, by almost double is LVMH. Below is the chart that almost singlehandedly is responsible for Frances's triumph. This week ended a 7-week winning streak falling a very modest 1.9%, completely acceptable given the prior week screamed higher by 11% (only its third double-digit WEEKLY gain in 2 years). By market cap, it is the second largest international company on Earth besides Aramco and this name looks like its recent rally has legs, dare I say frog legs?
Chinese Standout:
- Continuing with the international theme we head to the Far East. China's internet via the KWEB lost one-quarter of its value during a 3-week losing streak between the weeks ending 10/14-28. The week ending 10/28 slumped 11.1% recording a WEEKLY spinning top candle, a good indication that a bottom was possibly in. It was accompanied by the second largest WEEKLY volume in at least 5 years further supporting a bounce. The ETF did just that but remember all stocks are not created equal and the best ones rise more than others. The most recognizable names are JD and BABA and over the last month period, JD is the leader up 25% compared to BABA's rise of "just" 5%. The chart below of PDD, which REPORTS next Friday before the open, has been the clear winner. On a YTD basis, it is up 20% as JD and BABA are down 20 and 32%. On a 3 month look back period PDD is higher by 53% while JD rose 2% and BABA is down 10%. PDD is knocking on the door of a big WEEKLY breakout above an ascending triangle. If the China bounce continues this should continue to outperform handily.
Defensive Posture:
- When one looks to interpret the "risk on" feel within the markets there are numerous ways to do so. Within the consumer space, the most familiar way to determine this is to compare the staples to discretionary. Just judging from the last one-week period one could easily see why the ratio chart below strongly favors the defensive names of the staples. Last week the XLP was the best major S&P sector of 11 rising 1.6% and the XLY was the worst falling 2.8%. ELF was a big factor for the staples last week jumping more than 10%, and that stock is now higher an incredible 21 of the last 26 weeks. WMT added 5%. Weighing on discretionary was TSLA, the second-largest holding in the XLY. Give credit to some names that REPORTED earnings and witnessed nice reactions in the specialty retail group including FL GPS and BBWI to name a few. The staples are essentially UNCH on a YTD basis with a dividend yield of 3% with consistent positive action among food product plays (including junk food names like TR TWNK and UTZ). And with AMZN still, 50% off its peak one year ago expect the ratio chart below to have a bias toward defense. Let's take a look at one name from each group that is attractive.
DR Horton Inc:
- Best-in-breed housing down 25% YTD and 20% over the last one year period. Dividend yield of 1.2%.
- Name 26% off most recent 52-week highs (ITB down 30% off its own annual peak) and over last 3 months displaying fine relative strength up 10% as ITB is lower by 3%.
- Earnings mostly higher up 3, 3.8, and 1.6% on 11/9, 7/21, and 2/2, and fell 2.7% on 4/26.
- Enter with buy stop above bull flag pivot.
- Entry DHI 83.25. Stop 79.
Monster Beverage:
- Beverage leader up 4% YTD and 12% over last one year period.
- Name just 1% off most recent 52-week highs and sitting right at the very round par number which has been WEEKLY resistance in April and August '21 and January and July this year. Break above could be powerful.
- Earnings mostly higher up 7.5, 4.4, and 5.2% on 11/4, 5/6, and 2/25, and fell 5.2% on 8/5.
- Enter with buy stop above bull flag pivot.
- Entry MNST 101. Stop 96.25.
Good luck.