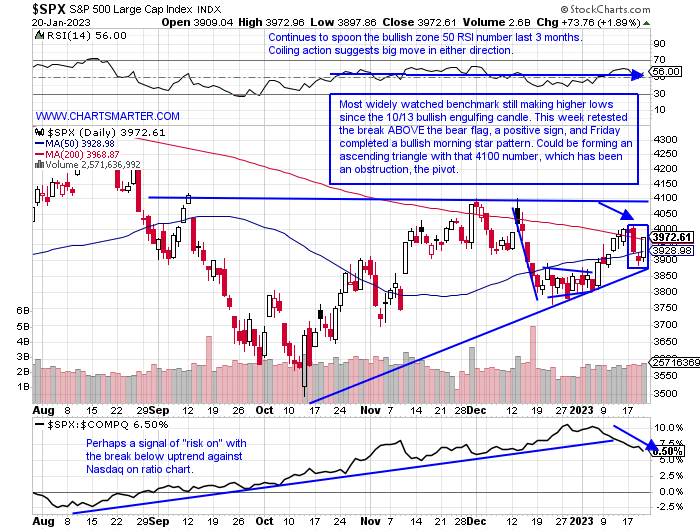
Resiliency:
- One has to admire the tenacity of the S&P 500 which has now CLOSED above its 200-day SMA to end the week for the fourth time since November 30th. Sure Friday CLOSED less than 4 handles above the downward-sloping secular line, but bears may be wondering if their time is limited. I still think you have to play this market on a tactical basis until we are decisively above that 200-day, but the technical landscape is improving. The burden of proof is still on the bulls, but the bears in the back of their mind must be playing with the thought that the longer the market refuses to go down the less bearish it is, almost like a time stop. And another positive is how the Nasdaq on a relative basis has been outperforming as seen on the ratio chart below. That does not mean both can not act well on an absolute basis, but perhaps tech will begin to broaden out the rally. In the last 2 weeks the Nasdaq was stronger up .5% last week as the S&P 500 fell .7%, and the week prior the Nasdaq was up 4.8% while the S&P 500 rose 2.7%. The bulls are gaining steam but must keep their eye on the ball.
Equity Headwind?
- The ten-year yield is still in bear market mode now 20% off most recent 52-week highs, if you go by the traditional definition. Its WEEKLY chart still has the look of a nice uptrend and let's not forget the 12-week winning streak between the weeks ending 8/5-10/21/22. It has now given back half of that run that rose by more than a combined 70%. The daily chart below shows if the 10-year is looking for a technical near-term bottom from a good risk/reward scenario that came via the bullish harami cross from this past Thursday. Will this be a headwind for the markets? Time will tell but with most of the bank earnings now behind us, it is interesting to see which ones have outperformed, in the teeth of falling rates. The 2 winners in my opinion have been MS and C. Morgan Stanley is nicely building the right side of a WEEKLY cup base and Citibank cleared a bullish inverse head and shoulders pattern with a slanted neckline and is now on a 4-week winning streak up by a combined 15%. The losers were SCHW which has declined 9% in the last 2 weeks and GS which fell nearly 9% last week alone in the largest WEEKLY volume since the COVID lows in March 2020.

Greenshoots Abound:
- It has been an eternity since I have heard much of the growth versus value debate. But a look below at how 2023 has started, albeit a small sample size, has to have growth investors a bit excited. At the top of the leaderboard, one has to be impressed with the communication services and discretionary. Keep in mind the XLY was the fourth best-behaved major S&P sector last week even with the lousy retail sales data and it is a good leading indicator. Sure it would be better to see technology more involved but up better than 5% this year just 3 weeks in is a good start. And "risk on" flavor can be seen in who is inhabiting the cellar. The bottom 3 sectors are all defensive, or "value" in nature. The XLV, XLU, and XLP are all in negative territory and some of the moves in the individual staples names were outsized. WEEKLY declines between 5-6% included KHC COB HSY and GIS. TWNK can not blame the nascent weakness on its company as it has shed one-quarter of its value during its current 8 of 11 week losing streak.

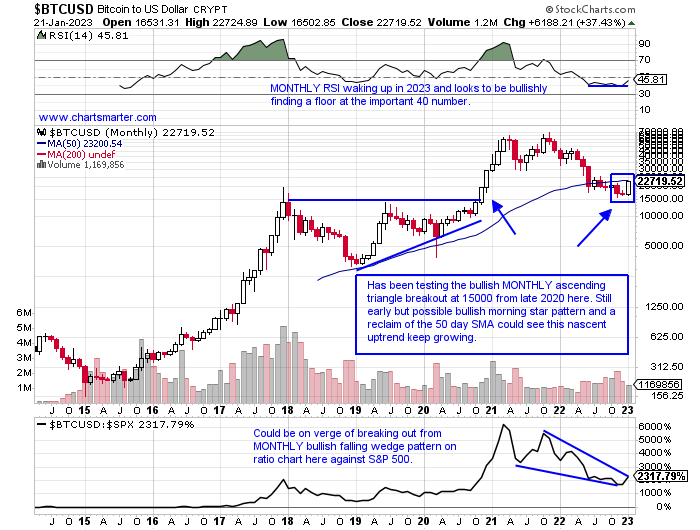
Fortune Favors The Brave:
- There are many ways to judge "risk-on" as we have been following and a lot of these indicators are looking more positive by the week. Recently we took a look at junk bonds and below we look at just how well Bitcoin has been acting. Sentiment has been horrible in this asset class as it has declined 10 of the last 14 months. But this month so far with nearly 2/3rds done it is higher by more than 36%, not a typo. The MONTHLY chart retested a bullish ascending triangle breakout from November 2020, which witnessed a run from the very round 10000 number to 60000 during a 6-month winning streak. The last 7 sessions of January can really see a lot of technical damage repaired, especially if it can recapture its MONTHLY 50-day SMA and record the bullish morning star pattern. When Bitcoin gains momentum it could go to dizzying heights. It's not really about the chart but just about the PRICE action of bitcoin. If it can't go back down, that could be a sanguine signal. If this Bitcoin rally has legs look for the market to rally in tandem with it.
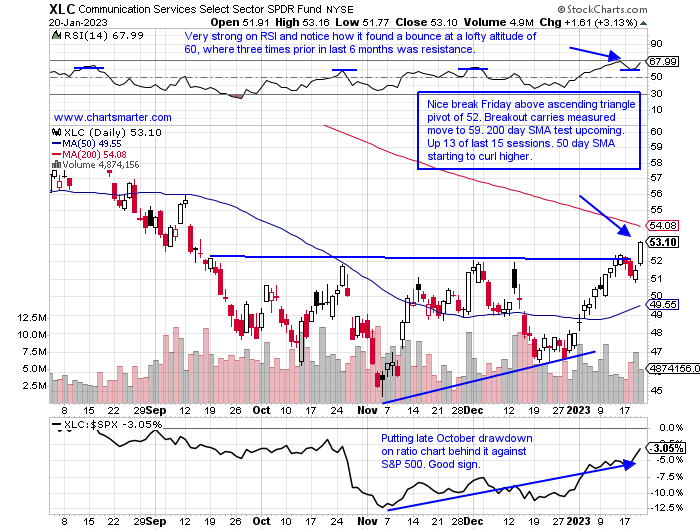
Consummate Communication Services?
- In life as in markets, one should always give credit where it is due. In our first WEEK AHEAD Note of 2023 we highlighted the strength in the communication services sector as it rose 5% in the first week of 2023. And it has not really looked back, on Friday it rose more than 3%, and again on a WEEKLY basis, it was the strongest of the 11 major S&P sectors adding 1.4%. On a YTD lookback period it is increasing its pole position lead now up more than 10%. Below one can see the chart broke above a bullish ascending triangle, and perhaps more importantly it was the FIFTH consecutive week CLOSING at highs for the WEEKLY range. GOOGL and DASH jumped 5 and 6% respectively Friday with the former just below the very round par number which has been a thorn in its side. META which completed a bullish WEEKLY morning star candle the week ending 11/11 is up 16% in 2023 already. Two other names to watch this week which CLOSED just below their 200-day SMAs include SPOT and DIS. Let's look further at a name to go long in BIDU and short in RBLX.
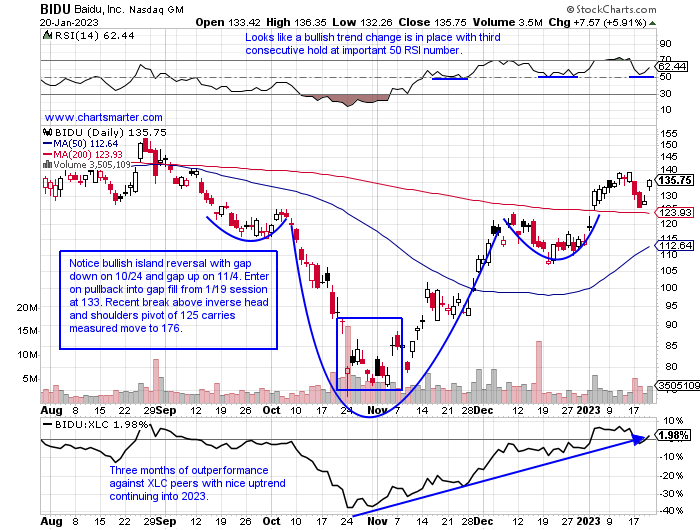
Baidu Inc.
- Chinese internet play up 19% YTD and lower by 16% over last one year period.
- Name 21% off most recent 52-week highs and advanced 8 of last 12 weeks including jumps of 21.9 and 16.3% the weeks ending 12/2 and 1/6. Three of the 4 decliners fell less than 3%. Doji candle recorded last week only concern.
- Earnings mostly higher up .6, 14.1 and 6.8% on 11/22, 5/26 and 3/1 and fell 6.5% on 8/30.
- Enter on pullback into gap fill/bullish inverse head and shoulders breakout.
- Entry BIDU 133. Stop 121.
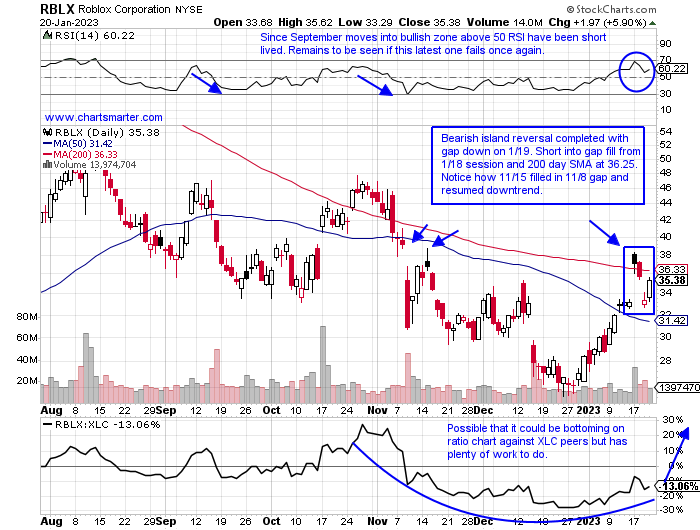
Roblox Corp:
- Electronic gaming laggard up 24% YTD and lower by 53% over last one year period.
- Name 53% off most recent 52-week highs and on a 4-week winning streak but last week recorded bearish filled-in black candlestick meeting resistance at the downward sloping 50-day WEEKLY SMA.
- Earnings mixed with much larger losses down 21 and 26.5% on 11/9 and 2/16 and rose 1.4 and 3.4% on 8/10 and 5/11.
- Enter short into gap fill/200-day SMA.
- Entry RBLX 36. Buy stop 38.25.
Good luck.
This article requires a Chartsmarter membership. Please click here to join.
Resiliency:
- One has to admire the tenacity of the S&P 500 which has now CLOSED above its 200-day SMA to end the week for the fourth time since November 30th. Sure Friday CLOSED less than 4 handles above the downward-sloping secular line, but bears may be wondering if their time is limited. I still think you have to play this market on a tactical basis until we are decisively above that 200-day, but the technical landscape is improving. The burden of proof is still on the bulls, but the bears in the back of their mind must be playing with the thought that the longer the market refuses to go down the less bearish it is, almost like a time stop. And another positive is how the Nasdaq on a relative basis has been outperforming as seen on the ratio chart below. That does not mean both can not act well on an absolute basis, but perhaps tech will begin to broaden out the rally. In the last 2 weeks the Nasdaq was stronger up .5% last week as the S&P 500 fell .7%, and the week prior the Nasdaq was up 4.8% while the S&P 500 rose 2.7%. The bulls are gaining steam but must keep their eye on the ball.
Equity Headwind?
- The ten-year yield is still in bear market mode now 20% off most recent 52-week highs, if you go by the traditional definition. Its WEEKLY chart still has the look of a nice uptrend and let's not forget the 12-week winning streak between the weeks ending 8/5-10/21/22. It has now given back half of that run that rose by more than a combined 70%. The daily chart below shows if the 10-year is looking for a technical near-term bottom from a good risk/reward scenario that came via the bullish harami cross from this past Thursday. Will this be a headwind for the markets? Time will tell but with most of the bank earnings now behind us, it is interesting to see which ones have outperformed, in the teeth of falling rates. The 2 winners in my opinion have been MS and C. Morgan Stanley is nicely building the right side of a WEEKLY cup base and Citibank cleared a bullish inverse head and shoulders pattern with a slanted neckline and is now on a 4-week winning streak up by a combined 15%. The losers were SCHW which has declined 9% in the last 2 weeks and GS which fell nearly 9% last week alone in the largest WEEKLY volume since the COVID lows in March 2020.
Greenshoots Abound:
- It has been an eternity since I have heard much of the growth versus value debate. But a look below at how 2023 has started, albeit a small sample size, has to have growth investors a bit excited. At the top of the leaderboard, one has to be impressed with the communication services and discretionary. Keep in mind the XLY was the fourth best-behaved major S&P sector last week even with the lousy retail sales data and it is a good leading indicator. Sure it would be better to see technology more involved but up better than 5% this year just 3 weeks in is a good start. And "risk on" flavor can be seen in who is inhabiting the cellar. The bottom 3 sectors are all defensive, or "value" in nature. The XLV, XLU, and XLP are all in negative territory and some of the moves in the individual staples names were outsized. WEEKLY declines between 5-6% included KHC COB HSY and GIS. TWNK can not blame the nascent weakness on its company as it has shed one-quarter of its value during its current 8 of 11 week losing streak.
Fortune Favors The Brave:
- There are many ways to judge "risk-on" as we have been following and a lot of these indicators are looking more positive by the week. Recently we took a look at junk bonds and below we look at just how well Bitcoin has been acting. Sentiment has been horrible in this asset class as it has declined 10 of the last 14 months. But this month so far with nearly 2/3rds done it is higher by more than 36%, not a typo. The MONTHLY chart retested a bullish ascending triangle breakout from November 2020, which witnessed a run from the very round 10000 number to 60000 during a 6-month winning streak. The last 7 sessions of January can really see a lot of technical damage repaired, especially if it can recapture its MONTHLY 50-day SMA and record the bullish morning star pattern. When Bitcoin gains momentum it could go to dizzying heights. It's not really about the chart but just about the PRICE action of bitcoin. If it can't go back down, that could be a sanguine signal. If this Bitcoin rally has legs look for the market to rally in tandem with it.
Consummate Communication Services?
- In life as in markets, one should always give credit where it is due. In our first WEEK AHEAD Note of 2023 we highlighted the strength in the communication services sector as it rose 5% in the first week of 2023. And it has not really looked back, on Friday it rose more than 3%, and again on a WEEKLY basis, it was the strongest of the 11 major S&P sectors adding 1.4%. On a YTD lookback period it is increasing its pole position lead now up more than 10%. Below one can see the chart broke above a bullish ascending triangle, and perhaps more importantly it was the FIFTH consecutive week CLOSING at highs for the WEEKLY range. GOOGL and DASH jumped 5 and 6% respectively Friday with the former just below the very round par number which has been a thorn in its side. META which completed a bullish WEEKLY morning star candle the week ending 11/11 is up 16% in 2023 already. Two other names to watch this week which CLOSED just below their 200-day SMAs include SPOT and DIS. Let's look further at a name to go long in BIDU and short in RBLX.
Baidu Inc.
- Chinese internet play up 19% YTD and lower by 16% over last one year period.
- Name 21% off most recent 52-week highs and advanced 8 of last 12 weeks including jumps of 21.9 and 16.3% the weeks ending 12/2 and 1/6. Three of the 4 decliners fell less than 3%. Doji candle recorded last week only concern.
- Earnings mostly higher up .6, 14.1 and 6.8% on 11/22, 5/26 and 3/1 and fell 6.5% on 8/30.
- Enter on pullback into gap fill/bullish inverse head and shoulders breakout.
- Entry BIDU 133. Stop 121.
Roblox Corp:
- Electronic gaming laggard up 24% YTD and lower by 53% over last one year period.
- Name 53% off most recent 52-week highs and on a 4-week winning streak but last week recorded bearish filled-in black candlestick meeting resistance at the downward sloping 50-day WEEKLY SMA.
- Earnings mixed with much larger losses down 21 and 26.5% on 11/9 and 2/16 and rose 1.4 and 3.4% on 8/10 and 5/11.
- Enter short into gap fill/200-day SMA.
- Entry RBLX 36. Buy stop 38.25.
Good luck.