“There are always two parties, the establishment, and the movement.” Ralph Waldo Emerson
Round Number Abundance:
- Consider the bears as the establishment and the bulls as the movement. In 2023 technology bulls have taken the baton and it is crucial that they do not fumble it. The round numbers were popping up ubiquitously last week. In some of the bigger names META and TSLA were stopped at the very round 200 number, as were some other less followed plays like JBHT and FIVE. Others in tech include GOOGL which may look to fill the gap near par next week. Below is the chart of the QQQ and it may look to retrace back toward 300 next week before another possible leg up, as a breakout above an ascending triangle just below the round figure may provide some comfort. Keep in mind most breakouts are retested, but bulls do not want breakouts to linger back near the pivot point as that would be a red flag. An undercut of that 295 area would be considered a bear trap and a very sinister development, but for the first time in a while, it feels like the burden of proof is on the bears. Inside technology AAPL being a component in the PRICE-weighted DOW may have contributed to its holding up better than the Nasdaq until the start of 2023 as it comprised just 3% index (interesting that MSFT is now the top holding in the QQQ barely edging out AAPL at almost 12%, nearly 4 times the influence that it has on the Dow).

Europe Ailing?
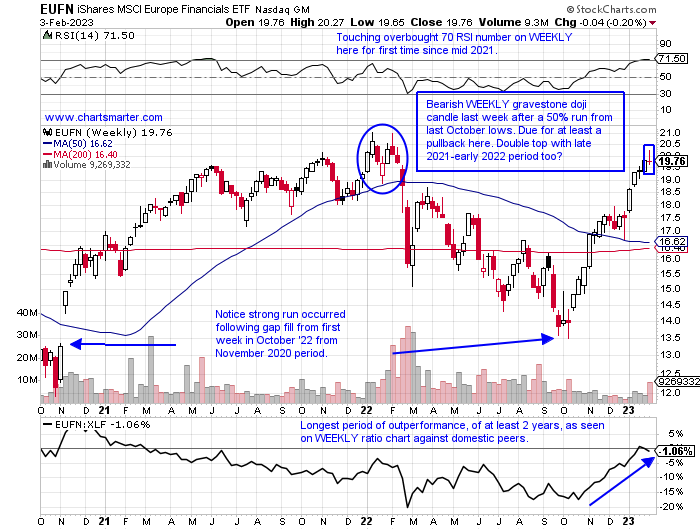
- The old market adage used to go as "America catches a cold the rest of the world sneezes". That may no longer be the case as international benchmarks have behaved a lot better than our domestic ones. The CAC last week busted above a bull flag above 7100 last Thursday and followed through nicely Friday for example. In Germany, the DAX did the same with support inside the flag at the very round 15000 number. If we were to peer at their financial names as viewed on the chart below of the EUFN, they may be ready for a bit of retreat, however. Doji candles are adept at forecasting changes in the prevailing direction and one was recorded last week after a very spirited run higher of 50% and occurred at the very round 20 number too. WEEKLY volume was the heaviest it has been in 4 months and it CLOSED right on lows for the WEEKLY range. Perhaps its time for a little mean reversion as the XLF has just broken above a bullish WEEKLY inverse head and shoulders pivot of 36 which carries a measured move to 42 which would achieve all-time highs.

Size Matters:
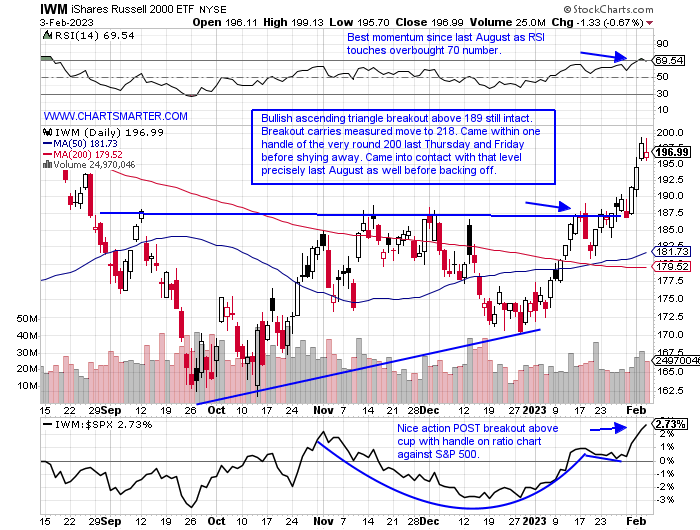
- The strength in small caps is a good leading indicator for "risk on" and the overall markets too. Technology being dominant is obviously bullish too. So far on a YTD basis, the Nasdaq is higher by 14.7%, far outshining the Dow and S&P 500 which have gained 2.3 and 7.7% in 2023. Below is the chart of the IWM, representing the Russell 2000 and it has put up a very respectable advance of 12.7%. Its strength is an excellent sign as its top three sector weightings are healthcare, financials, and industrials, which illustrate a broadening out of the rally, backing up the technology anchor. Bears are all too familiar with the reversal the week ending 11/5/21 that surged 6% out of a flat base pattern 8 months in duration. And that was preceded by an uptrend between the weeks ending 3/27/20-3/12/21 that screamed higher by 144.1% as it fell just 18 weeks in that nearly one-year-long period. The bulls are in control following the very taut 3-week period with the weeks ending 12/16-30/22 all CLOSING amazingly within just three pennies of each other. We know that type of tight action leads to explosive moves. Above 200 this can get going again in a robust manner.

Addicted To Cash?
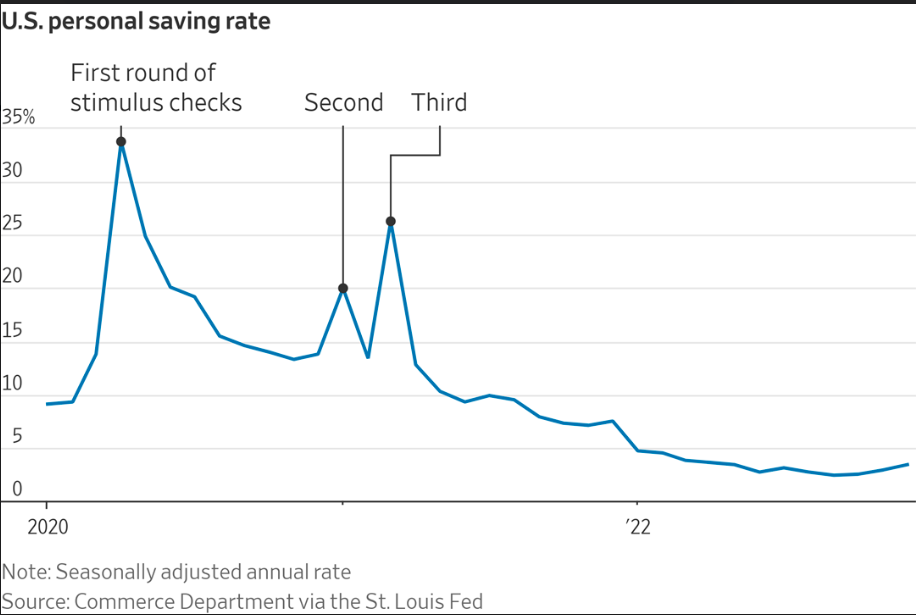
- Is the consumer on life support? The chart below of the US personal savings rate suggests there is not much of a pulse. Is the typical American shopper reliant upon a steady stream of stimulus? Now I do not have credit card data in front of me and I would not be surprised to see that stat elevated. But it was not a shock to see one of the best-performing major S&P sectors in 2020 was the XLY, higher by 33% making it the second-best major S&P sector, and again in 2021 it produced another healthy gain of 25% as two more stimulus checks arrived, making the consumer feel flush. Is the market anticipating another round of stimulus checks as the XLY gains, up 17% thus far in 2023, with such a low savings rate here? Or is something rosier in the economic outlook 6 months ahead, or is it just a dead cat bounce? Only time will tell and respect PRICE action as by the time the reason is known it will have already adjusted itself confounding the masses. Some notable moves in individual retail names this week included JWN up 43% after its seemingly 15th time it has been mentioned as a takeover candidate over the last several years. And FLWS posted a blooming earnings reaction Thursday sprouting up 28%, both puns intended, before a nasty bearish engulfing candle Friday.

"Depositing" Gains:
- Over the last 6 month period, and not long before the major October low, only 2 major S&P sectors are higher by more than double digits. One is the out-of-favor energy group, and the other is the improving financials with the XLF up 10.3%. The diverse group is seeing a niche space emerge as a leader in investment services. On the chart below comparing the IAI, XLF, and KRE one can see how the IAI from the beginning of Q4 has been leading (the red line). Leaders within include IBKR which on its WEEKLY chart cleared a triple top at the round 80 number convincingly. AMP has CLOSED the last 6 weeks up and all finished at or very close to the top of the WEEKLY range and is now acting well POST breakout above a double bottom pivot of 333.60. MS is looking to CLOSE above the very round-par number on its WEEKLY chart, and GS is getting its groove back just above the intraday highs from the 1/17 session that fell 6.4% following its latest earnings reaction. Let's also take a look below at a couple of names in the arena in AXP and SF.

American Express:
- Credit services play up 21% YTD and down 3% over last one year period. Dividend yield of 1.2%.
- Name 10% off most recent 52-week highs and could travel to very round 200 number as on WEEKLY chart would be near highs made one year ago. Last 2 weeks up a combined 18%, with both in best WEEKLY volume in last 11 months.
- Earnings mixed up 10.5 and 1.9% on 1/27 and 7/22 and losses of 1.7 and 2.8% on 10/21 and 4/22.
- Enter on pullback into breakaway gap.
- Entry AXP 175. Stop 168.

Stifel Financial:
- Investment services play up 16% YTD and down 11% over last one year period. Dividend yield of 2.1%.
- Name 19% off most recent 52-week highs and good follow-through this week up 1.2% after prior week jumped by more than 10%. Last week REPORTING earnings rose by 17.6% ending 10/28.
- Earnings mostly higher up 4.5, 2.6, and 2.4% on 1/25, 10/26, and 4/27, and fell 1.1% on 7/27.
- Enter on pullback into WEEKLY inverse head and shoulders breakout.
- Entry SF 66. Stop 63.

Good luck.
This article requires a Chartsmarter membership. Please click here to join.
“There are always two parties, the establishment, and the movement.” Ralph Waldo Emerson
Round Number Abundance:
- Consider the bears as the establishment and the bulls as the movement. In 2023 technology bulls have taken the baton and it is crucial that they do not fumble it. The round numbers were popping up ubiquitously last week. In some of the bigger names META and TSLA were stopped at the very round 200 number, as were some other less followed plays like JBHT and FIVE. Others in tech include GOOGL which may look to fill the gap near par next week. Below is the chart of the QQQ and it may look to retrace back toward 300 next week before another possible leg up, as a breakout above an ascending triangle just below the round figure may provide some comfort. Keep in mind most breakouts are retested, but bulls do not want breakouts to linger back near the pivot point as that would be a red flag. An undercut of that 295 area would be considered a bear trap and a very sinister development, but for the first time in a while, it feels like the burden of proof is on the bears. Inside technology AAPL being a component in the PRICE-weighted DOW may have contributed to its holding up better than the Nasdaq until the start of 2023 as it comprised just 3% index (interesting that MSFT is now the top holding in the QQQ barely edging out AAPL at almost 12%, nearly 4 times the influence that it has on the Dow).

Europe Ailing?
- The old market adage used to go as "America catches a cold the rest of the world sneezes". That may no longer be the case as international benchmarks have behaved a lot better than our domestic ones. The CAC last week busted above a bull flag above 7100 last Thursday and followed through nicely Friday for example. In Germany, the DAX did the same with support inside the flag at the very round 15000 number. If we were to peer at their financial names as viewed on the chart below of the EUFN, they may be ready for a bit of retreat, however. Doji candles are adept at forecasting changes in the prevailing direction and one was recorded last week after a very spirited run higher of 50% and occurred at the very round 20 number too. WEEKLY volume was the heaviest it has been in 4 months and it CLOSED right on lows for the WEEKLY range. Perhaps its time for a little mean reversion as the XLF has just broken above a bullish WEEKLY inverse head and shoulders pivot of 36 which carries a measured move to 42 which would achieve all-time highs.

Size Matters:
- The strength in small caps is a good leading indicator for "risk on" and the overall markets too. Technology being dominant is obviously bullish too. So far on a YTD basis, the Nasdaq is higher by 14.7%, far outshining the Dow and S&P 500 which have gained 2.3 and 7.7% in 2023. Below is the chart of the IWM, representing the Russell 2000 and it has put up a very respectable advance of 12.7%. Its strength is an excellent sign as its top three sector weightings are healthcare, financials, and industrials, which illustrate a broadening out of the rally, backing up the technology anchor. Bears are all too familiar with the reversal the week ending 11/5/21 that surged 6% out of a flat base pattern 8 months in duration. And that was preceded by an uptrend between the weeks ending 3/27/20-3/12/21 that screamed higher by 144.1% as it fell just 18 weeks in that nearly one-year-long period. The bulls are in control following the very taut 3-week period with the weeks ending 12/16-30/22 all CLOSING amazingly within just three pennies of each other. We know that type of tight action leads to explosive moves. Above 200 this can get going again in a robust manner.

Addicted To Cash?
- Is the consumer on life support? The chart below of the US personal savings rate suggests there is not much of a pulse. Is the typical American shopper reliant upon a steady stream of stimulus? Now I do not have credit card data in front of me and I would not be surprised to see that stat elevated. But it was not a shock to see one of the best-performing major S&P sectors in 2020 was the XLY, higher by 33% making it the second-best major S&P sector, and again in 2021 it produced another healthy gain of 25% as two more stimulus checks arrived, making the consumer feel flush. Is the market anticipating another round of stimulus checks as the XLY gains, up 17% thus far in 2023, with such a low savings rate here? Or is something rosier in the economic outlook 6 months ahead, or is it just a dead cat bounce? Only time will tell and respect PRICE action as by the time the reason is known it will have already adjusted itself confounding the masses. Some notable moves in individual retail names this week included JWN up 43% after its seemingly 15th time it has been mentioned as a takeover candidate over the last several years. And FLWS posted a blooming earnings reaction Thursday sprouting up 28%, both puns intended, before a nasty bearish engulfing candle Friday.

"Depositing" Gains:
- Over the last 6 month period, and not long before the major October low, only 2 major S&P sectors are higher by more than double digits. One is the out-of-favor energy group, and the other is the improving financials with the XLF up 10.3%. The diverse group is seeing a niche space emerge as a leader in investment services. On the chart below comparing the IAI, XLF, and KRE one can see how the IAI from the beginning of Q4 has been leading (the red line). Leaders within include IBKR which on its WEEKLY chart cleared a triple top at the round 80 number convincingly. AMP has CLOSED the last 6 weeks up and all finished at or very close to the top of the WEEKLY range and is now acting well POST breakout above a double bottom pivot of 333.60. MS is looking to CLOSE above the very round-par number on its WEEKLY chart, and GS is getting its groove back just above the intraday highs from the 1/17 session that fell 6.4% following its latest earnings reaction. Let's also take a look below at a couple of names in the arena in AXP and SF.

American Express:
- Credit services play up 21% YTD and down 3% over last one year period. Dividend yield of 1.2%.
- Name 10% off most recent 52-week highs and could travel to very round 200 number as on WEEKLY chart would be near highs made one year ago. Last 2 weeks up a combined 18%, with both in best WEEKLY volume in last 11 months.
- Earnings mixed up 10.5 and 1.9% on 1/27 and 7/22 and losses of 1.7 and 2.8% on 10/21 and 4/22.
- Enter on pullback into breakaway gap.
- Entry AXP 175. Stop 168.

Stifel Financial:
- Investment services play up 16% YTD and down 11% over last one year period. Dividend yield of 2.1%.
- Name 19% off most recent 52-week highs and good follow-through this week up 1.2% after prior week jumped by more than 10%. Last week REPORTING earnings rose by 17.6% ending 10/28.
- Earnings mostly higher up 4.5, 2.6, and 2.4% on 1/25, 10/26, and 4/27, and fell 1.1% on 7/27.
- Enter on pullback into WEEKLY inverse head and shoulders breakout.
- Entry SF 66. Stop 63.

Good luck.