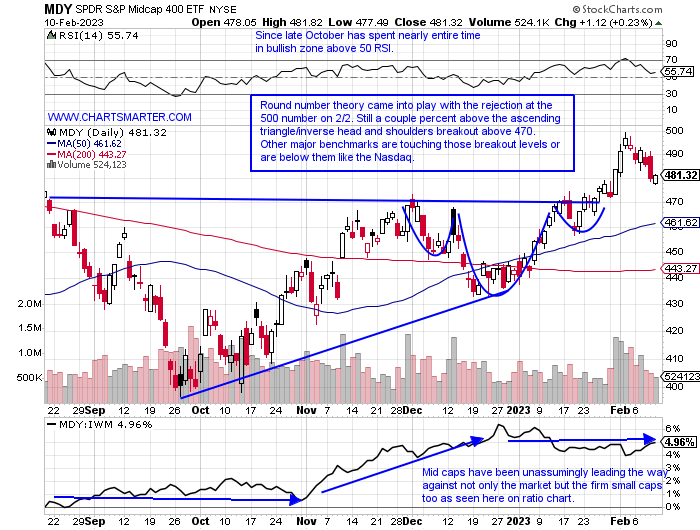
Size Matters:
- As many focus on the muscle of the small caps, and deservedly so, the mid-caps have been quietly leading the way. The chart below of the MDY shows its vigor and it's the only one of the major indexes that have not come back to test the highs previously made last September, November, and December. That relative strength must be applauded and respected. From a pure PRICE distance from where it is trading from its most recent 52-week high at just 5%, that compares very favorably with the IWM at 10%, the S&P 500 at 12%, and Nasdaq at 20% from their own annual peaks. Its WEEKLY chart looked similar to the classic flat base breakout of the IWM back in late 2021, but the MDY actually broke above that same pattern the week ending 10/22/21, two weeks before the IWM. A couple of individual names in the mid-cap arena that should be paid close attention to are FLS which Friday blasted above a bull flag pivot of 35 on Friday, and NEWR, a software name attempting to recapture best-in-breed status, jumping 18.5% on 2/8 recording a breakaway gap after its third straight meaningful earnings reaction.
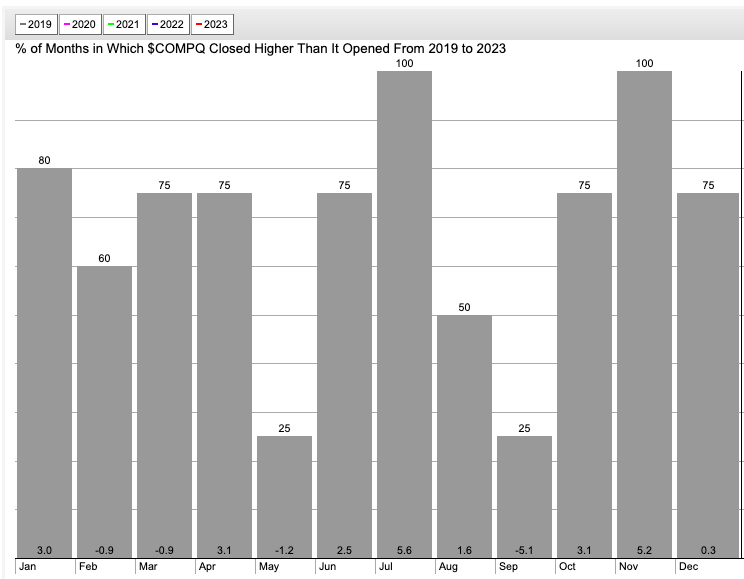
Seasonality Slowdown:
- January was true to form rising like it has 4 of the last 5 years but last month skewed the data somewhat for sure with the Nasdaq advancing more than 10% (much different than the 7% haircut the tech-heavy benchmark fell in January 2022), its strongest January in more than 20 years. The seasonality chart below over the last 4-5 years shows how February and March are the only back-to-back months that show average MONTHLY losses, albeit marginally both by .9% (notice the best month during this time period has been in the supposed summer doldrum July up nearly 6%). After a gigantic run, some digestion could be just what the doctor ordered. A little rest and relaxation this February-March could give technology the rest and stamina for its traditional April-July run. Bears would declare that it should not need tranquility after already falling 8 of the last 13 months, but bulls would state the drop from 16000 in November 2021 that recorded a bearish gravestone doji MONTHLY candle at all-time highs has paid its dues in the penalty box.
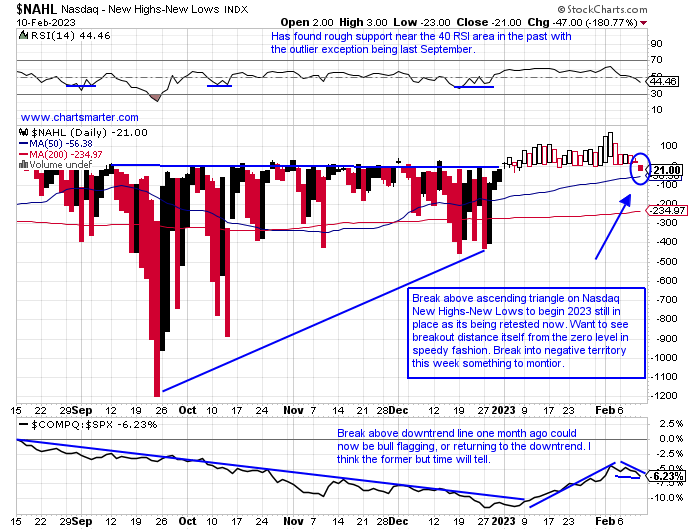
Shot Across The Bow?
- The Nasdaq recorded a very powerful run in 2023, so a prudent pullback was a welcoming development. With the recency bias of the nasty overall downtrend still fresh in market participants' minds, bailing out at the first sign of fragility would be understandable. The chart below of the Nasdaq New Highs New Lows shows the break above the ascending triangle turning back into negative ground this week, but it could be temporary. Keep in mind it is normal for a breakout to be retested, but it wants to reestablish its vigor very quickly. The old adage comes to mind "if the train that has taken off comes back to the station there is most likely something wrong with the train". This past week looking at tech names that made new 52-week highs include prominent semiconductor names like ADI CRUS LSCC and RMBS and new issues like ALGM and MBLY. New 52-week lows in anything relevant on the Nasdaq were hard to come by. The semis need some help as they have been carrying much of the load in recent months.
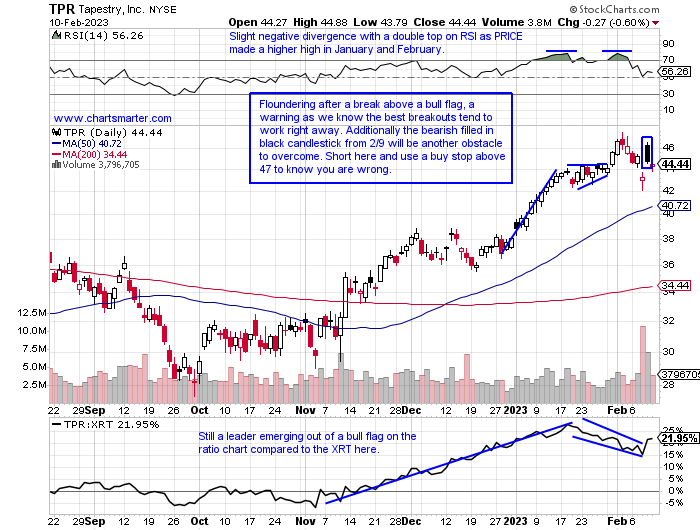
Wealthy Warning?
- With earnings coming in fast and furious these days some luxury retail names were hit pretty hard. Is this canary in the coal mine for retail as if the affluent consumer is pulling back, what does that say about the rest? Or are they downsizing and shopping into TGT which has seen a bounce of 40 handles recently? Or is it just a management or operational issue with laggards? GOOS may not have been that surprising when it plummeted by 23.7% on 2/2 as it rose just 18 weeks between November '21-November '22, but CPRI, a name with a prior good-looking chart fell by nearly the exact same amount on 2/8. Keep in mind LULU slipped 13% on 12/9 as well. JWN was in the news recently about a takeover for the umpteenth time jumping 25% on 2/3 but REPORTS on 3/2 after the close and has fallen 9 of its last 12 times after releasing numbers (it has now filled in the gap from the 2/2 session). But looking at some other names that REPORTED, TPR rose 3.5% on 2/9 registering its sixth consecutive positive reaction. Its chart has a few technical flaws and it could be ripe for a pullback. European luxury for the time being is shrugging off domestic weakness with examples in LVMH, Kering, Burberry, and Hermes.
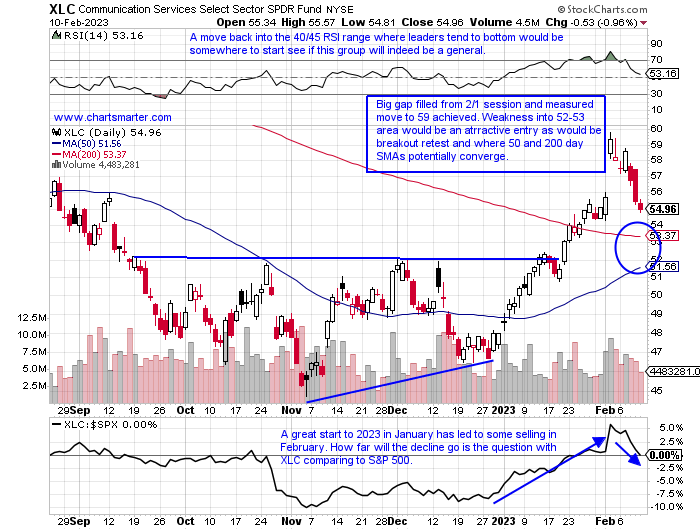
Opportunity Or Setback?
- Of course, only truly finds this out in hindsight but with technical analysis, we can make decisions with good risk/reward scenarios. The XLC shot out of the gate in 2023 like most other major S&P sectors, but its action was the creme of the crop. It still is the 2nd best of 11 on a YTD basis up 14.5%, but last week was easily the worst lower by almost 6%, almost tripling its next closest competitor in the XLY which was off 2%. Most of the damage was done by GOOGL down 10% in an ugly WEEKLY reversal, although the last time it cratered down that hard the week ending 11/4/22, it jumped by 11% the very next week. PINS fell 9% last week putting nice WEEKLY bottoming action in jeopardy. META has the real possibility of filling in its earnings gap a bit more than 10% from here from the 2/1 session. Advantage bulls with the onus of proof falling on bears to see if this downtrend is ready to resume its leg lower as long as it remains above the 52-53 levels. Let's take a look further below at a couple of shorts in the space.
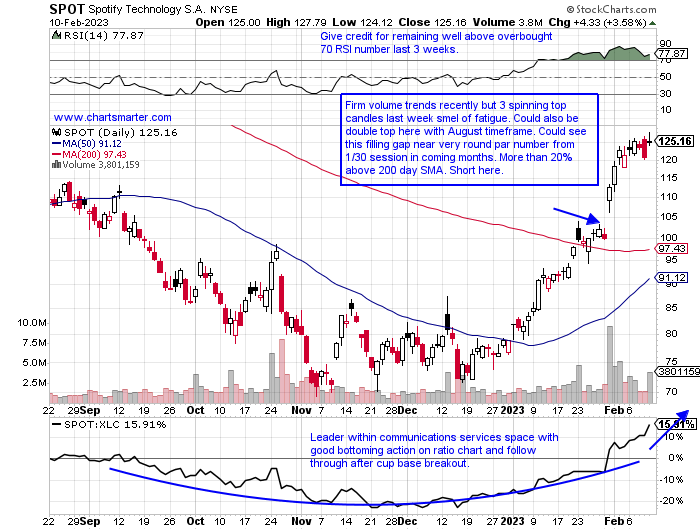
Spotify:
- Internet play up 59% YTD and lower by 29% over last one year period.
- Name 27% off most recent 52-week highs and respect 8-week winning streak but last week recorded spinning top candle and is into 125 area which was resistance last August, but support throughout 2019 and early 2020.
- Earnings mixed with gains of 12.7 and 12.2% on 1/31 and 7/27 and fell 13 and 12.4% on 10/26 and 4/27/22.
- Enter short after multiple spinning top candles.
- Entry SPOT here. Buy stop 129.
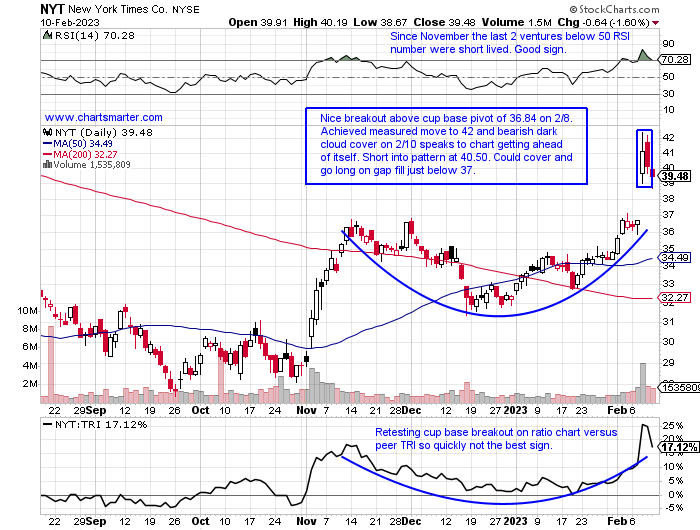
New York Times:
- Media play up 22% YTD and lower by 4% over last one year period. Dividend yield of 1.1%.
- Name 17% off most recent 52-week highs and on 3-week winning streak, but actually prefer TRI just 1% off 52-week highs, on 7 week win streak, and just below 15 month WEEKLY cup base pivot.
- Earnings mostly higher up 12, 7.4, and 1.6% on 2/8, 11/2 and 5/4 and fell 1.1% on 8/3.
- Enter short into bearish dark cloud cover candle.
- Entry NYT 40.50. Buy stop 42.25.
Good luck.
This article requires a Chartsmarter membership. Please click here to join.
Size Matters:
- As many focus on the muscle of the small caps, and deservedly so, the mid-caps have been quietly leading the way. The chart below of the MDY shows its vigor and it's the only one of the major indexes that have not come back to test the highs previously made last September, November, and December. That relative strength must be applauded and respected. From a pure PRICE distance from where it is trading from its most recent 52-week high at just 5%, that compares very favorably with the IWM at 10%, the S&P 500 at 12%, and Nasdaq at 20% from their own annual peaks. Its WEEKLY chart looked similar to the classic flat base breakout of the IWM back in late 2021, but the MDY actually broke above that same pattern the week ending 10/22/21, two weeks before the IWM. A couple of individual names in the mid-cap arena that should be paid close attention to are FLS which Friday blasted above a bull flag pivot of 35 on Friday, and NEWR, a software name attempting to recapture best-in-breed status, jumping 18.5% on 2/8 recording a breakaway gap after its third straight meaningful earnings reaction.
Seasonality Slowdown:
- January was true to form rising like it has 4 of the last 5 years but last month skewed the data somewhat for sure with the Nasdaq advancing more than 10% (much different than the 7% haircut the tech-heavy benchmark fell in January 2022), its strongest January in more than 20 years. The seasonality chart below over the last 4-5 years shows how February and March are the only back-to-back months that show average MONTHLY losses, albeit marginally both by .9% (notice the best month during this time period has been in the supposed summer doldrum July up nearly 6%). After a gigantic run, some digestion could be just what the doctor ordered. A little rest and relaxation this February-March could give technology the rest and stamina for its traditional April-July run. Bears would declare that it should not need tranquility after already falling 8 of the last 13 months, but bulls would state the drop from 16000 in November 2021 that recorded a bearish gravestone doji MONTHLY candle at all-time highs has paid its dues in the penalty box.
Shot Across The Bow?
- The Nasdaq recorded a very powerful run in 2023, so a prudent pullback was a welcoming development. With the recency bias of the nasty overall downtrend still fresh in market participants' minds, bailing out at the first sign of fragility would be understandable. The chart below of the Nasdaq New Highs New Lows shows the break above the ascending triangle turning back into negative ground this week, but it could be temporary. Keep in mind it is normal for a breakout to be retested, but it wants to reestablish its vigor very quickly. The old adage comes to mind "if the train that has taken off comes back to the station there is most likely something wrong with the train". This past week looking at tech names that made new 52-week highs include prominent semiconductor names like ADI CRUS LSCC and RMBS and new issues like ALGM and MBLY. New 52-week lows in anything relevant on the Nasdaq were hard to come by. The semis need some help as they have been carrying much of the load in recent months.
Wealthy Warning?
- With earnings coming in fast and furious these days some luxury retail names were hit pretty hard. Is this canary in the coal mine for retail as if the affluent consumer is pulling back, what does that say about the rest? Or are they downsizing and shopping into TGT which has seen a bounce of 40 handles recently? Or is it just a management or operational issue with laggards? GOOS may not have been that surprising when it plummeted by 23.7% on 2/2 as it rose just 18 weeks between November '21-November '22, but CPRI, a name with a prior good-looking chart fell by nearly the exact same amount on 2/8. Keep in mind LULU slipped 13% on 12/9 as well. JWN was in the news recently about a takeover for the umpteenth time jumping 25% on 2/3 but REPORTS on 3/2 after the close and has fallen 9 of its last 12 times after releasing numbers (it has now filled in the gap from the 2/2 session). But looking at some other names that REPORTED, TPR rose 3.5% on 2/9 registering its sixth consecutive positive reaction. Its chart has a few technical flaws and it could be ripe for a pullback. European luxury for the time being is shrugging off domestic weakness with examples in LVMH, Kering, Burberry, and Hermes.
Opportunity Or Setback?
- Of course, only truly finds this out in hindsight but with technical analysis, we can make decisions with good risk/reward scenarios. The XLC shot out of the gate in 2023 like most other major S&P sectors, but its action was the creme of the crop. It still is the 2nd best of 11 on a YTD basis up 14.5%, but last week was easily the worst lower by almost 6%, almost tripling its next closest competitor in the XLY which was off 2%. Most of the damage was done by GOOGL down 10% in an ugly WEEKLY reversal, although the last time it cratered down that hard the week ending 11/4/22, it jumped by 11% the very next week. PINS fell 9% last week putting nice WEEKLY bottoming action in jeopardy. META has the real possibility of filling in its earnings gap a bit more than 10% from here from the 2/1 session. Advantage bulls with the onus of proof falling on bears to see if this downtrend is ready to resume its leg lower as long as it remains above the 52-53 levels. Let's take a look further below at a couple of shorts in the space.
Spotify:
- Internet play up 59% YTD and lower by 29% over last one year period.
- Name 27% off most recent 52-week highs and respect 8-week winning streak but last week recorded spinning top candle and is into 125 area which was resistance last August, but support throughout 2019 and early 2020.
- Earnings mixed with gains of 12.7 and 12.2% on 1/31 and 7/27 and fell 13 and 12.4% on 10/26 and 4/27/22.
- Enter short after multiple spinning top candles.
- Entry SPOT here. Buy stop 129.
New York Times:
- Media play up 22% YTD and lower by 4% over last one year period. Dividend yield of 1.1%.
- Name 17% off most recent 52-week highs and on 3-week winning streak, but actually prefer TRI just 1% off 52-week highs, on 7 week win streak, and just below 15 month WEEKLY cup base pivot.
- Earnings mostly higher up 12, 7.4, and 1.6% on 2/8, 11/2 and 5/4 and fell 1.1% on 8/3.
- Enter short into bearish dark cloud cover candle.
- Entry NYT 40.50. Buy stop 42.25.
Good luck.