"Do not worry about catching bottoms. Only liars do." -Unknown
Nasdaq Regains Its Composure:
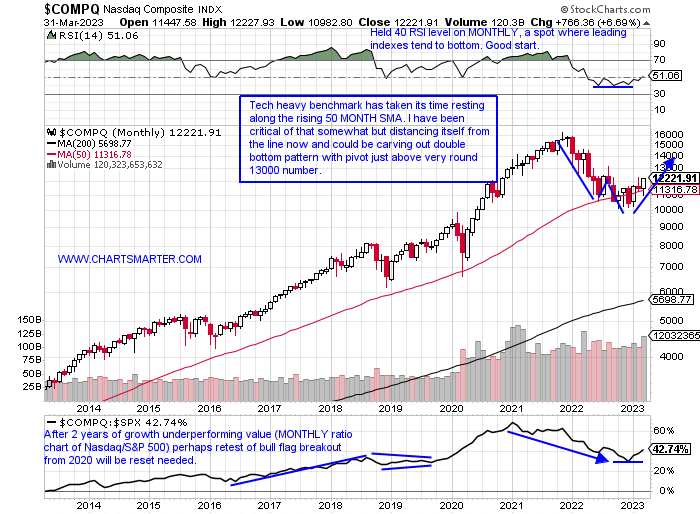
- After a dismal 2022 for the Nasdaq which saw the tech-heavy benchmark lose more than 30%, and the XLK fell more than the S&P 500, ending an 8-year streak. Of course, Friday not only produced a MONTHLY CLOSE, but a quarterly one as well. The last 5 months have been a pattern of one up and one down, but give credit to the last 3 advancers all CLOSING at tops for the MONTHLY range. The Nasdaq roared to begin 2023 with an 11% jump, its best in more than 20 years, and bears salivated when February did not see any follow-through. March was pivotal to see which way this was going to break and the bulls stepped up in fine form, with the benchmark up nearly 7% crushing the S&P 500 and Dow which rose by 3.5 and 1.9% respectively. Round number theory has played a role with 10000 holding last October, and 11000 figure on 3/13 and 12000 was taken out to the upside like a hot knife through butter Friday and taking out a double bottom with handle pivot in the process. 13000 which was a roadblock last August looks like a likely target in the neat term.
Got Junk?
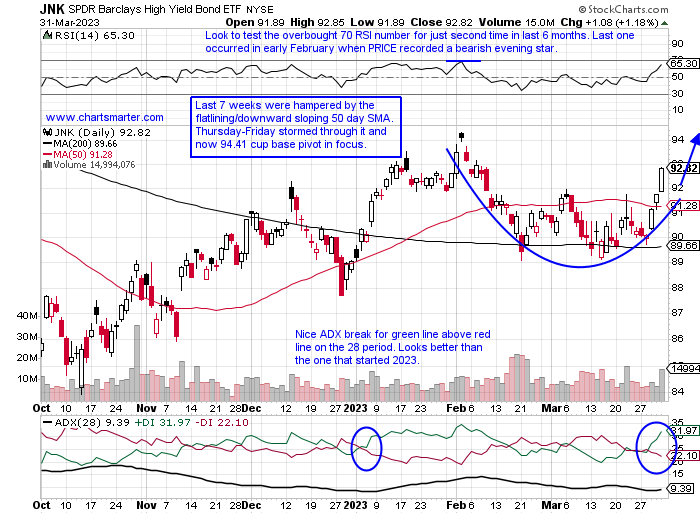
- There are a plethora of ways to gauge "risk-on" within equity markets. In recognizable sectors like consumer, one can judge this by looking at the ratio chart of discretionary versus staples. In healthcare, one can contrast the biotech XBI with the more conservative XLV. Overall the stock/bond ratio peering at the TLT:SPY may do the trick. But the chart below of the JNK can also be a valuable tool. Last week it recaptured its 50-day SMA and its chart has the look of nice rounded bottoming action with the very round 90 number acting as a floor during the first quarter. The ETF jumped nearly 3% last week, its best WEEKLY gain since the week ending 10/28/22 which was accompanied by the largest WEEKLY volume in the last 10 months. Big WEEKLY moves need to see follow through as the week ending 5/27/22 added 4.8% only to see the next 3 weeks slump 10%. Looking further out on its WEEKLY chart the 94 level is not only important on the daily chart here, but on the WEEKLY chart that is the neckline in a bullish inverted head and shoulders pattern. A break above there would carry a measured move to 104.
Doctor Appointment:
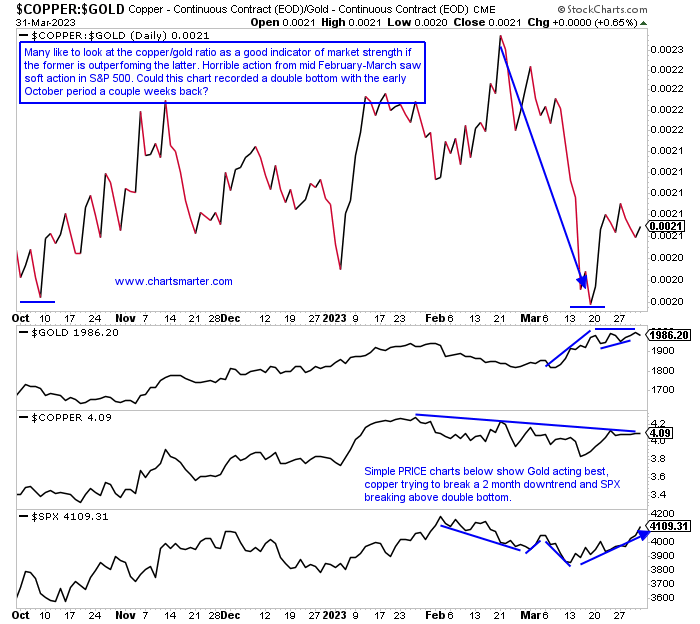
- Copper is often referred to as a doctor as it tends to have a genuine feel for the overall health of the economy. And keep in mind it is not just a reflection of our own domestic economy but that of China, which still obviously has a profound effect on global growth. Gold of course has been dominating headlines for good reason as it attempts to break above the bull flag formation at the very round 2000 number (since 3/20 it has been above the figure FIVE times intraday but recorded zero CLOSES above 2000). Many like to watch the ratio chart below comparing Copper to Gold as markets tend to act better when the former is outperforming. Notice the surge for Copper against Gold in the first 3 weeks of 2023, which corresponded to a very healthy overall market return. Not surprisingly the mid-February-March period was heavily in favor of Gold and the market was a bit wobbly. Copper may have made a stand a couple of weeks back and stemmed the tide with a possible double bottom.
Remember The Industrials?
- Everyone is shouting off their rooftops this weekend about the strong finish to the end of Q1 (and keep in mind this is with market participants moving into cash at the most rapid rate since COVID). And technology has been front and center but if one wants to look back on the previous quarter when the overall market bottomed early last October, the economically-sensitive industrials have flourished. They have kind of been lost in the mix, but they are the second-best major S&P sector actor, sandwiched between technology and communication services, with the XLI jumping more than 23% over the time period. This group has been very resilient, and as far as all 11 major S&P sector ETFs, the XLI is easily the nearest to its most recent 52-week highs just 3% from it. Only 2 others are single digits away from theirs with the XLK and XLP 7 and 8% respectively from their own annual peaks. Large-cap names are doing their part with FDX and BA technically sound (ERJ is quickly building the right side of a long WEEKLY cup base too). Railroads continue to lag curiously.
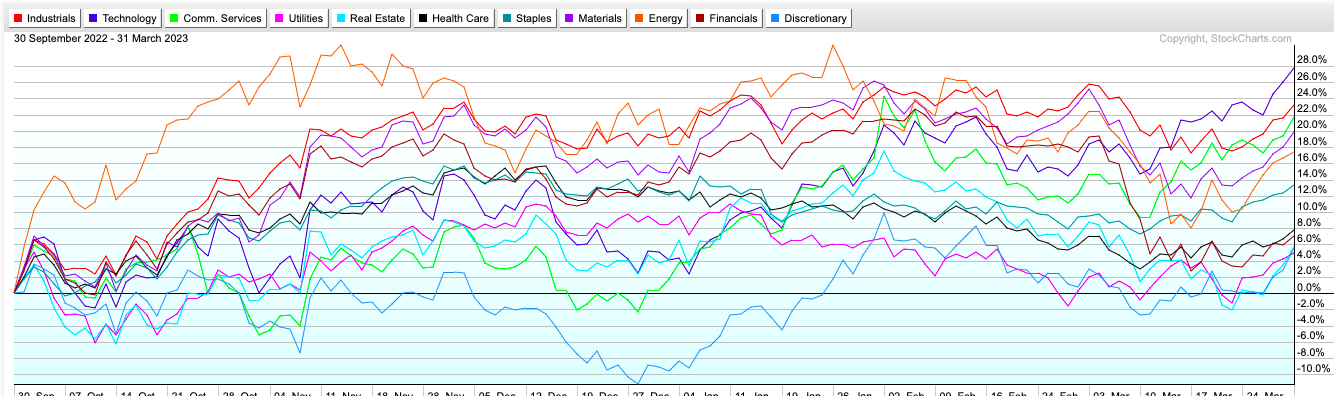
Photo Finish:
- Friday capped off a volatile Q1 for 2023 with the XLK and XLC going down to the wire with technology edging out the win by a nose, up 21.6% compared to the XLC adding 21.1%. These 2 groups are essentially the same as internet was the largest contributor to the communication services space gains. In that niche space META has continued to act well POST breakout from a 190.46 cup with handle trigger and we know the best breakouts tend to work right away. It has more than doubled since the bullish WEEKLY morning star pattern was completed the week ending 11/11/22. NFLX recaptured its 50-day SMA this week as it rounds out the possible right side of a cup base, and the last 2 weeks have demonstrated good relative strength the week ending 3/24 up 8.2% as the XLC added 3%, and again last week rising 5.2% with the XLC up 2.3%. We spoke of this group in our last WEEK AHEAD Note and if strength continues will be the focus a lot more. Let's take a look below at a couple of tech/communication services names, with one long and one short.
Hewlett Packard Enterprises:
- Communication services name UNCH YTD and lower by 5% over last one year period. Dividend yield of 3%.
- Name 8% off most recent 52-week highs and jumped 11.5% this week, its best WEEKLY advance since the week ending 6/5/20. MONTHLY chart a beautiful bullish hammer candle in strongest volume in nearly 3 years.
- Earnings reactions mostly lower off 1.4, .4 and 5.2% on 3/3, 8/31, and 6/2/22 and rose 8.5% on 11/30/22.
- Enter on pullback into rising 50-day SMA.
- Entry HPE 15.50. Stop 14.75.
Square:
- Software name up 9% YTD and lower by 49% over last one year period.
- Name 53% off most recent 52-week highs and give credit for a nice bounce this week up 13% as IGV added 4.7%. Think someone was tipped off by Hindenberg Note early as the week ending 3/10 slumped 12.2%, more than double the IGV drop of 5.7%.
- Earnings reactions mostly higher up 4.3, 11.5, and .7% on 2/24, 11/4, and 5/6/22, and fell 2.2% on 8/5/22.
- Enter short into gap fill.
- Entry SQ 70.25. Buy stop 76.
Good luck.
This article requires a Chartsmarter membership. Please click here to join.
"Do not worry about catching bottoms. Only liars do." -Unknown
Nasdaq Regains Its Composure:
- After a dismal 2022 for the Nasdaq which saw the tech-heavy benchmark lose more than 30%, and the XLK fell more than the S&P 500, ending an 8-year streak. Of course, Friday not only produced a MONTHLY CLOSE, but a quarterly one as well. The last 5 months have been a pattern of one up and one down, but give credit to the last 3 advancers all CLOSING at tops for the MONTHLY range. The Nasdaq roared to begin 2023 with an 11% jump, its best in more than 20 years, and bears salivated when February did not see any follow-through. March was pivotal to see which way this was going to break and the bulls stepped up in fine form, with the benchmark up nearly 7% crushing the S&P 500 and Dow which rose by 3.5 and 1.9% respectively. Round number theory has played a role with 10000 holding last October, and 11000 figure on 3/13 and 12000 was taken out to the upside like a hot knife through butter Friday and taking out a double bottom with handle pivot in the process. 13000 which was a roadblock last August looks like a likely target in the neat term.
Got Junk?
- There are a plethora of ways to gauge "risk-on" within equity markets. In recognizable sectors like consumer, one can judge this by looking at the ratio chart of discretionary versus staples. In healthcare, one can contrast the biotech XBI with the more conservative XLV. Overall the stock/bond ratio peering at the TLT:SPY may do the trick. But the chart below of the JNK can also be a valuable tool. Last week it recaptured its 50-day SMA and its chart has the look of nice rounded bottoming action with the very round 90 number acting as a floor during the first quarter. The ETF jumped nearly 3% last week, its best WEEKLY gain since the week ending 10/28/22 which was accompanied by the largest WEEKLY volume in the last 10 months. Big WEEKLY moves need to see follow through as the week ending 5/27/22 added 4.8% only to see the next 3 weeks slump 10%. Looking further out on its WEEKLY chart the 94 level is not only important on the daily chart here, but on the WEEKLY chart that is the neckline in a bullish inverted head and shoulders pattern. A break above there would carry a measured move to 104.
Doctor Appointment:
- Copper is often referred to as a doctor as it tends to have a genuine feel for the overall health of the economy. And keep in mind it is not just a reflection of our own domestic economy but that of China, which still obviously has a profound effect on global growth. Gold of course has been dominating headlines for good reason as it attempts to break above the bull flag formation at the very round 2000 number (since 3/20 it has been above the figure FIVE times intraday but recorded zero CLOSES above 2000). Many like to watch the ratio chart below comparing Copper to Gold as markets tend to act better when the former is outperforming. Notice the surge for Copper against Gold in the first 3 weeks of 2023, which corresponded to a very healthy overall market return. Not surprisingly the mid-February-March period was heavily in favor of Gold and the market was a bit wobbly. Copper may have made a stand a couple of weeks back and stemmed the tide with a possible double bottom.
Remember The Industrials?
- Everyone is shouting off their rooftops this weekend about the strong finish to the end of Q1 (and keep in mind this is with market participants moving into cash at the most rapid rate since COVID). And technology has been front and center but if one wants to look back on the previous quarter when the overall market bottomed early last October, the economically-sensitive industrials have flourished. They have kind of been lost in the mix, but they are the second-best major S&P sector actor, sandwiched between technology and communication services, with the XLI jumping more than 23% over the time period. This group has been very resilient, and as far as all 11 major S&P sector ETFs, the XLI is easily the nearest to its most recent 52-week highs just 3% from it. Only 2 others are single digits away from theirs with the XLK and XLP 7 and 8% respectively from their own annual peaks. Large-cap names are doing their part with FDX and BA technically sound (ERJ is quickly building the right side of a long WEEKLY cup base too). Railroads continue to lag curiously.
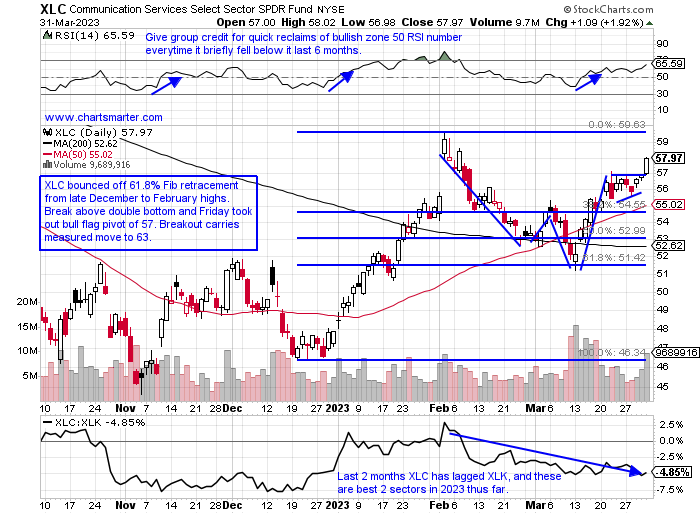
Photo Finish:
- Friday capped off a volatile Q1 for 2023 with the XLK and XLC going down to the wire with technology edging out the win by a nose, up 21.6% compared to the XLC adding 21.1%. These 2 groups are essentially the same as internet was the largest contributor to the communication services space gains. In that niche space META has continued to act well POST breakout from a 190.46 cup with handle trigger and we know the best breakouts tend to work right away. It has more than doubled since the bullish WEEKLY morning star pattern was completed the week ending 11/11/22. NFLX recaptured its 50-day SMA this week as it rounds out the possible right side of a cup base, and the last 2 weeks have demonstrated good relative strength the week ending 3/24 up 8.2% as the XLC added 3%, and again last week rising 5.2% with the XLC up 2.3%. We spoke of this group in our last WEEK AHEAD Note and if strength continues will be the focus a lot more. Let's take a look below at a couple of tech/communication services names, with one long and one short.
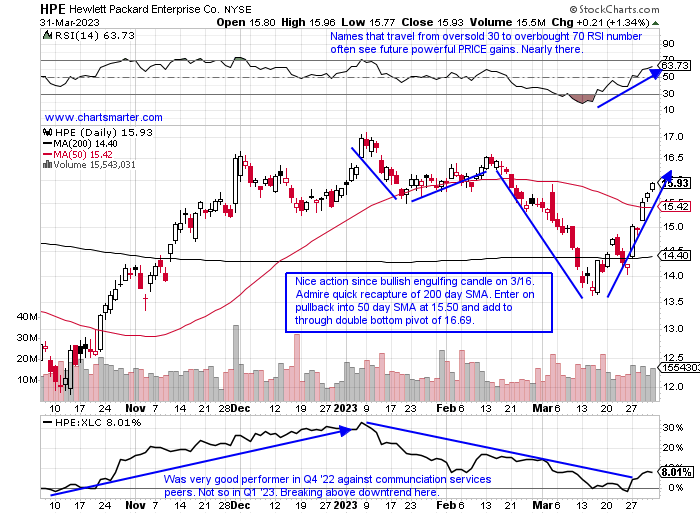
Hewlett Packard Enterprises:
- Communication services name UNCH YTD and lower by 5% over last one year period. Dividend yield of 3%.
- Name 8% off most recent 52-week highs and jumped 11.5% this week, its best WEEKLY advance since the week ending 6/5/20. MONTHLY chart a beautiful bullish hammer candle in strongest volume in nearly 3 years.
- Earnings reactions mostly lower off 1.4, .4 and 5.2% on 3/3, 8/31, and 6/2/22 and rose 8.5% on 11/30/22.
- Enter on pullback into rising 50-day SMA.
- Entry HPE 15.50. Stop 14.75.
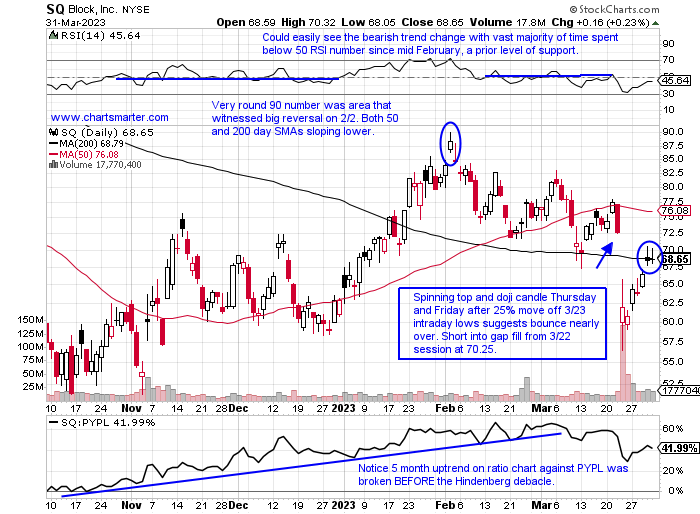
Square:
- Software name up 9% YTD and lower by 49% over last one year period.
- Name 53% off most recent 52-week highs and give credit for a nice bounce this week up 13% as IGV added 4.7%. Think someone was tipped off by Hindenberg Note early as the week ending 3/10 slumped 12.2%, more than double the IGV drop of 5.7%.
- Earnings reactions mostly higher up 4.3, 11.5, and .7% on 2/24, 11/4, and 5/6/22, and fell 2.2% on 8/5/22.
- Enter short into gap fill.
- Entry SQ 70.25. Buy stop 76.
Good luck.