"Muddy water is best cleared by leaving it alone." Alan Watts
Participation Problems?
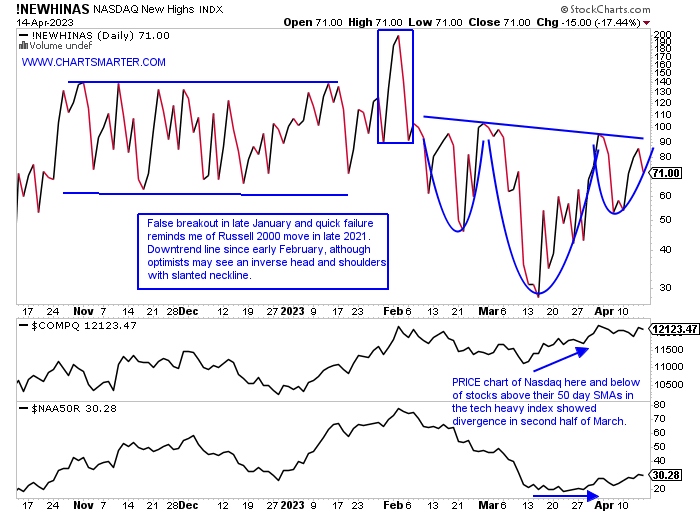
- Some internals is looking dubious from the market leader in the Nasdaq which is higher by 16% YTD (compared with the S&P 500 up 8, Dow by 2, and Russell 2000 by 1%). May the near future see some mean reversion? Last week witnessed some softness in the SMH with its softest WEEKLY performance of 2023 down 4.2%. That was in stark contrast to software rising by .5% (we wrote about this in a recent tech note). Looking below the chart of the Nasdaq New Highs shows a downtrend in motion that is 2 months long now. Stocks above their 50-day SMAs are hovering near an unhealthy 30%. Overall PRICE action has to be admired however with little technical damage done even though the benchmark has advanced just 2 days in the last 2 weeks. Couple that with a WEEKLY loss of less than 1%, after the prior 3 weeks gained 10% and it feels like the bulls are still in charge. Would more participation be welcomed? Of course, it would but bulls and bears have justification for their themes as the bears would say bearish harami cross Friday. Bulls would state the index is holding its rising 21-day EMA for the last month.
Time To Start Worrying About Yields Again?
- Interest rates perked up last week and that has a myriad of implications. It put a bid under the banks, as the XLF was the best performing major S&P sector Friday and over the last one week period rising almost 3%. Of course, this is coming off a very low bar as the ETF on a YTD basis is still the worst actor off 3.4%. JPM was a contributor with a well-received earnings reaction gaining 7% on 4/14, its best daily gain in at least one year in huge volume (it has acted very well since a move off very round par number last October and a bullish island reversal completed on 3/27 off the rising 200 day SMA). The chart below of the 10-year yield may have bottomed short-term after last week started off with a bullish island reversal of its own. Wednesday and Thursday recorded bullish hammer candles to further the confident narrative. Another ramification of potentially higher rates going forward is a damper on housing stocks. But the ITB does not look unnerved as it added 4% last week and the last four sessions all CLOSED very taut within just .25 of each other.

Energy Bounce:
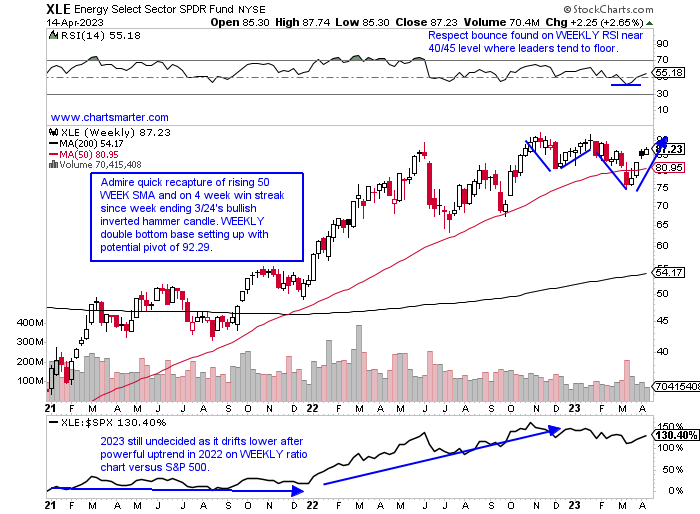
- After many seemed to have written off energy after 2 very firm years in 2021-22, myself in that camp, perhaps many will have to rethink that thesis. I am not yet, but the chart below of the XLE shows some nice technical action. A quick reclaim of a 50-day SMA is what leaders do and the ETF did just that the week ending 3/31 jumping more than 6%. Most "impressive" to me was the absence of any follow-through to the downside after the week ending 3/17 cratered 7% in double average WEEKLY volume and the most firm in the last 10 months. I think the group still has some proving to do with the double bottom pivot forming the week ending 1/27 with a doji candle. Give credit to CVX breaking slightly above a 172 neckline in a bullish inverse head and shoulders formation Friday and XOM with a very rare gap up on 4/3 breaking above a double bottom trigger of 113.94 and now sporting a bull flag. And we know leading stocks very often give opportunities to add onto on the way UP.
Equipment Failure?
- With the nascent excitement in energy, the XLE is the second best of the major S&P sectors of 11 on both a one-week and one-month lookback period, equipment did not seem to get the memo. The OIH is now 14% off the most recent 52-week highs, almost double that of the XLE, and one can see the lag on the ratio chart below compared to the XLE. But all is not lost with the OIH. It did complete a bullish island reversal with the 6% gap up on 4/3, after the gap lower of 7.3% on 3/15 (the 4/3 gap was filled a few sessions later). Playing Monday morning quarterback the canary in the coal mine was the bearish engulfing candle on 1/18 at multi-year highs. If looking to venture in on the long side always stick with the generals. WFRD last week inched above a 64.42 cup with handle pivot. It rose every day last week and has gained 12 of the last 14 sessions. TDW has a similar look but is still below a cup with handle trigger of 48.28.

Nuclear Ambitions, Or Lack Thereof:
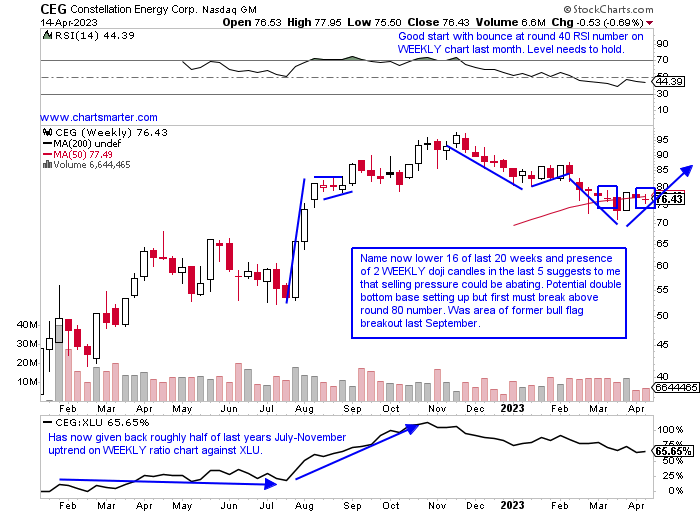
- With the bulk of the news surrounding Germany's becoming nuclear-free this weekend, I thought it was a good time to review some stocks that are dependent on the space. In my belief, this will be a major factor going forward in being a valuable global energy source. We will take a look at Cameco and BWX Technologies later, but below is the chart of CEG, a utility play that with its recent weakness has most likely fallen off many an investor's radar. The bullish WEEKLY engulfing candle the week ending 3/31 was significant after a nearly 30% drop from top to bottom of a range at the very round par number last November to the lows 4 weeks back. A 50-WEEK SMA has been newly formed to start 2023 and it has been spooning the line for the last 8 weeks. I think the WEEKLY doji candles in this area are a sign that a change in the prevailing downward direction is due for a change. Enter here and use a stop below 73.
Cameco Corp:
- Canadian nuclear play up 16% YTD and lower by 15% over last one year period. Dividend yield of .3%.
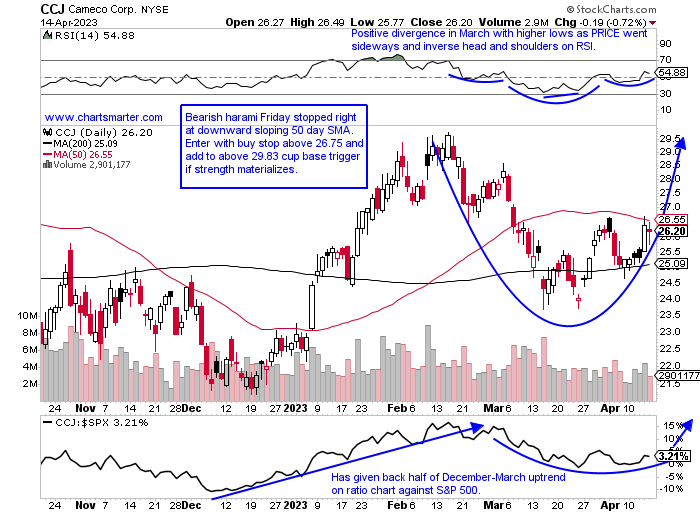
- Name 18% off most recent 52-week highs and trying to consolidate after an impressive 9-week win streak between weeks ending 12/16/22-2/10. Within WEEKLY symmetrical triangle with rough 30 number resistance for last one year.
- Earnings reactions mixed up 4.4 and 8.7% on 2/9 and 7/27/22 and fell 4.2 and 7.2% on 10/27 and 5/5/22.
- Enter with buy stop above 50-day SMA.
- Entry CCJ 26.75. Stop 25 (REPORTS 4/28 before open).
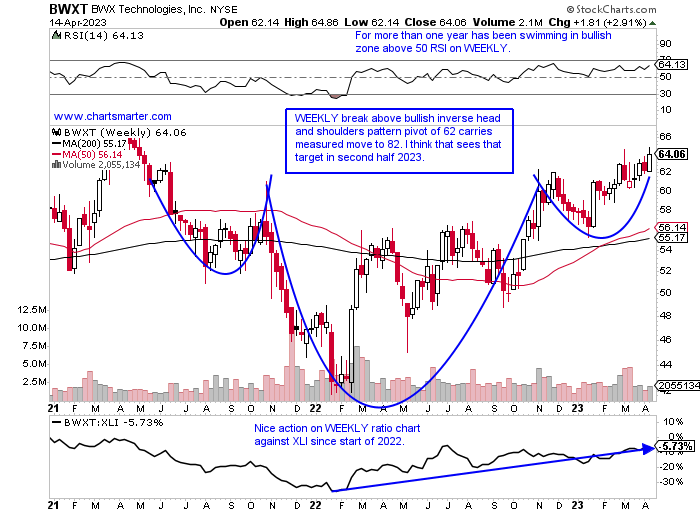
BWX Technologies:
- Industrial play up 10% YTD and 15% over last one year period. Dividend yield of 1.4%.
- Name just 1% off most recent 52-week highs and building right side of WEEKLY cup base 2 years long in duration. Good sign that weeks ending 3/10-17 which fell a combined 3.5% was absorbed well as both weeks were accompanied in the largest WEEKLY volume in 10 months.
- Earnings reactions mixed up 2.7 and .6% on 2/24 and 5/10/22 and fell .8 and .6% on 11/8 and 8/2/22.
- Enter after break above WEEKLY bullish inverse head and shoulders pattern.
- Entry BWXT here. Stop 59.
Good luck.
This article requires a Chartsmarter membership. Please click here to join.
"Muddy water is best cleared by leaving it alone." Alan Watts
Participation Problems?
- Some internals is looking dubious from the market leader in the Nasdaq which is higher by 16% YTD (compared with the S&P 500 up 8, Dow by 2, and Russell 2000 by 1%). May the near future see some mean reversion? Last week witnessed some softness in the SMH with its softest WEEKLY performance of 2023 down 4.2%. That was in stark contrast to software rising by .5% (we wrote about this in a recent tech note). Looking below the chart of the Nasdaq New Highs shows a downtrend in motion that is 2 months long now. Stocks above their 50-day SMAs are hovering near an unhealthy 30%. Overall PRICE action has to be admired however with little technical damage done even though the benchmark has advanced just 2 days in the last 2 weeks. Couple that with a WEEKLY loss of less than 1%, after the prior 3 weeks gained 10% and it feels like the bulls are still in charge. Would more participation be welcomed? Of course, it would but bulls and bears have justification for their themes as the bears would say bearish harami cross Friday. Bulls would state the index is holding its rising 21-day EMA for the last month.
Time To Start Worrying About Yields Again?
- Interest rates perked up last week and that has a myriad of implications. It put a bid under the banks, as the XLF was the best performing major S&P sector Friday and over the last one week period rising almost 3%. Of course, this is coming off a very low bar as the ETF on a YTD basis is still the worst actor off 3.4%. JPM was a contributor with a well-received earnings reaction gaining 7% on 4/14, its best daily gain in at least one year in huge volume (it has acted very well since a move off very round par number last October and a bullish island reversal completed on 3/27 off the rising 200 day SMA). The chart below of the 10-year yield may have bottomed short-term after last week started off with a bullish island reversal of its own. Wednesday and Thursday recorded bullish hammer candles to further the confident narrative. Another ramification of potentially higher rates going forward is a damper on housing stocks. But the ITB does not look unnerved as it added 4% last week and the last four sessions all CLOSED very taut within just .25 of each other.
Energy Bounce:
- After many seemed to have written off energy after 2 very firm years in 2021-22, myself in that camp, perhaps many will have to rethink that thesis. I am not yet, but the chart below of the XLE shows some nice technical action. A quick reclaim of a 50-day SMA is what leaders do and the ETF did just that the week ending 3/31 jumping more than 6%. Most "impressive" to me was the absence of any follow-through to the downside after the week ending 3/17 cratered 7% in double average WEEKLY volume and the most firm in the last 10 months. I think the group still has some proving to do with the double bottom pivot forming the week ending 1/27 with a doji candle. Give credit to CVX breaking slightly above a 172 neckline in a bullish inverse head and shoulders formation Friday and XOM with a very rare gap up on 4/3 breaking above a double bottom trigger of 113.94 and now sporting a bull flag. And we know leading stocks very often give opportunities to add onto on the way UP.
Equipment Failure?
- With the nascent excitement in energy, the XLE is the second best of the major S&P sectors of 11 on both a one-week and one-month lookback period, equipment did not seem to get the memo. The OIH is now 14% off the most recent 52-week highs, almost double that of the XLE, and one can see the lag on the ratio chart below compared to the XLE. But all is not lost with the OIH. It did complete a bullish island reversal with the 6% gap up on 4/3, after the gap lower of 7.3% on 3/15 (the 4/3 gap was filled a few sessions later). Playing Monday morning quarterback the canary in the coal mine was the bearish engulfing candle on 1/18 at multi-year highs. If looking to venture in on the long side always stick with the generals. WFRD last week inched above a 64.42 cup with handle pivot. It rose every day last week and has gained 12 of the last 14 sessions. TDW has a similar look but is still below a cup with handle trigger of 48.28.
Nuclear Ambitions, Or Lack Thereof:
- With the bulk of the news surrounding Germany's becoming nuclear-free this weekend, I thought it was a good time to review some stocks that are dependent on the space. In my belief, this will be a major factor going forward in being a valuable global energy source. We will take a look at Cameco and BWX Technologies later, but below is the chart of CEG, a utility play that with its recent weakness has most likely fallen off many an investor's radar. The bullish WEEKLY engulfing candle the week ending 3/31 was significant after a nearly 30% drop from top to bottom of a range at the very round par number last November to the lows 4 weeks back. A 50-WEEK SMA has been newly formed to start 2023 and it has been spooning the line for the last 8 weeks. I think the WEEKLY doji candles in this area are a sign that a change in the prevailing downward direction is due for a change. Enter here and use a stop below 73.
Cameco Corp:
- Canadian nuclear play up 16% YTD and lower by 15% over last one year period. Dividend yield of .3%.
- Name 18% off most recent 52-week highs and trying to consolidate after an impressive 9-week win streak between weeks ending 12/16/22-2/10. Within WEEKLY symmetrical triangle with rough 30 number resistance for last one year.
- Earnings reactions mixed up 4.4 and 8.7% on 2/9 and 7/27/22 and fell 4.2 and 7.2% on 10/27 and 5/5/22.
- Enter with buy stop above 50-day SMA.
- Entry CCJ 26.75. Stop 25 (REPORTS 4/28 before open).
BWX Technologies:
- Industrial play up 10% YTD and 15% over last one year period. Dividend yield of 1.4%.
- Name just 1% off most recent 52-week highs and building right side of WEEKLY cup base 2 years long in duration. Good sign that weeks ending 3/10-17 which fell a combined 3.5% was absorbed well as both weeks were accompanied in the largest WEEKLY volume in 10 months.
- Earnings reactions mixed up 2.7 and .6% on 2/24 and 5/10/22 and fell .8 and .6% on 11/8 and 8/2/22.
- Enter after break above WEEKLY bullish inverse head and shoulders pattern.
- Entry BWXT here. Stop 59.
Good luck.