Unpopular Opinion:
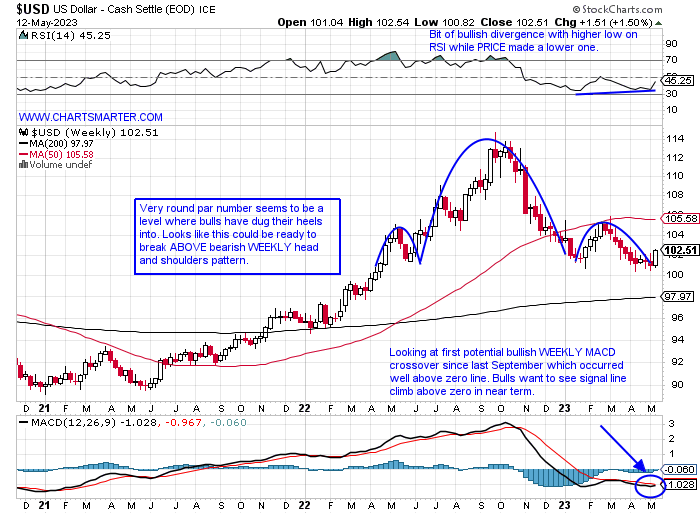
- One of the more crowded trades, and there seem to be many of them at the moment, is being short the US Dollar. Druckenmiller has been vocal about it being one of his highest conviction ideas. Could the boat be too crowded on one side, and a tactical move to the upside imminent? FALSE moves tend to inspire fast moves in the opposite direction as traders have to admit they were wrong and unwind positions. Last week produced a bullish WEEKLY engulfing candle and the greenback may want to break ABOVE the bearish head and shoulders formation. Nine of the prior ten weeks were lower, and peering back at the top near 115 last September with a strong 3% gain the week ending 9/23/22, which was immediately followed the next 2 weeks by a bearish shooting star and hanging man candles. Last week's move of well more than 1% could witness a move into the 1.05 area.
Doctors Warning:
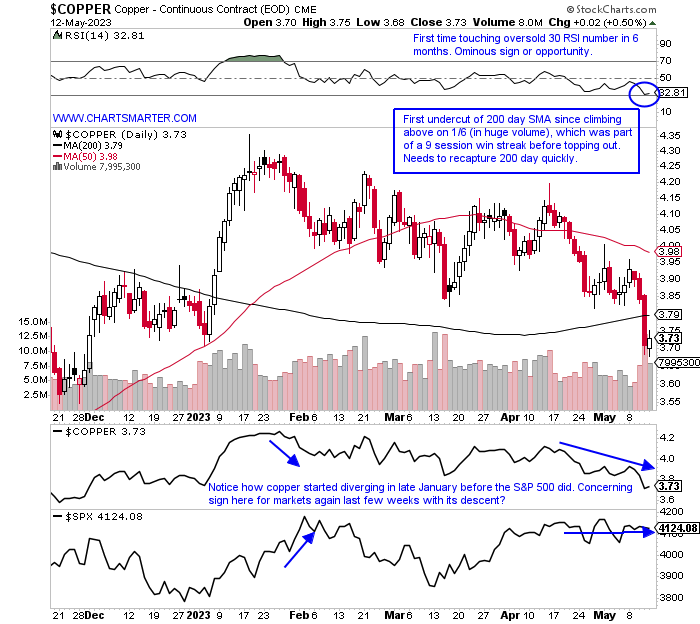
- Copper is often referred to as a doctor for its ability to sniff out recessions and this week may have brought troubling news. The industrial metal plunged below its 200-day SMA Thursday on robust trade and recorded its first 4-week losing streak since a nasty 6-week slide between last June-July. Stocks in the space fell as well but n a surprising bifurcation. FCX which has been a laggard fell more than 4%, but rival SCCO which had been behaving much better cratered 12.3% registering a bearish WEEKLY engulfing candle. It had doubled in PRICE between the round 40-80 numbers from late Q3 '22. But overall looking at copper it may have forecasted the weak February that overcame the major benchmarks. During the week endings 1/27 and 2/3 copper fell by 1 and 4.2% respectively as the S&P 500 rose 2.5 and 1.6%. For the last 4 weeks, the instruments have been diverging again and could that be a sign that the S&P500 is ready to roll over again?
"Risk On" Signal?
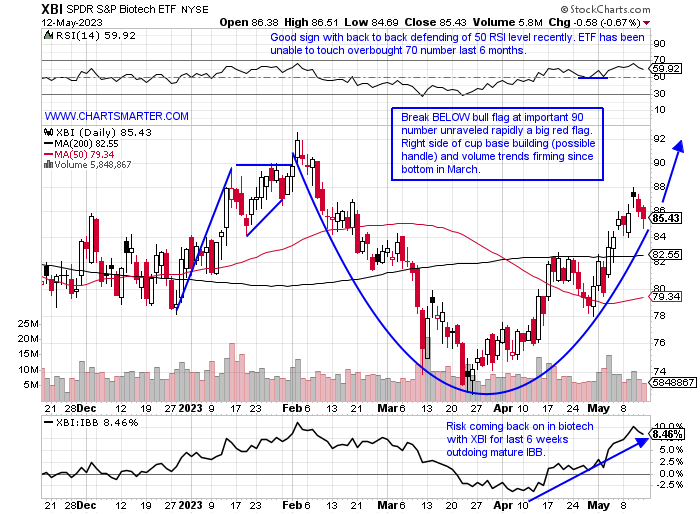
- With an abundance of negative overall market sentiment, some areas are stepping up quietly. For one the chart below of the XBI has an improving complexion. The end of last week put a slight damper to a good start with Thursday and Friday falling by a combined 2.2% (it was accompanied by light trade, which would be optimal if a handle on the potential cup base takes shape). Last week concluded with a spinning top candle, but the prior one ending 5/5 was very energetic with a 6.5% surge, excellent relative strength compared to the IBB which added 1%. That being said large-cap biotech should not be ignored. VRTX is sporting a bull flag and a move above 350 carries a measured move to 385. REGN just completed a bearish island reversal with the gap down on 5/4 (after a gap up on 3/23) and a 2% drop from here may be comforted by the rising 200-day SMA and would be its first touch since a bullish engulfing candle on 1/10. On the other side of the spectrum, I was surprised combing through the group with former leaders like NBIX or HALO who are both behaving bearishly. And TWST 80% off 52-week highs?? Especially with big recent CRSP move.
Nuclear Ambitions:
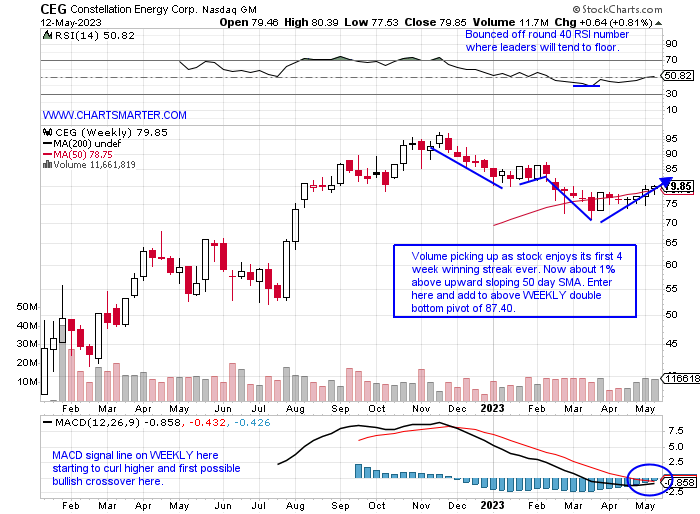
- As Germany completely turned off their reactors, other nations are stepping up theirs. Some stocks could benefit, especially the chart below of CEG, a domestic play, as the United States is the world's largest producer of nuclear energy. Since it started trading it embarked on a spirited run more than doubling before coming close to the very round par number late last year. Then from the week ending 12/2/22-4/14, it declined 16 of 20 weeks. Currently, it is on a 4-week winning streak as volume has expanded, a possible institutional footprint and each week has CLOSED at the top of its WEEKLY range. Add to that two consecutive WEEKLY doji candles the weeks ending 4/14 and 4/21, it suggests that a bottom could be in play. Other nuclear plays appear to be on the move with CCJ just below a 28.25 cup with handle trigger it took out on 5/9 jumping 4%. The stock will need to defend that breakout, as we know the best ones tend to work right away.
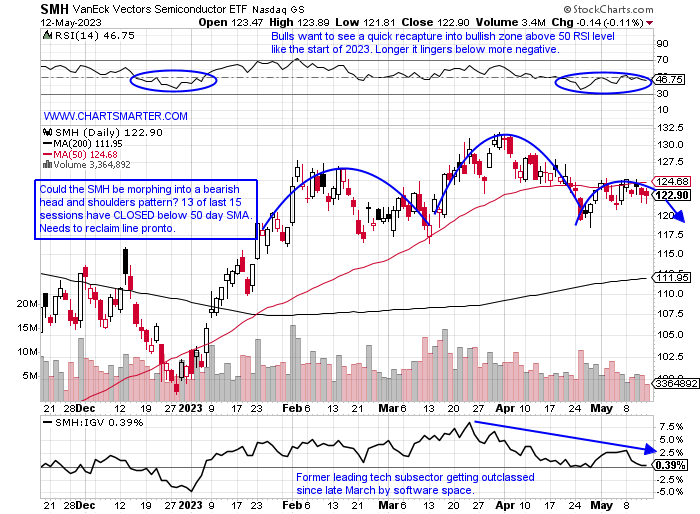
Semis Waning?
- The semiconductors have been a source of inspiration within technology since last October, but the question now is whether that strength is taking a pause or a turn for the worse. The SMH is now lower 5 of the last 6 weeks, and this week was soundly beaten by the software space as the IGV rose 1.4%, while the SMH fell 1.2%. That performance last week has allowed software to overtake semis on a one-year look-back period. The chart below suggests, which is a very dangerous thing to do, a bearish head and shoulders pattern could be taking shape. The longer the SMH remains CLOSING underneath the 50-day SMA the worse as it spent just 8 sessions below that line in late 2022 and early 2023. Not surprisingly it bottomed right in the very round par number vicinity. The IGV is now forming a handle on its short double-bottom base and needs to climb above the very round 300 number. Let us take a look at one semi and software name that I think looks attractive.
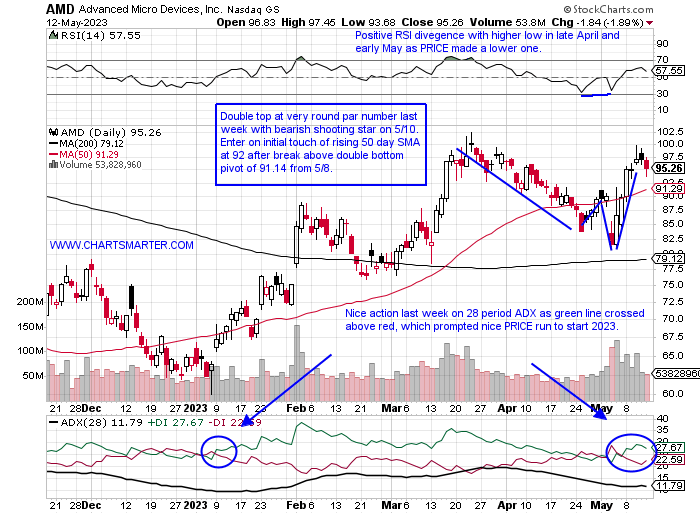
Advanced Micro Devices:
- "Old tech" semi play up 47% YTD and UNCH over last one year period.
- Name 13% off most recent 52-week highs (peer NVDA just 3% from its annual peak) and a decisive break above par would be a breakout above a bullish inverse WEEKLY head and shoulders pattern.
- Earnings reactions mostly lower up 12.6% on 2/1 and fell 9.2, 1.7, and 1.2% on 5/3, 11/2, and 8/3/22.
- Enter on initial touch of rising 50-day SMA following recent breakout.
- Entry AMD 92. Stop 88.50.
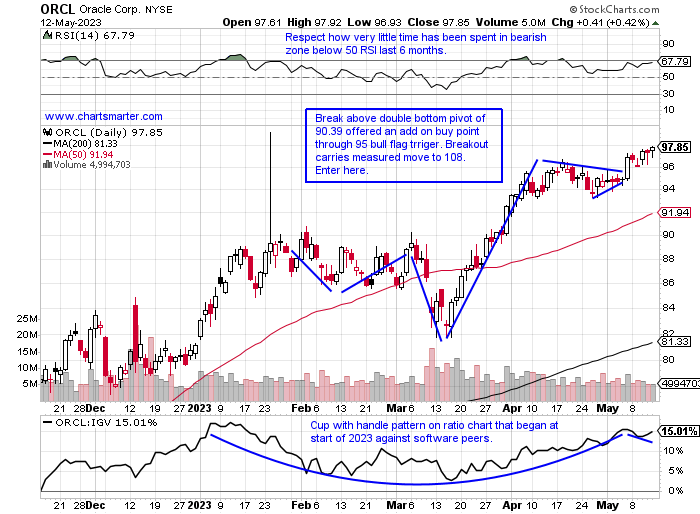
Oracle:
- "Old tech" software play up 20% YTD and 37% over last one year period. Dividend yield of 1.6%.
- Name at 52-week highs and quickly approaching very round par number which it did last after falling precipitously there after making the CERN acquisition in late 2021. Brushed aside week ending 3/10 loss of 5.8% in above average volume.
- Three straight earnings reactions down 3.2, .9, and 1.3% on 3/10, 12/13 and 6/14/22 after gain of 10.4% on 6/14/22.
- Enter after break above bull flag formation.
- Entry ORCL here. Stop 94.
Good luck.
This article requires a Chartsmarter membership. Please click here to join.
Unpopular Opinion:
- One of the more crowded trades, and there seem to be many of them at the moment, is being short the US Dollar. Druckenmiller has been vocal about it being one of his highest conviction ideas. Could the boat be too crowded on one side, and a tactical move to the upside imminent? FALSE moves tend to inspire fast moves in the opposite direction as traders have to admit they were wrong and unwind positions. Last week produced a bullish WEEKLY engulfing candle and the greenback may want to break ABOVE the bearish head and shoulders formation. Nine of the prior ten weeks were lower, and peering back at the top near 115 last September with a strong 3% gain the week ending 9/23/22, which was immediately followed the next 2 weeks by a bearish shooting star and hanging man candles. Last week's move of well more than 1% could witness a move into the 1.05 area.
Doctors Warning:
- Copper is often referred to as a doctor for its ability to sniff out recessions and this week may have brought troubling news. The industrial metal plunged below its 200-day SMA Thursday on robust trade and recorded its first 4-week losing streak since a nasty 6-week slide between last June-July. Stocks in the space fell as well but n a surprising bifurcation. FCX which has been a laggard fell more than 4%, but rival SCCO which had been behaving much better cratered 12.3% registering a bearish WEEKLY engulfing candle. It had doubled in PRICE between the round 40-80 numbers from late Q3 '22. But overall looking at copper it may have forecasted the weak February that overcame the major benchmarks. During the week endings 1/27 and 2/3 copper fell by 1 and 4.2% respectively as the S&P 500 rose 2.5 and 1.6%. For the last 4 weeks, the instruments have been diverging again and could that be a sign that the S&P500 is ready to roll over again?
"Risk On" Signal?
- With an abundance of negative overall market sentiment, some areas are stepping up quietly. For one the chart below of the XBI has an improving complexion. The end of last week put a slight damper to a good start with Thursday and Friday falling by a combined 2.2% (it was accompanied by light trade, which would be optimal if a handle on the potential cup base takes shape). Last week concluded with a spinning top candle, but the prior one ending 5/5 was very energetic with a 6.5% surge, excellent relative strength compared to the IBB which added 1%. That being said large-cap biotech should not be ignored. VRTX is sporting a bull flag and a move above 350 carries a measured move to 385. REGN just completed a bearish island reversal with the gap down on 5/4 (after a gap up on 3/23) and a 2% drop from here may be comforted by the rising 200-day SMA and would be its first touch since a bullish engulfing candle on 1/10. On the other side of the spectrum, I was surprised combing through the group with former leaders like NBIX or HALO who are both behaving bearishly. And TWST 80% off 52-week highs?? Especially with big recent CRSP move.
Nuclear Ambitions:
- As Germany completely turned off their reactors, other nations are stepping up theirs. Some stocks could benefit, especially the chart below of CEG, a domestic play, as the United States is the world's largest producer of nuclear energy. Since it started trading it embarked on a spirited run more than doubling before coming close to the very round par number late last year. Then from the week ending 12/2/22-4/14, it declined 16 of 20 weeks. Currently, it is on a 4-week winning streak as volume has expanded, a possible institutional footprint and each week has CLOSED at the top of its WEEKLY range. Add to that two consecutive WEEKLY doji candles the weeks ending 4/14 and 4/21, it suggests that a bottom could be in play. Other nuclear plays appear to be on the move with CCJ just below a 28.25 cup with handle trigger it took out on 5/9 jumping 4%. The stock will need to defend that breakout, as we know the best ones tend to work right away.
Semis Waning?
- The semiconductors have been a source of inspiration within technology since last October, but the question now is whether that strength is taking a pause or a turn for the worse. The SMH is now lower 5 of the last 6 weeks, and this week was soundly beaten by the software space as the IGV rose 1.4%, while the SMH fell 1.2%. That performance last week has allowed software to overtake semis on a one-year look-back period. The chart below suggests, which is a very dangerous thing to do, a bearish head and shoulders pattern could be taking shape. The longer the SMH remains CLOSING underneath the 50-day SMA the worse as it spent just 8 sessions below that line in late 2022 and early 2023. Not surprisingly it bottomed right in the very round par number vicinity. The IGV is now forming a handle on its short double-bottom base and needs to climb above the very round 300 number. Let us take a look at one semi and software name that I think looks attractive.
Advanced Micro Devices:
- "Old tech" semi play up 47% YTD and UNCH over last one year period.
- Name 13% off most recent 52-week highs (peer NVDA just 3% from its annual peak) and a decisive break above par would be a breakout above a bullish inverse WEEKLY head and shoulders pattern.
- Earnings reactions mostly lower up 12.6% on 2/1 and fell 9.2, 1.7, and 1.2% on 5/3, 11/2, and 8/3/22.
- Enter on initial touch of rising 50-day SMA following recent breakout.
- Entry AMD 92. Stop 88.50.
Oracle:
- "Old tech" software play up 20% YTD and 37% over last one year period. Dividend yield of 1.6%.
- Name at 52-week highs and quickly approaching very round par number which it did last after falling precipitously there after making the CERN acquisition in late 2021. Brushed aside week ending 3/10 loss of 5.8% in above average volume.
- Three straight earnings reactions down 3.2, .9, and 1.3% on 3/10, 12/13 and 6/14/22 after gain of 10.4% on 6/14/22.
- Enter after break above bull flag formation.
- Entry ORCL here. Stop 94.
Good luck.