How do you know when you are in a bull market? "Because whenever you get out, you must pay up to get back in" Peter Brandt
Yield Unease:
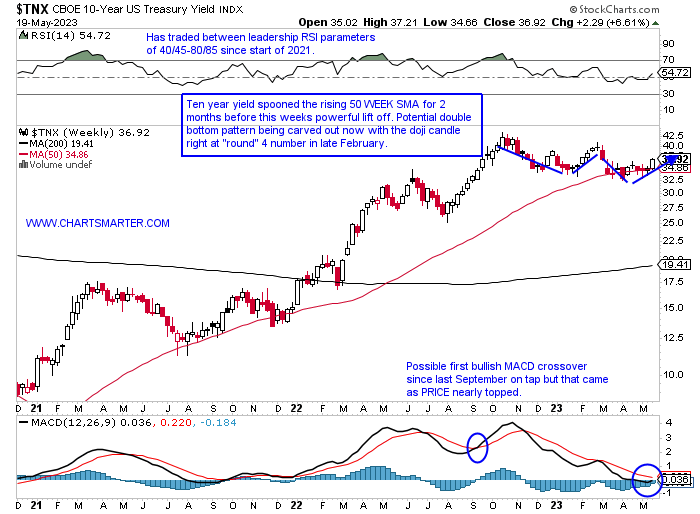
- After 9 weeks of spooning a now sideways moving 50 WEEK SMA the ten-year yield recorded a potent advance of more than 6%. This could be a damper of equities if this sees follow-through in the near term. It seems to be carving out a double bottom pattern on the WEEKLY chart and for those not concerned notice the 6-week winning streak, which added a combined 14% before reversing with a WEEKLY doji candle, between weeks ending 1/27-3/3. That saw the Nasdaq give back a good chunk of the gains from January with WEEKLY losses of 2.4, 3.3, and 4.7% in the weeks ending 2/10, 2/24, and 3/10 before regaining its composure. On the WEEKLY RSI below notice, momentum has been waning with lower highs since early 2021 and again in mid and late 2022. The signal line on the MACD looks like it is curling higher right at the zero number and could see a bullish crossover soon, but that did not respond very bullishly in PRICE last time it did that. I think this has legs toward 4 again, and if that occurs it will be interesting to see how equities respond. The 12-week win streak for the ten year between last August and October gave the Nasdaq fits seeing it move from roughly 13000 to 10000.
Lift Off In Nasdaq New Highs?
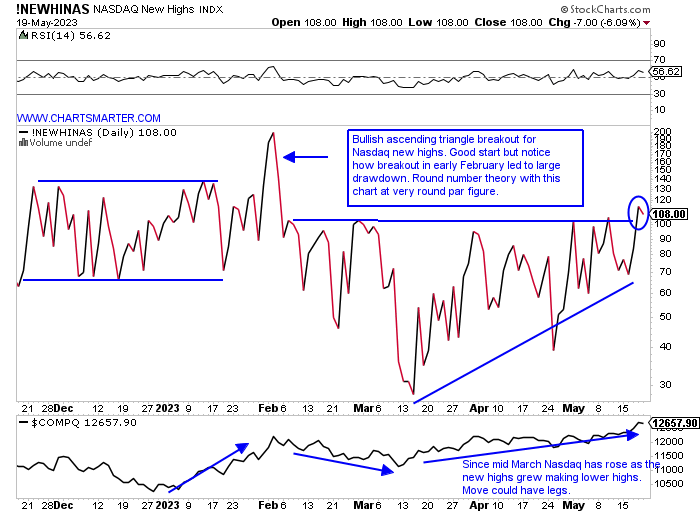
- As we will take a deeper look into the technology space in general in this note the below chart of Nasdaq New Highs may be a sign of more good things to come. This past week the gauge broke out above a bullish ascending triangle that aligned with the very round par number (notice the chart peaked right near 200 when the February hangover proceeded). We are going to want these to expand even further (looking for positive action POST breakout) in the coming weeks and months. I have been monitoring this for some time and it is definitely a good sign to see more quality start to appear in this reading. AAPL is there, as is AVGO which recently found a floor at the very round 600 number. Healthcare names are making their presence felt with EXAS ISRG and ACAD making the list, with the former edging above a bull flag. RMBS came within 5 pennies of the 60 number and is now well extended past a 51.16 double bottom pivot. In software, DUOL CDNS FTNT MANH SNPS, and VRSN are on the list. Those bears proclaiming the importance of the "S&P 5" reliance incessantly may have to come up with another talking point.
Recency Bias?
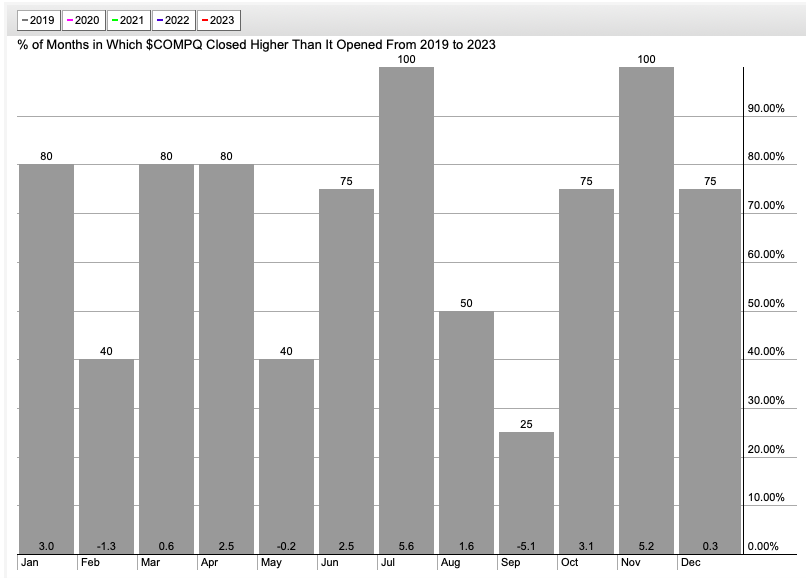
- Seasonality trends are becoming very favorable after this week with the beginning of the most powerful 3-month stretch for the Nasdaq in the last several years. Notice since 2019 during the time period the index has gained an average of 10%, with July robust averaging almost 6% (interesting as many views take the summer doldrums view) and it has CLOSED higher than where it began the last 4 years in a row. A good portion of that July dominance can be factored in when one takes into account last July when the Nasdaq rose 12.5% which started the bottoming process after a big slide following the MONTHLY gravestone doji candle from November 2021 at the very round 16000 number. And the good news continues for the rest of the year, after a September hiccup which has produced an average move lower of more than 5%, with the traditionally strong Q4, as November sticks out with its 5% plus gains (as the Santa Claus rally comes earlier as that effect decays over time). This bolsters the bull case but as always be open-minded and ready for anything.
Breakout Greenshoots?
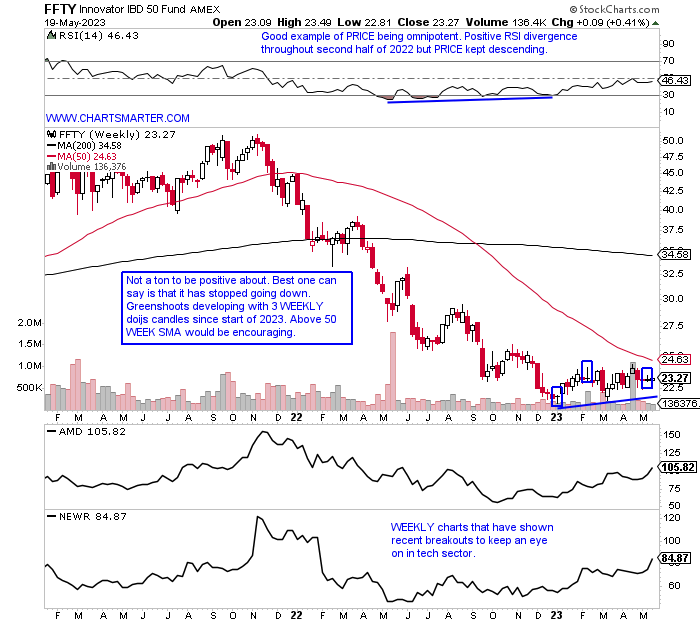
- We often like to proclaim that in a healthy bull market leaders will be reaking out from sound bases, preferably in growth related areas. And not only that but they wil continue to act well POST breakout, as the best ones often do. The chart below of the FFTY, which is an illquid instrument, is a good indicator of what is going on in regard to it. Since the start of 2023 it has recorded three WEEKLY doji candles, which are adept at signaling a potential trend change from the prevailing direction. Obviously this chart has been in a firm downtrend since late 2021. It has been registering higher lows the last 6 months, but to get more sanguine a leap above that 50 WEEK SMA would be a good first step. Stocks in the tech space that have been displaying good action after breaking out include AMD and NEWR. It is hard to see that on the WEEKLY charts below but one can get a picture of how there overall technical complexion is getting better. AMD has broken above a WEEKLY bullish inverse head and shoulders with a measured move to 145 and NEWR which REPORTS Tuesday after the close is now comfortably above a daily cup base breakout pivot of 80.98.
No Communication Issues:
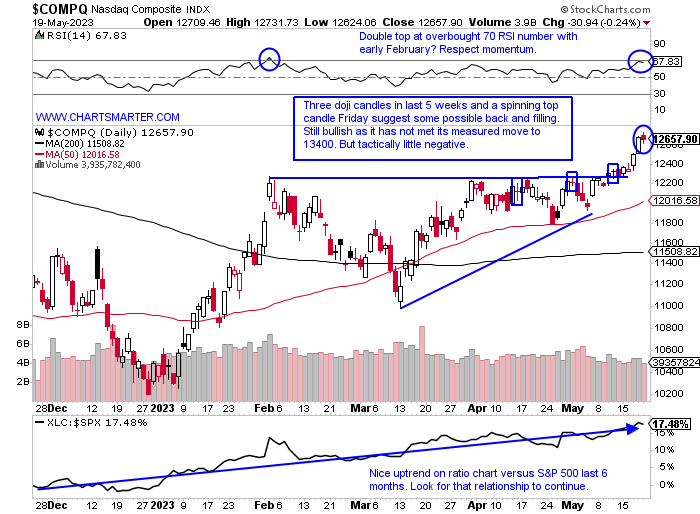
- Glancing below at the daily chart of the Nasdaq produced a spinning top candle which may speak to a bit of technical indecision. Of course, we will not know until later as I have been WRONG on its direction with the presence of 3 doji candles as of late. Nothing goes up in a straight line and I think a little pause here would be prudent for the tech heavy benchmark, but ultimately see a move this summer toward 13400. On the bottom of the chart we look at the ratio chart of the XLC, communication services, against the S&P 500 and one can see the firm uptrend as it is the best performing major S&P sector YTD up more than 28%. NFLX has gained a combined 13% during the last 2 weeks after a nasty decline following WEEKLY doji candle at the very round 700 number the week ending 11/19/21. In the last 2 pages on this note we look at two names that can be shorted, one on a tactical basis with GOOGL, and then TMUS which seems broken and ready to play catch up to the downside with mobile communication services peers in T and VZ.
Google:
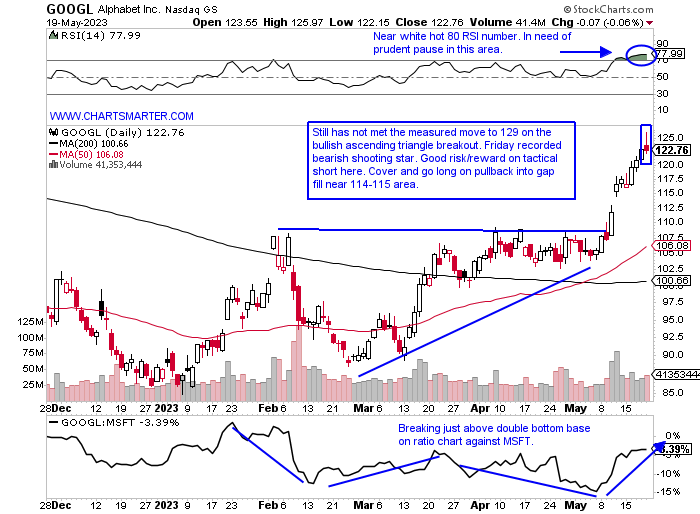
- Communication services giant up 39% YTD and 11% over last one year period.
- Name 3% off most recent 52 week highs and added 4.5% last week, great follow through after prior week jumped 11.3%. Also advanced 12% week ending 3/17 in above average WEEKLY volume. Nice response since big bearish reversal of 9.7% wek ending 2/10.
- Three straigth negative earnings reactions lower down .1, 2.7, and 9.2 on 4/26, 2/3 and 10/26/22 after gain of 7.7% on 7/27/22.
- Short after bearish shooting star candle.
- Entry GOOGL here. Buy stop 126.
T-Mobile:
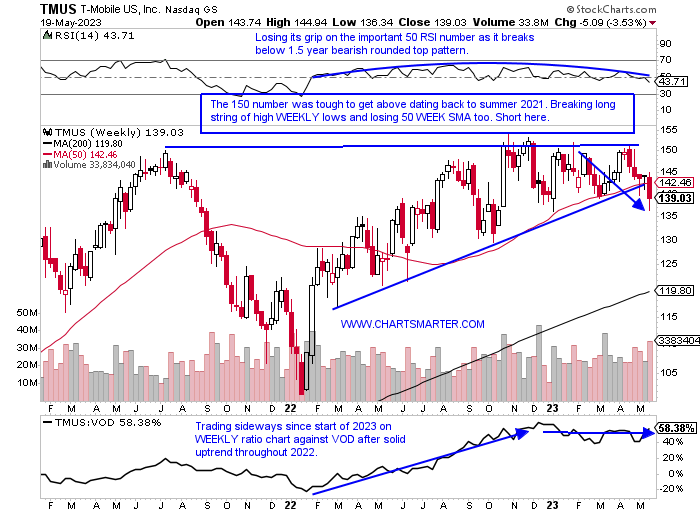
- Mobile communication services play down 1% YTD and up 10% over last one year period.
- Name 10% off most recent 52 week highs (peers T and VZ are 24 and 31% from their annual peaks) and lower 5 of last 6 weeks, with volume trends bearish. Has now broken BELOW bullish WEEKLY ascending triangle.
- Earnings reactions mostly higher up 1, 7.4 and 5.2% on 2/1, 10/28 and 7/27/22 before recent loss of 4% on 4/28.
- Enter short after break below WEEKLY bearish descending triangle/50 WEEK SMA.
- Entry TMUS here. Buy stop 146.
Good luck.
This article requires a Chartsmarter membership. Please click here to join.
How do you know when you are in a bull market? "Because whenever you get out, you must pay up to get back in" Peter Brandt
Yield Unease:
- After 9 weeks of spooning a now sideways moving 50 WEEK SMA the ten-year yield recorded a potent advance of more than 6%. This could be a damper of equities if this sees follow-through in the near term. It seems to be carving out a double bottom pattern on the WEEKLY chart and for those not concerned notice the 6-week winning streak, which added a combined 14% before reversing with a WEEKLY doji candle, between weeks ending 1/27-3/3. That saw the Nasdaq give back a good chunk of the gains from January with WEEKLY losses of 2.4, 3.3, and 4.7% in the weeks ending 2/10, 2/24, and 3/10 before regaining its composure. On the WEEKLY RSI below notice, momentum has been waning with lower highs since early 2021 and again in mid and late 2022. The signal line on the MACD looks like it is curling higher right at the zero number and could see a bullish crossover soon, but that did not respond very bullishly in PRICE last time it did that. I think this has legs toward 4 again, and if that occurs it will be interesting to see how equities respond. The 12-week win streak for the ten year between last August and October gave the Nasdaq fits seeing it move from roughly 13000 to 10000.
Lift Off In Nasdaq New Highs?
- As we will take a deeper look into the technology space in general in this note the below chart of Nasdaq New Highs may be a sign of more good things to come. This past week the gauge broke out above a bullish ascending triangle that aligned with the very round par number (notice the chart peaked right near 200 when the February hangover proceeded). We are going to want these to expand even further (looking for positive action POST breakout) in the coming weeks and months. I have been monitoring this for some time and it is definitely a good sign to see more quality start to appear in this reading. AAPL is there, as is AVGO which recently found a floor at the very round 600 number. Healthcare names are making their presence felt with EXAS ISRG and ACAD making the list, with the former edging above a bull flag. RMBS came within 5 pennies of the 60 number and is now well extended past a 51.16 double bottom pivot. In software, DUOL CDNS FTNT MANH SNPS, and VRSN are on the list. Those bears proclaiming the importance of the "S&P 5" reliance incessantly may have to come up with another talking point.
Recency Bias?
- Seasonality trends are becoming very favorable after this week with the beginning of the most powerful 3-month stretch for the Nasdaq in the last several years. Notice since 2019 during the time period the index has gained an average of 10%, with July robust averaging almost 6% (interesting as many views take the summer doldrums view) and it has CLOSED higher than where it began the last 4 years in a row. A good portion of that July dominance can be factored in when one takes into account last July when the Nasdaq rose 12.5% which started the bottoming process after a big slide following the MONTHLY gravestone doji candle from November 2021 at the very round 16000 number. And the good news continues for the rest of the year, after a September hiccup which has produced an average move lower of more than 5%, with the traditionally strong Q4, as November sticks out with its 5% plus gains (as the Santa Claus rally comes earlier as that effect decays over time). This bolsters the bull case but as always be open-minded and ready for anything.
Breakout Greenshoots?
- We often like to proclaim that in a healthy bull market leaders will be reaking out from sound bases, preferably in growth related areas. And not only that but they wil continue to act well POST breakout, as the best ones often do. The chart below of the FFTY, which is an illquid instrument, is a good indicator of what is going on in regard to it. Since the start of 2023 it has recorded three WEEKLY doji candles, which are adept at signaling a potential trend change from the prevailing direction. Obviously this chart has been in a firm downtrend since late 2021. It has been registering higher lows the last 6 months, but to get more sanguine a leap above that 50 WEEK SMA would be a good first step. Stocks in the tech space that have been displaying good action after breaking out include AMD and NEWR. It is hard to see that on the WEEKLY charts below but one can get a picture of how there overall technical complexion is getting better. AMD has broken above a WEEKLY bullish inverse head and shoulders with a measured move to 145 and NEWR which REPORTS Tuesday after the close is now comfortably above a daily cup base breakout pivot of 80.98.
No Communication Issues:
- Glancing below at the daily chart of the Nasdaq produced a spinning top candle which may speak to a bit of technical indecision. Of course, we will not know until later as I have been WRONG on its direction with the presence of 3 doji candles as of late. Nothing goes up in a straight line and I think a little pause here would be prudent for the tech heavy benchmark, but ultimately see a move this summer toward 13400. On the bottom of the chart we look at the ratio chart of the XLC, communication services, against the S&P 500 and one can see the firm uptrend as it is the best performing major S&P sector YTD up more than 28%. NFLX has gained a combined 13% during the last 2 weeks after a nasty decline following WEEKLY doji candle at the very round 700 number the week ending 11/19/21. In the last 2 pages on this note we look at two names that can be shorted, one on a tactical basis with GOOGL, and then TMUS which seems broken and ready to play catch up to the downside with mobile communication services peers in T and VZ.
Google:
- Communication services giant up 39% YTD and 11% over last one year period.
- Name 3% off most recent 52 week highs and added 4.5% last week, great follow through after prior week jumped 11.3%. Also advanced 12% week ending 3/17 in above average WEEKLY volume. Nice response since big bearish reversal of 9.7% wek ending 2/10.
- Three straigth negative earnings reactions lower down .1, 2.7, and 9.2 on 4/26, 2/3 and 10/26/22 after gain of 7.7% on 7/27/22.
- Short after bearish shooting star candle.
- Entry GOOGL here. Buy stop 126.
T-Mobile:
- Mobile communication services play down 1% YTD and up 10% over last one year period.
- Name 10% off most recent 52 week highs (peers T and VZ are 24 and 31% from their annual peaks) and lower 5 of last 6 weeks, with volume trends bearish. Has now broken BELOW bullish WEEKLY ascending triangle.
- Earnings reactions mostly higher up 1, 7.4 and 5.2% on 2/1, 10/28 and 7/27/22 before recent loss of 4% on 4/28.
- Enter short after break below WEEKLY bearish descending triangle/50 WEEK SMA.
- Entry TMUS here. Buy stop 146.
Good luck.