"Your habits will determine your future." -Jack Canfield
Affirmative Routines:
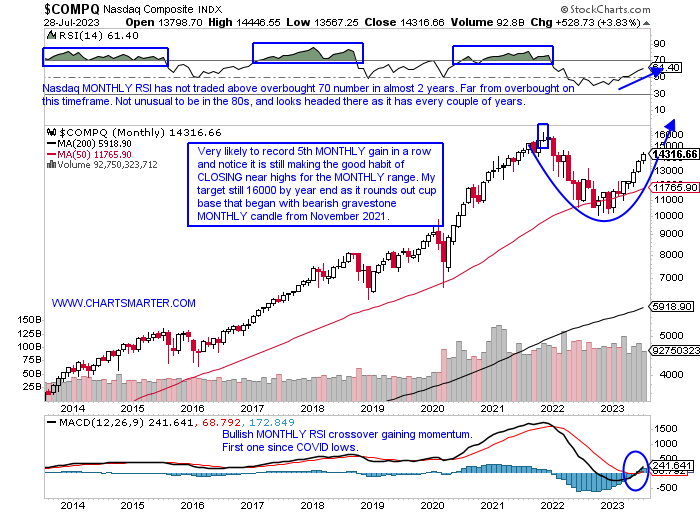
- In markets as in life, good habits are critical to success. Looking at the MONTHLY chart below, I believe the path to least resistance is higher after Friday's nice reversal to recoup virtually all of Thursday's losses. It is looking to keep a streak alive, with a possible fifth MONTHLY CLOSE at or very close to finishing at highs for the MONTHLY range. The cup base began at the very round 10000 number in late 2021 and a decisive move above it would carry a measured move to 22000. Of course, that could take a couple of years, if at all. The tech-heavy benchmark is well rested, after a long supportive cushion at the 50 MONTH SMA from last June to this March. On the MONTHLY RSI, one can see there tends to be a 2-year run of trading entirely above the overbought 70 figure, and then a year of swimming below it. It is due for a move between the 70-80 numbers and stay there for some time. Notice during those periods where RSI was above the overbought 70 number the index still traded higher and reaffirms the statement that there is nothing more bullish than an overbought one that remains so.
Size Matters:
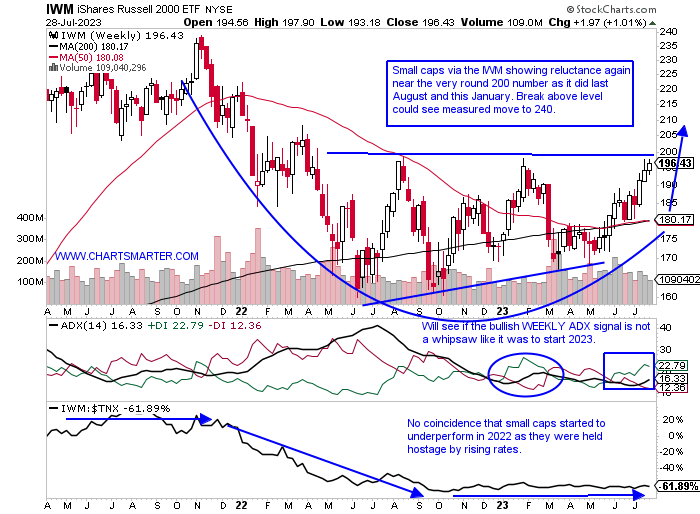
- Market participants often look for clues from small caps as they are thought of as good leading indicators. If small businesses are thriving, the vast majority of net job creation, that is a sanguine signal. The chart below of the IWM is hitting the brakes at a recognizable level again here near the very round 200 number. The good sign is that is now the pivot in a bullish ascending triangle pattern as it has made higher lows since last June. The problem is the asset class is lagging this year with the Russell 2000 up a "pedestrian" 12% compared to the Nasdaq up 37 and the S&P 500 by 19%. When one looks at the charts of the other big three benchmarks in the Nazz, Dow, and S&P 500 it would see each one of those three is now above last August's highs. I prefer to reward strength, but a move above 200 would dramatically improve the chart's complexion and see it start to play catch up, perhaps in a vibrant way. Of course, interest rates will play a role, as small businesses are negatively affected as they rely heavily on financing.
"Shiny" Action Forthcoming?
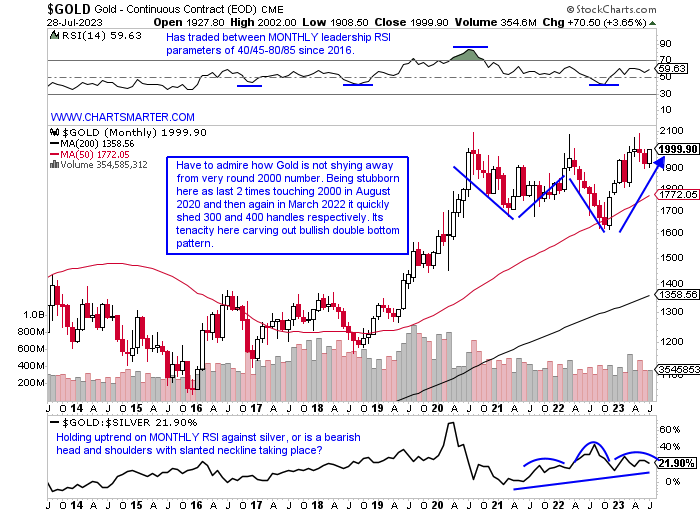
- Gold rose almost 3% Friday as it faces a familiar foe in the very round 2000 number. On the MONTHLY chart below, the metal has been above 2000 on a MONTHLY basis 9 times intramonth since the COVID lows, but there have been zero CLOSES above the figure. Will Monday avoid extending the streak to 10? The fierce move higher of almost 1000 handles between the summer of 2018 to mid-2020, has been basically a sideways move ever since. Could the next leg be higher? I believe so, not in a material way, but could see this move toward 2100, a rough area it backed away from with a bearish spinning top and bearish shooting star MONTHLY candles during August 2020 and March 2022 (bearish spinning tops occurred in April and May 2023 too). If and when it trades that high, a move above could see a flurry of buying as it would emerge from this "digestion" since COVID.
Commodity Ascent:
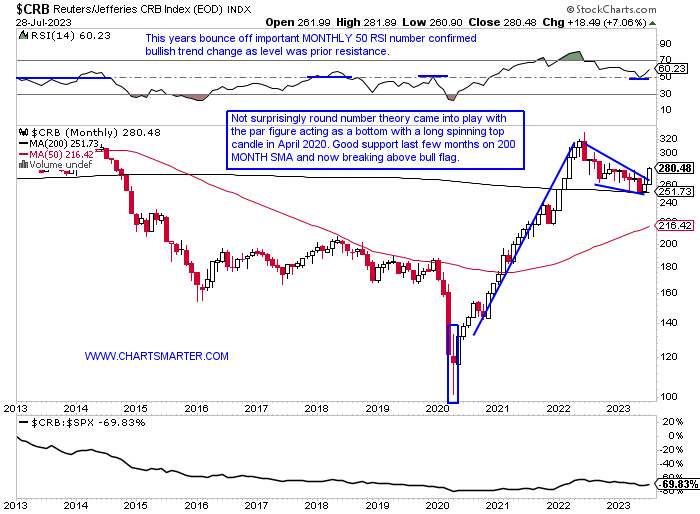
- As the bullish rolling market continues and rotation is seen into groups like industrials, energy, and materials (financials as well) of course it is likely a sign that commodities may be picking up steam. That theory is shown here with this month's break above a MONTHLY bull flag. Its flag pole began at the very round par number, and this will obviously be affected by its relationship to the greenback, and that instrument is now dealing with the very round 100 figure as well. But this is a good sign that the economy is improving as the CRB index rises. The thirst for goods like oil, gold, and copper (among a bunch of softs) confirms the belief. WTI moved back above its 50 WEEK SMA for the first time in one year, and higher for 5 straight weeks, a feat it has not accomplished since the start of 2022. The MONTHLY chart on the XOP is building the right clavicle in a bullish inverse head and shoulders formation in a pattern dating back to. One should be overweight names in the sectors we mentioned at the beginning of this paragraph.
Material World:
- With just one session left in July, the XLB is on a roll. On its MONTHLY chart, it has the look of a bullish hammer after June registered a bullish engulfing candle gaining more than 10%, and if it holds would be the first back-to-back MONTHLY gains of 2023. The daily chart below shows it acting well POST breakout above the bull flag pivot of 84. It is now higher 7 of the last 9 weeks and sits just 1% off most recent 52-week highs. Helping the sector along last week were some strong showings some a diverse bunch of material names like container and packaging play PKG that registered its first double-digit WEEKLY gain in at least 5 years. The chemical name LYB is quickly approaching the very round par number, and SCCO added more than 8% for the second time in 3 weeks. CF is on a 4-week win streak and has added more than 30% during a 7 of 9-week win streak. Let's take a look at a couple more strong performers that deserve your attention below.

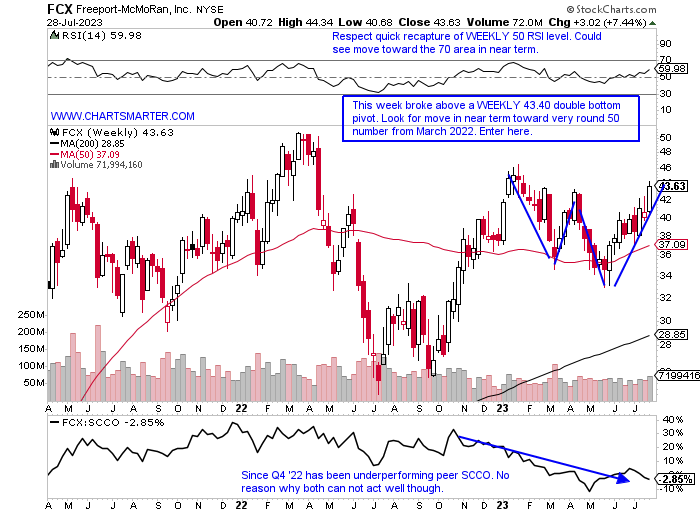
Freeport McMoRan:
- Copper play up 15% YTD and 46% over last one year period. Dividend yield of .7%.
- Name 7% off most recent 52-week highs and up 6 of the last 9 weeks with all 6 of the advancers CLOSING at or near highs for the WEEKLY range. Three of the up weeks jumped between 6-7%.
- Earnings reactions mostly higher up 3, 4.6, and 2.7% on 7/20, 1/25, and 10/20/22, and fell 4.1% on 4/21.
- Enter after WEEKLY double-bottom breakout.
- Entry FCX here. Stop 39.
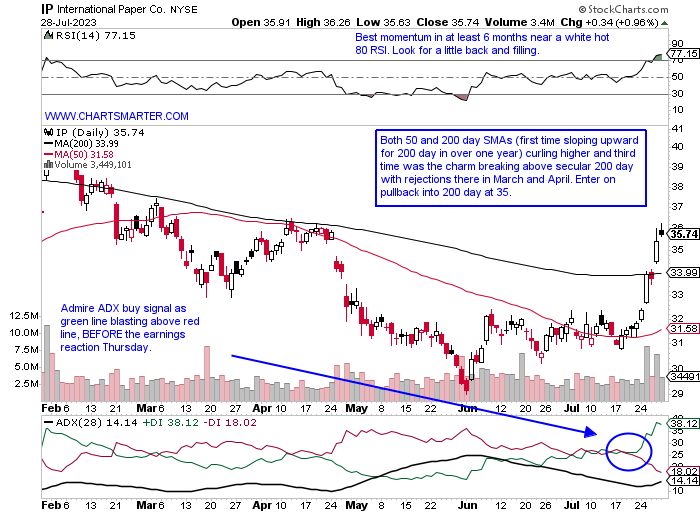
International Paper:
- Paper play up 3% YTD and down 17% over last one year period. Dividend yield of 5.1%.
- Name 21% off most recent 52-week highs and surged 12.2% last week and CLOSED above its 50 WEEK SMA for just second time in almost 2 years. Needs to show it can remain above.
- Earnings reactions mixed up 4.8 and 10.6% on 7/27 and 1/31 and fell 4.5 and .7% on 4/27 and 10/27/22.
- Enter on pullback into 200-day SMA.
- Entry IP 35. Stop 33.50.
Good luck.
This article requires a Chartsmarter membership. Please click here to join.
"Your habits will determine your future." -Jack Canfield
Affirmative Routines:
- In markets as in life, good habits are critical to success. Looking at the MONTHLY chart below, I believe the path to least resistance is higher after Friday's nice reversal to recoup virtually all of Thursday's losses. It is looking to keep a streak alive, with a possible fifth MONTHLY CLOSE at or very close to finishing at highs for the MONTHLY range. The cup base began at the very round 10000 number in late 2021 and a decisive move above it would carry a measured move to 22000. Of course, that could take a couple of years, if at all. The tech-heavy benchmark is well rested, after a long supportive cushion at the 50 MONTH SMA from last June to this March. On the MONTHLY RSI, one can see there tends to be a 2-year run of trading entirely above the overbought 70 figure, and then a year of swimming below it. It is due for a move between the 70-80 numbers and stay there for some time. Notice during those periods where RSI was above the overbought 70 number the index still traded higher and reaffirms the statement that there is nothing more bullish than an overbought one that remains so.
Size Matters:
- Market participants often look for clues from small caps as they are thought of as good leading indicators. If small businesses are thriving, the vast majority of net job creation, that is a sanguine signal. The chart below of the IWM is hitting the brakes at a recognizable level again here near the very round 200 number. The good sign is that is now the pivot in a bullish ascending triangle pattern as it has made higher lows since last June. The problem is the asset class is lagging this year with the Russell 2000 up a "pedestrian" 12% compared to the Nasdaq up 37 and the S&P 500 by 19%. When one looks at the charts of the other big three benchmarks in the Nazz, Dow, and S&P 500 it would see each one of those three is now above last August's highs. I prefer to reward strength, but a move above 200 would dramatically improve the chart's complexion and see it start to play catch up, perhaps in a vibrant way. Of course, interest rates will play a role, as small businesses are negatively affected as they rely heavily on financing.
"Shiny" Action Forthcoming?
- Gold rose almost 3% Friday as it faces a familiar foe in the very round 2000 number. On the MONTHLY chart below, the metal has been above 2000 on a MONTHLY basis 9 times intramonth since the COVID lows, but there have been zero CLOSES above the figure. Will Monday avoid extending the streak to 10? The fierce move higher of almost 1000 handles between the summer of 2018 to mid-2020, has been basically a sideways move ever since. Could the next leg be higher? I believe so, not in a material way, but could see this move toward 2100, a rough area it backed away from with a bearish spinning top and bearish shooting star MONTHLY candles during August 2020 and March 2022 (bearish spinning tops occurred in April and May 2023 too). If and when it trades that high, a move above could see a flurry of buying as it would emerge from this "digestion" since COVID.
Commodity Ascent:
- As the bullish rolling market continues and rotation is seen into groups like industrials, energy, and materials (financials as well) of course it is likely a sign that commodities may be picking up steam. That theory is shown here with this month's break above a MONTHLY bull flag. Its flag pole began at the very round par number, and this will obviously be affected by its relationship to the greenback, and that instrument is now dealing with the very round 100 figure as well. But this is a good sign that the economy is improving as the CRB index rises. The thirst for goods like oil, gold, and copper (among a bunch of softs) confirms the belief. WTI moved back above its 50 WEEK SMA for the first time in one year, and higher for 5 straight weeks, a feat it has not accomplished since the start of 2022. The MONTHLY chart on the XOP is building the right clavicle in a bullish inverse head and shoulders formation in a pattern dating back to. One should be overweight names in the sectors we mentioned at the beginning of this paragraph.
Material World:
- With just one session left in July, the XLB is on a roll. On its MONTHLY chart, it has the look of a bullish hammer after June registered a bullish engulfing candle gaining more than 10%, and if it holds would be the first back-to-back MONTHLY gains of 2023. The daily chart below shows it acting well POST breakout above the bull flag pivot of 84. It is now higher 7 of the last 9 weeks and sits just 1% off most recent 52-week highs. Helping the sector along last week were some strong showings some a diverse bunch of material names like container and packaging play PKG that registered its first double-digit WEEKLY gain in at least 5 years. The chemical name LYB is quickly approaching the very round par number, and SCCO added more than 8% for the second time in 3 weeks. CF is on a 4-week win streak and has added more than 30% during a 7 of 9-week win streak. Let's take a look at a couple more strong performers that deserve your attention below.
Freeport McMoRan:
- Copper play up 15% YTD and 46% over last one year period. Dividend yield of .7%.
- Name 7% off most recent 52-week highs and up 6 of the last 9 weeks with all 6 of the advancers CLOSING at or near highs for the WEEKLY range. Three of the up weeks jumped between 6-7%.
- Earnings reactions mostly higher up 3, 4.6, and 2.7% on 7/20, 1/25, and 10/20/22, and fell 4.1% on 4/21.
- Enter after WEEKLY double-bottom breakout.
- Entry FCX here. Stop 39.
International Paper:
- Paper play up 3% YTD and down 17% over last one year period. Dividend yield of 5.1%.
- Name 21% off most recent 52-week highs and surged 12.2% last week and CLOSED above its 50 WEEK SMA for just second time in almost 2 years. Needs to show it can remain above.
- Earnings reactions mixed up 4.8 and 10.6% on 7/27 and 1/31 and fell 4.5 and .7% on 4/27 and 10/27/22.
- Enter on pullback into 200-day SMA.
- Entry IP 35. Stop 33.50.
Good luck.