"If you are brave enough to say goodbye, life will reward you with a new hello." Paulo Coelho
"Industrial" Strength:
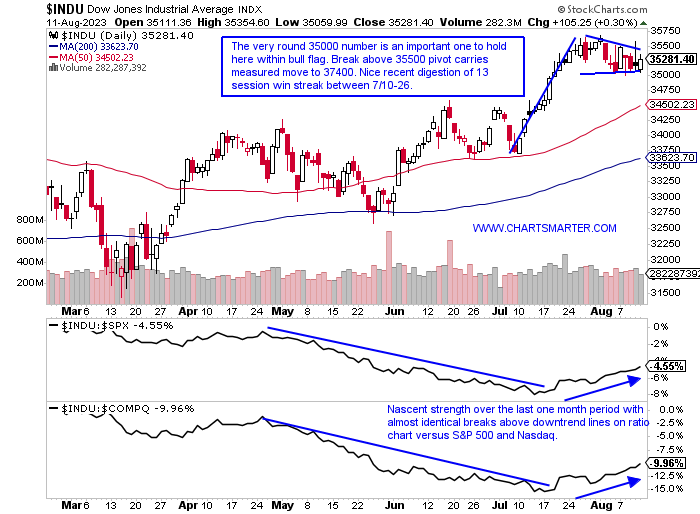
- Of course, we know the Dow Jones Industrial Average is a shadow of itself for decades of old (just 5 industrial names left in the benchmark), and it is saying something that I am looking at this instrument to open this WEEK AHEAD Note. I would rather be discussing the Nasdaq or small caps, but it is where strength is emanating from and our focus is making money (from the long side here). AAPL we know has been soft, but remember this is a PRICE-weighted index so its effect will be negligible. On the other hand UNH at over 500 will have the largest impact and that stock is bull flagging, like the chart below of the Dow itself, just above the very round 500 number and a move above 515 carries a measured move to 580. Last week the Dow rose .6% displaying good relative strength as the Nasdaq fell 1.9%, the Russell 2000 by 1.6%, and the S&P 500 dropped .3%. This is certainly a sign that investors are becoming risk averse. And this has carried on over the last month as the Nasdaq, Russell, and S&P 500 UNCH with the Dow rising 3%.
Ten-Year Breakout:
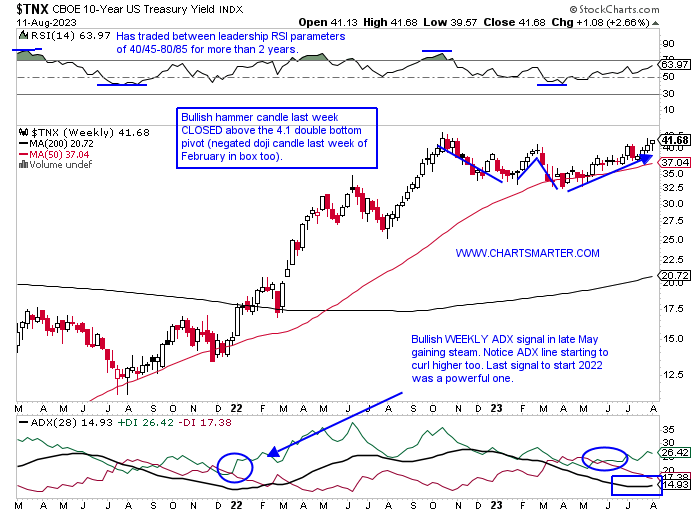
- Last week produced a nice breakout for the ten-year yield and it registered its first consecutive WEEKLY CLOSES above the "round 4" number which has been an impediment. The previous time it was able to accomplish that was a 4-week run last October before topping out, and not surprisingly saw equities bottom. Markets are wobbly once again and this breakout I think will have a loud say on whether overall markets falter here. A clear sign will be how this breakout on the 10-year last week holds up, as we know the best breakouts tend to work right away. A rapid failure would be a clear sign that equity markets may return to their prior uptrend (technology), but if this move is for real softness may linger. My belief is that the TNX could head to the 5 area into year-end or Q1 '24. It is now starting to distance itself from the rising 50-day SMA and the last time it did that in the second half of 2021 witnessed a robust run for the first 10 months of 2022. Deja vu?
Crude Awakening:
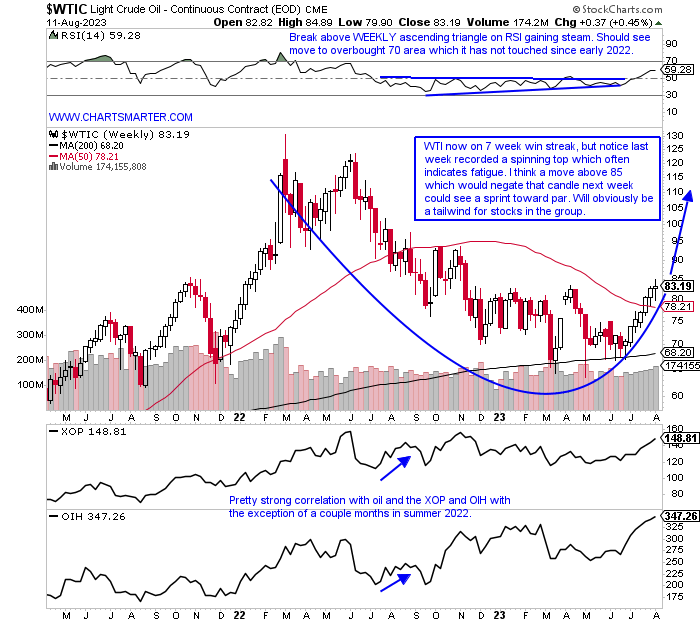
- Is sentiment too bullish on energy? Probably as almost no one I speak to has done so with a negative tone. This is not a bad thing as consensus is usually correct I have found over my decades in markets. PRICE action will let one know when to get off the train. Remember trends once in motion tend to remain that way, more likely than they are to reverse. Looking at the XLE, which until recently was the dead last of the major S&P sectors on a YTD basis, has now leapfrogged financials, real estate, staples, healthcare, and utilities. Now it is the best of 11 groups over the last one-week, one-month and 3-month timeframes (and if you substituted the OIH and XOP it would be even stronger over the last 3 months). One can see the WEEKLY chart of WTI below took a pitstop last week after the spinning top candle, and bulls want to see some digestion. I still believe drillers are the place to be as companies continue to be creative and efficient at extracting oil, as opposed to exploration which are subject to onerous regulation. That is just my opinion, but PRICE action is confirming that belief. Above 85 pushes oil to 100, and will benefit all groups within, but the drillers should be overweighted.
Slippery Nasdaq Slope:
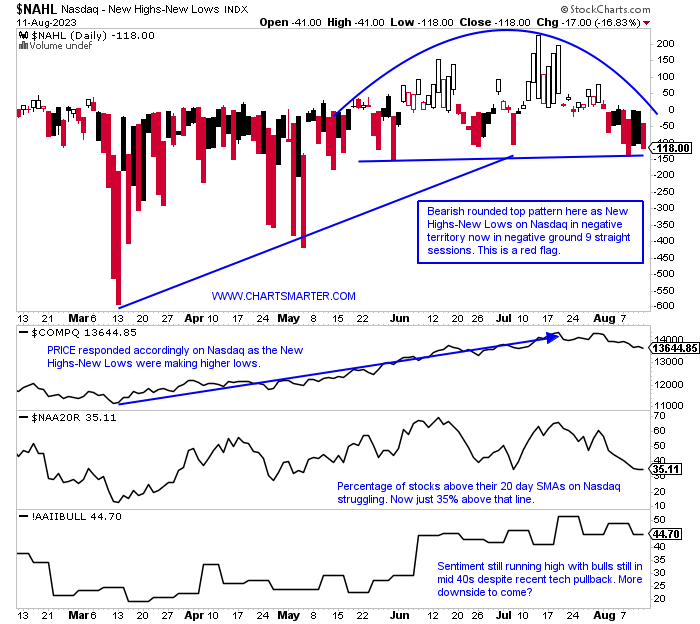
- The Nasdaq since recording a bearish evening star pattern on 7/20 losing more than 2% that session has felt vulnerable. Distribution was popping up just prior to that as warning signs were beginning on 6/16 with the bearish dark cloud cover candle. The last 3 days of last week all CLOSED hard upon their lows and 3 of the last 4 weeks have done that as well (each of the 3 decliners CLOSED roughly 400 handles off intraweek highs), hallmark bearish traits. The chart below shows how influential the New High-New Lows index has been with PRICE moving higher from the mid-March lows as the NAHL was registering higher lows. That has come to an abrupt halt, and recognizable Nasdaq new highs Friday were from MMYT and EXEL only (to be fair on the low list were CBRL and ETSY). Stocks on the Nasdaq above their 20-day highs are in the mid-30s and the benchmark is losing touch with its 50-day SMA. Sentiment is still bullish which gives me the feeling that lower PRICES are ahead. The question is will energy, financials, and healthcare take the baton and hold the market up until tech gets back on its feet?
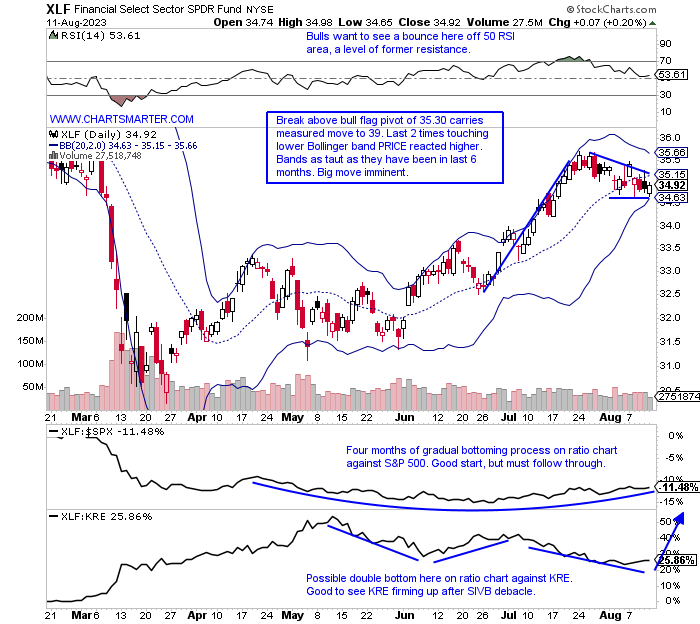
Financials Toughen:
- The financials YTD have been a moribund one, hovering just above the UNCH mark, making it the 7th best of 11 major S&P sectors. Give it credit for acting better than most over the last month period as it has climbed to the 3rd best actor. This is a direct result of the top 3 holdings performing very well with BRK/B, the largest component just 2% off its all-time high. Surprising to me given that AAPL makes up nearly 50% of its investment vehicle (we know it is a rapid 10% off its 52-week highs, in just the last 2 weeks alone, after its first back-to-back WEEKLY losses of 2023). JPM and V are contributing to keeping the XLF afloat at this nice altitude as well. Even the KRE seems to be solidifying after July's 19% advance. Surely interest rates on the rise will be a tailwind, but let us take a look below at one long opportunity (from a European name, yes you heard that correctly), and a rating agency on the short side.
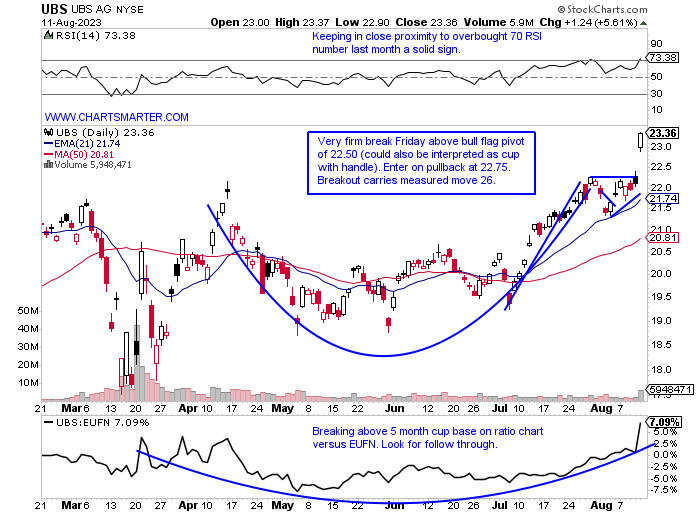
UBS:
- Swiss bank up 25% YTD and 41% over last one year period. Dividend yield of 2.4%.
- Name at 52-week highs and last week surged 7% taking out a 5-month WEEKLY cup base. Higher 4 of the last 5 weeks with all 5 CLOSING at or close to highs for the WEEKLY range.
- Earnings reactions mixed up .8 and 8.2% on 1/31 and 10/25/22 and fell 4.7 and 11.2% on 4/25 and 7/26/22.
- Enter on pullback into bull flag/cup with handle breakout.
- Entry UBS 22.75. Stop 21.75.
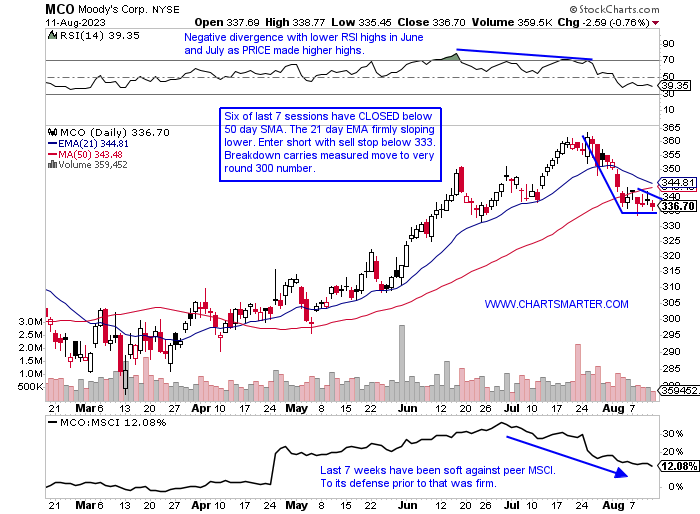
Moodys:
- Risk assessment play up 21% YTD and % over last one year period. Dividend yield of .9%.
- Name 7% off most recent 52-week highs and on first 3-week losing streak since February. WEEKLY cup with handle that started at very round 400 number that began in late 2021 now in jeopardy.
- FOUR straight positive earnings reactions up 1.4, 1.3, 2.7, and 5.2% on 7/25, 4/25, 1/31 and 10/25/22.
- Enter short with sell stop below bear flag.
- Entry MCO 333. Buy stop 345.
Good luck.
This article requires a Chartsmarter membership. Please click here to join.
"If you are brave enough to say goodbye, life will reward you with a new hello." Paulo Coelho
"Industrial" Strength:
- Of course, we know the Dow Jones Industrial Average is a shadow of itself for decades of old (just 5 industrial names left in the benchmark), and it is saying something that I am looking at this instrument to open this WEEK AHEAD Note. I would rather be discussing the Nasdaq or small caps, but it is where strength is emanating from and our focus is making money (from the long side here). AAPL we know has been soft, but remember this is a PRICE-weighted index so its effect will be negligible. On the other hand UNH at over 500 will have the largest impact and that stock is bull flagging, like the chart below of the Dow itself, just above the very round 500 number and a move above 515 carries a measured move to 580. Last week the Dow rose .6% displaying good relative strength as the Nasdaq fell 1.9%, the Russell 2000 by 1.6%, and the S&P 500 dropped .3%. This is certainly a sign that investors are becoming risk averse. And this has carried on over the last month as the Nasdaq, Russell, and S&P 500 UNCH with the Dow rising 3%.
Ten-Year Breakout:
- Last week produced a nice breakout for the ten-year yield and it registered its first consecutive WEEKLY CLOSES above the "round 4" number which has been an impediment. The previous time it was able to accomplish that was a 4-week run last October before topping out, and not surprisingly saw equities bottom. Markets are wobbly once again and this breakout I think will have a loud say on whether overall markets falter here. A clear sign will be how this breakout on the 10-year last week holds up, as we know the best breakouts tend to work right away. A rapid failure would be a clear sign that equity markets may return to their prior uptrend (technology), but if this move is for real softness may linger. My belief is that the TNX could head to the 5 area into year-end or Q1 '24. It is now starting to distance itself from the rising 50-day SMA and the last time it did that in the second half of 2021 witnessed a robust run for the first 10 months of 2022. Deja vu?
Crude Awakening:
- Is sentiment too bullish on energy? Probably as almost no one I speak to has done so with a negative tone. This is not a bad thing as consensus is usually correct I have found over my decades in markets. PRICE action will let one know when to get off the train. Remember trends once in motion tend to remain that way, more likely than they are to reverse. Looking at the XLE, which until recently was the dead last of the major S&P sectors on a YTD basis, has now leapfrogged financials, real estate, staples, healthcare, and utilities. Now it is the best of 11 groups over the last one-week, one-month and 3-month timeframes (and if you substituted the OIH and XOP it would be even stronger over the last 3 months). One can see the WEEKLY chart of WTI below took a pitstop last week after the spinning top candle, and bulls want to see some digestion. I still believe drillers are the place to be as companies continue to be creative and efficient at extracting oil, as opposed to exploration which are subject to onerous regulation. That is just my opinion, but PRICE action is confirming that belief. Above 85 pushes oil to 100, and will benefit all groups within, but the drillers should be overweighted.
Slippery Nasdaq Slope:
- The Nasdaq since recording a bearish evening star pattern on 7/20 losing more than 2% that session has felt vulnerable. Distribution was popping up just prior to that as warning signs were beginning on 6/16 with the bearish dark cloud cover candle. The last 3 days of last week all CLOSED hard upon their lows and 3 of the last 4 weeks have done that as well (each of the 3 decliners CLOSED roughly 400 handles off intraweek highs), hallmark bearish traits. The chart below shows how influential the New High-New Lows index has been with PRICE moving higher from the mid-March lows as the NAHL was registering higher lows. That has come to an abrupt halt, and recognizable Nasdaq new highs Friday were from MMYT and EXEL only (to be fair on the low list were CBRL and ETSY). Stocks on the Nasdaq above their 20-day highs are in the mid-30s and the benchmark is losing touch with its 50-day SMA. Sentiment is still bullish which gives me the feeling that lower PRICES are ahead. The question is will energy, financials, and healthcare take the baton and hold the market up until tech gets back on its feet?
Financials Toughen:
- The financials YTD have been a moribund one, hovering just above the UNCH mark, making it the 7th best of 11 major S&P sectors. Give it credit for acting better than most over the last month period as it has climbed to the 3rd best actor. This is a direct result of the top 3 holdings performing very well with BRK/B, the largest component just 2% off its all-time high. Surprising to me given that AAPL makes up nearly 50% of its investment vehicle (we know it is a rapid 10% off its 52-week highs, in just the last 2 weeks alone, after its first back-to-back WEEKLY losses of 2023). JPM and V are contributing to keeping the XLF afloat at this nice altitude as well. Even the KRE seems to be solidifying after July's 19% advance. Surely interest rates on the rise will be a tailwind, but let us take a look below at one long opportunity (from a European name, yes you heard that correctly), and a rating agency on the short side.
UBS:
- Swiss bank up 25% YTD and 41% over last one year period. Dividend yield of 2.4%.
- Name at 52-week highs and last week surged 7% taking out a 5-month WEEKLY cup base. Higher 4 of the last 5 weeks with all 5 CLOSING at or close to highs for the WEEKLY range.
- Earnings reactions mixed up .8 and 8.2% on 1/31 and 10/25/22 and fell 4.7 and 11.2% on 4/25 and 7/26/22.
- Enter on pullback into bull flag/cup with handle breakout.
- Entry UBS 22.75. Stop 21.75.
Moodys:
- Risk assessment play up 21% YTD and % over last one year period. Dividend yield of .9%.
- Name 7% off most recent 52-week highs and on first 3-week losing streak since February. WEEKLY cup with handle that started at very round 400 number that began in late 2021 now in jeopardy.
- FOUR straight positive earnings reactions up 1.4, 1.3, 2.7, and 5.2% on 7/25, 4/25, 1/31 and 10/25/22.
- Enter short with sell stop below bear flag.
- Entry MCO 333. Buy stop 345.
Good luck.