"The man who chases two rabbits catches neither." Confucius
Nasdaq Bides Its Time:
- Perhaps a better way of saying that would have been that it took a well-deserved break in August. The MONTHLY chart below of the Nasdaq could be looked at through whichever lens you lean on after last month's CLOSE. For the melancholy bears, they would point out the bearish hanging man candle (which could also be viewed as a bullish hammer) which did come in heavy volume, not typical for a summer doldrum August. In fact, looking at the MONTHLY chart below, I wonder about the reason for the volume expansion overall since the start of 2020. Getting back to the PRICE action, sanguine bulls would state it is now the sixth straight MONTHLY CLOSE at highs for the MONTHLY range. Those looking ahead to the rosy seasonality trends that traditionally start in Q4, and markets do tend to bottom in mid-September and we are basically there now. I think the best investors always pay attention to the downside and the WEEKLY chart is a bit concerning as it has fallen 5 of the last 8 weeks with all 5 decliners CLOSING at lows for the WEEKLY range. In my humble opinion, last week's lows must hold or we could easily trend lower into year-end and form a double bottom on the daily chart.

Crude Complications:
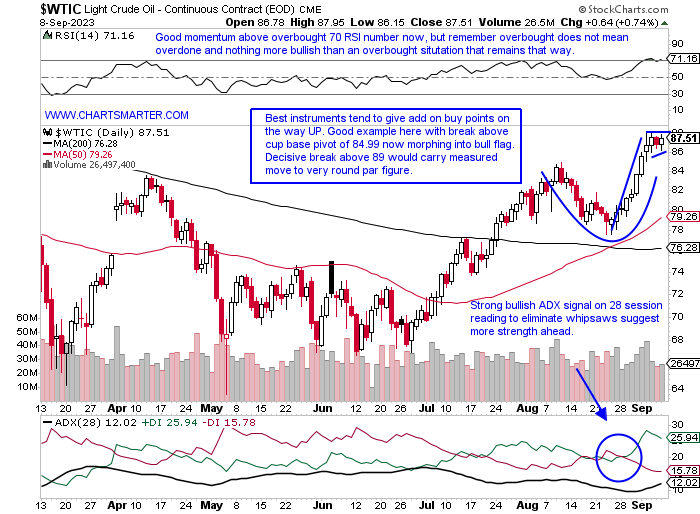
- Many have suggested that the market's recent unease can be partially attributed to the power of crude. Seems plausible and the daily chart below suggests that there may be a magnetic pull toward the very round 100 number for WTI into year-end if that break above the bull flag occurs. If one squints hard enough one can see the 200-day SMA, which many like to use to determine the long-term trend, is now starting to inch upward. The WEEKLY chart suggests this move can just be getting started as it has cleared horizontal resistance dating back to late 2022 just above the round 80 number. Of course, this has put a bid under the energy sector too as the XLE is now the best performing major S&P sector over the last 3-month period up almost 14%, doubling that advance of the second-best actor in the communication services. Inside the robust energy space, the equipment names are the firmest, although the OIH may be tiring as it recorded 4 consecutive spinning top candles. Some consolidation may be warranted until its next potential vault upward.
Yields Energetic:
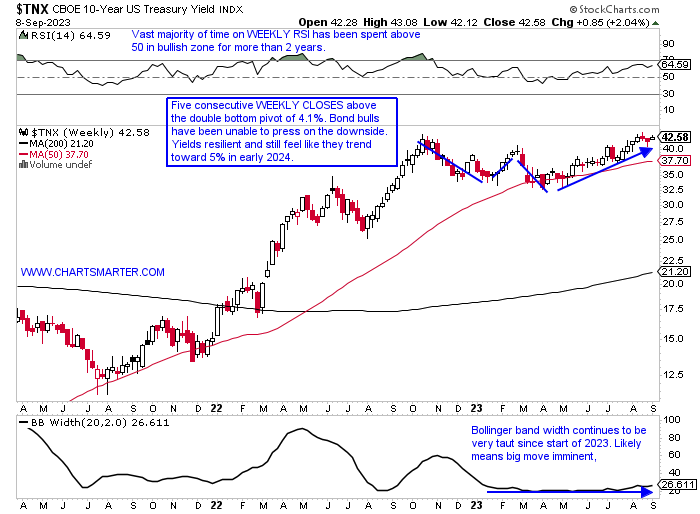
- The ten-year yield seems on an unrelenting trek higher. Is the third time the charm feeling comfortable above the "round" 4 figure? It was able to record 4 WEEKLY CLOSES above the level to begin Q4 '22, was north of 4 for back-to-back weeks this February and March (but none were able to CLOSE above 4), and presently has registered six straight WEEKLY CLOSES above the number. More importantly, it remains above the double bottom pivot at 4.1%. Now we know the best breakouts tend to work right away so we do not want to see much lingering here and the sooner the better to begin its potential move toward the 5 area. There are reasons to believe that this move will resolve higher, as for almost the last year it has been trading"sideways" being preceded by the visually impressive 12-week winning streak between August and October. Keep in mind rising energy PRICES and rising yields tend to go hand in hand, so again there is a trio of macro headwinds the market is going to have to navigate into year-end.
Dollar Dilemma:
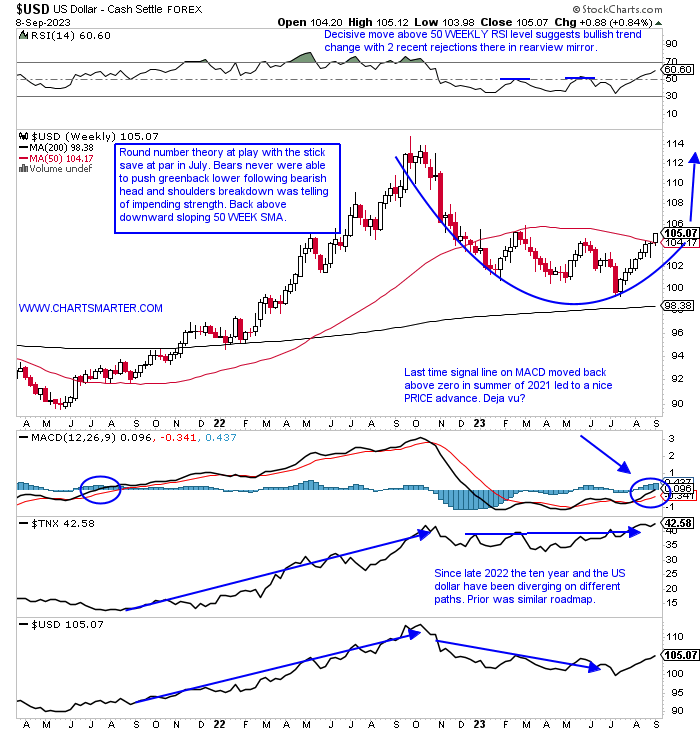
- The greenback continues to confound which is what markets tend to do best. It is now on an 8-week winning streak and the WEEKLY chart below shows last week was the first to CLOSE above the 50 WEEK SMA. To try and curb the enthusiasm somewhat, of the three macro impediments we discuss here with oil, rates, and the dollar, it is the latter that is the furthest from its late 2022 highs. As shorts continue to unwind their bearish positions the dollar is building the right side of a cup base. Is the dollar ready to resume its close traditional correlation to the 10-year yield chart with the WEEKLY chart here showing how intertwined they were from the summer of 2021 to late 2022? If history is correct and the dollar plays havoc look for this nascent dollar rally to persist. This is yet another thing that the overall markets have to worry about going forward, not to mention the international stocks that drive a good chunk of their revenue, like a KO which is on a 4-week losing streak.
All Eyes On The General:
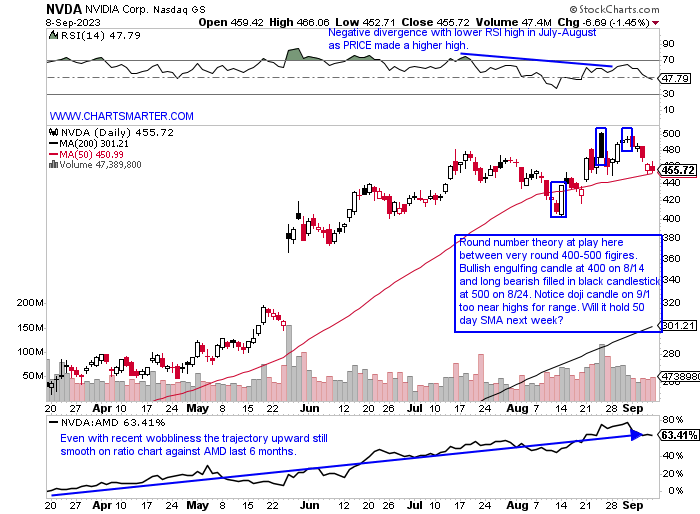
- The semiconductors displayed heaviness last week with the SMH dropping more than 3% for the fourth time now in the last 12 weeks. The chorus of bears singing of the double top near 160, from the present and late 2022, will be getting louder the longer the ETF remains below that level. Perhaps one of the most worrisome WEEKLY candles for the fund was the bearish shooting star the week-ending 9/25 that rose 2%, well off intraweek highs in the strongest WEEKLY volume in 6 months. Below is a chart that is mostly responsible for NVDA, its largest holding at nearly 21%. So far in 2023, it has declined on a WEEKLY basis just 10 times, and most concerning is the velocity of selling recently. For example, the first 6 WEEKLY losses in 2023 were somewhat contained dropping between 1-4% and since then the WEEKLY losses have become more pronounced (the weeks ending 8/11 and 9/8 slipped 8.6 and 6%). Moreover, the week ending 8/25 CLOSED off almost 10% from intraweek highs in the greatest WEEKLY volume in 3 1/2 years indicating stalling action to me at the very round 500 number. Let us take a look at two more promising tech plays below in INTC and UBER.
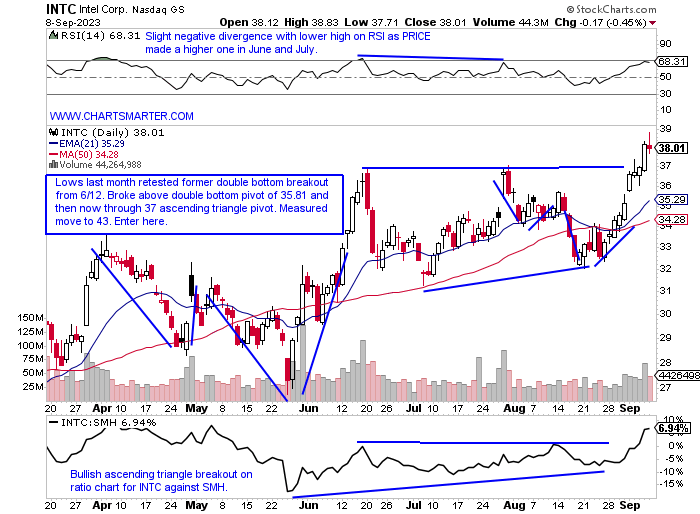
Intel:
- "Old tech" semi-play up 44% YTD and 24% over last one-year period. Dividend yield of 2.6%.
- Name 2% off most recent 52-week highs and solid relative strength last week rising almost 4% as the SMH fell by nearly the same amount, and that was on the back of a 10% gain the week prior. On 3 week win streak and interestingly has not recorded a 4-week win streak since late 2021-early 2022).
- Earnings reactions mostly higher up 6.6, 4, and 10.7% on 7/28, 4/28, and 10/28/22, and fell 6.4% on 1/27.
- Enter after break above bullish ascending triangle.
- Entry INTC here. Stop 36.
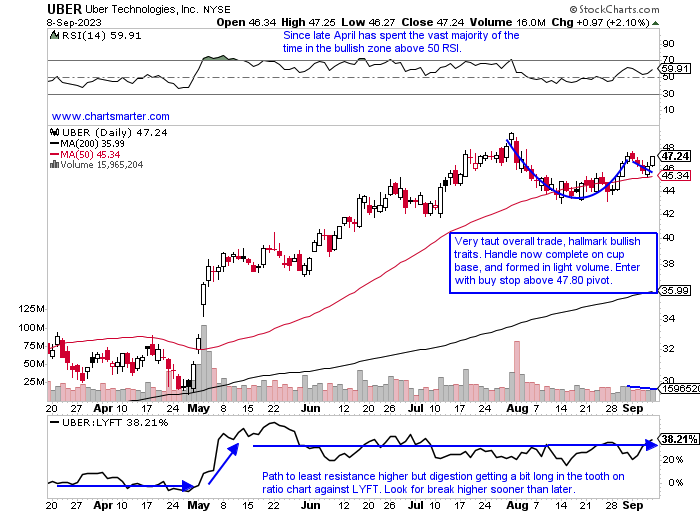
Uber:
- Software play up 91% YTD and 54% over last one year period.
- Name 5% off most recent 52-week highs and has absorbed the big WEEKLY loss of 6.1% ending 8/4 in double average WEEKLY volume well recently. Big overall run off very round 20 number from last July.
- Earnings reactions mostly higher up 11.5, 5.5, and 12% on 5/2, 2/8, and 11/1/22 before loss of 5.7% on 8/1.
- Enter with buy stop above cup with handle.
- Entry UBER 47.80. Stop 45.25.
Good luck.
This article requires a Chartsmarter membership. Please click here to join.
"The man who chases two rabbits catches neither." Confucius
Nasdaq Bides Its Time:
- Perhaps a better way of saying that would have been that it took a well-deserved break in August. The MONTHLY chart below of the Nasdaq could be looked at through whichever lens you lean on after last month's CLOSE. For the melancholy bears, they would point out the bearish hanging man candle (which could also be viewed as a bullish hammer) which did come in heavy volume, not typical for a summer doldrum August. In fact, looking at the MONTHLY chart below, I wonder about the reason for the volume expansion overall since the start of 2020. Getting back to the PRICE action, sanguine bulls would state it is now the sixth straight MONTHLY CLOSE at highs for the MONTHLY range. Those looking ahead to the rosy seasonality trends that traditionally start in Q4, and markets do tend to bottom in mid-September and we are basically there now. I think the best investors always pay attention to the downside and the WEEKLY chart is a bit concerning as it has fallen 5 of the last 8 weeks with all 5 decliners CLOSING at lows for the WEEKLY range. In my humble opinion, last week's lows must hold or we could easily trend lower into year-end and form a double bottom on the daily chart.
Crude Complications:
- Many have suggested that the market's recent unease can be partially attributed to the power of crude. Seems plausible and the daily chart below suggests that there may be a magnetic pull toward the very round 100 number for WTI into year-end if that break above the bull flag occurs. If one squints hard enough one can see the 200-day SMA, which many like to use to determine the long-term trend, is now starting to inch upward. The WEEKLY chart suggests this move can just be getting started as it has cleared horizontal resistance dating back to late 2022 just above the round 80 number. Of course, this has put a bid under the energy sector too as the XLE is now the best performing major S&P sector over the last 3-month period up almost 14%, doubling that advance of the second-best actor in the communication services. Inside the robust energy space, the equipment names are the firmest, although the OIH may be tiring as it recorded 4 consecutive spinning top candles. Some consolidation may be warranted until its next potential vault upward.
Yields Energetic:
- The ten-year yield seems on an unrelenting trek higher. Is the third time the charm feeling comfortable above the "round" 4 figure? It was able to record 4 WEEKLY CLOSES above the level to begin Q4 '22, was north of 4 for back-to-back weeks this February and March (but none were able to CLOSE above 4), and presently has registered six straight WEEKLY CLOSES above the number. More importantly, it remains above the double bottom pivot at 4.1%. Now we know the best breakouts tend to work right away so we do not want to see much lingering here and the sooner the better to begin its potential move toward the 5 area. There are reasons to believe that this move will resolve higher, as for almost the last year it has been trading"sideways" being preceded by the visually impressive 12-week winning streak between August and October. Keep in mind rising energy PRICES and rising yields tend to go hand in hand, so again there is a trio of macro headwinds the market is going to have to navigate into year-end.
Dollar Dilemma:
- The greenback continues to confound which is what markets tend to do best. It is now on an 8-week winning streak and the WEEKLY chart below shows last week was the first to CLOSE above the 50 WEEK SMA. To try and curb the enthusiasm somewhat, of the three macro impediments we discuss here with oil, rates, and the dollar, it is the latter that is the furthest from its late 2022 highs. As shorts continue to unwind their bearish positions the dollar is building the right side of a cup base. Is the dollar ready to resume its close traditional correlation to the 10-year yield chart with the WEEKLY chart here showing how intertwined they were from the summer of 2021 to late 2022? If history is correct and the dollar plays havoc look for this nascent dollar rally to persist. This is yet another thing that the overall markets have to worry about going forward, not to mention the international stocks that drive a good chunk of their revenue, like a KO which is on a 4-week losing streak.
All Eyes On The General:
- The semiconductors displayed heaviness last week with the SMH dropping more than 3% for the fourth time now in the last 12 weeks. The chorus of bears singing of the double top near 160, from the present and late 2022, will be getting louder the longer the ETF remains below that level. Perhaps one of the most worrisome WEEKLY candles for the fund was the bearish shooting star the week-ending 9/25 that rose 2%, well off intraweek highs in the strongest WEEKLY volume in 6 months. Below is a chart that is mostly responsible for NVDA, its largest holding at nearly 21%. So far in 2023, it has declined on a WEEKLY basis just 10 times, and most concerning is the velocity of selling recently. For example, the first 6 WEEKLY losses in 2023 were somewhat contained dropping between 1-4% and since then the WEEKLY losses have become more pronounced (the weeks ending 8/11 and 9/8 slipped 8.6 and 6%). Moreover, the week ending 8/25 CLOSED off almost 10% from intraweek highs in the greatest WEEKLY volume in 3 1/2 years indicating stalling action to me at the very round 500 number. Let us take a look at two more promising tech plays below in INTC and UBER.
Intel:
- "Old tech" semi-play up 44% YTD and 24% over last one-year period. Dividend yield of 2.6%.
- Name 2% off most recent 52-week highs and solid relative strength last week rising almost 4% as the SMH fell by nearly the same amount, and that was on the back of a 10% gain the week prior. On 3 week win streak and interestingly has not recorded a 4-week win streak since late 2021-early 2022).
- Earnings reactions mostly higher up 6.6, 4, and 10.7% on 7/28, 4/28, and 10/28/22, and fell 6.4% on 1/27.
- Enter after break above bullish ascending triangle.
- Entry INTC here. Stop 36.
Uber:
- Software play up 91% YTD and 54% over last one year period.
- Name 5% off most recent 52-week highs and has absorbed the big WEEKLY loss of 6.1% ending 8/4 in double average WEEKLY volume well recently. Big overall run off very round 20 number from last July.
- Earnings reactions mostly higher up 11.5, 5.5, and 12% on 5/2, 2/8, and 11/1/22 before loss of 5.7% on 8/1.
- Enter with buy stop above cup with handle.
- Entry UBER 47.80. Stop 45.25.
Good luck.