"There is no way around the hard work. Embrace it." - Roger Federer
Monthly Suspense:
- With everyone on edge over a possible government shutdown this weekend, let us relax and take a look at the MONTHLY technical picture for the most widely followed benchmark. If bullish seasonality kicks in to start Q4, these current back-to-back MONTHLY losses could be considered a cup with handle pattern. In my opinion then the lows of 4200, a bullish ascending triangle breakout on the WEEKLY chart need to hold. Below one can see how rare 3 month losing streaks are, and the last 2 Octobers rose robustly by 8 and 7% respectively in 2022 and 2021. For the less sanguine outlook, if that 4200 level does not hold a move back toward the rising 50 MONTH SMA comes into play, which could be near the very round 4000 number as PRICE catches down. One aspect of the chart below that is concerning is the possible false signal on the MONTHLY bullish MACD crossover that just happened recently. If that were to break back below it looks very similar to the rocky behavior during COVID. That could be the catalyst for a 7% plunge lower.

Municipals Wavering:
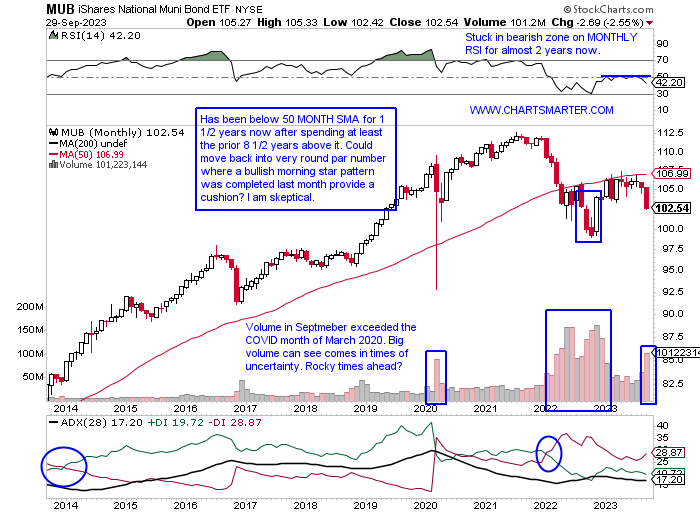
- With everyone's eyes on the bond market, and rightfully so as its size dwarfs the equity market, the action on the MUB caught my eye. Yes, the MONTHLY bull flag breakout on the 10-year suggests much higher PRICES (yields) there (notice the trade at or near overbought 70 RSI for almost 2 years demonstrating overbought does not mean overdone), but the action on the MONTHLY chart below of the MUB suggests some volatility may be forthcoming. Notice the volume in September was greater than the height of COVID in March 2020 and that could be the start of something. The volatility that came throughout 2022 was accompanied by a much larger MONTHLY volume. I am a round number theory believer and although the MUB has almost reached its measured move on the bear flag breakdown on the daily I think par or below could be in store for the ETF. This is concerning because this fixed-income ETF has been holding up better than the TLT or LQD since late 2022. I looked over the top holdings in the MUB and the bonds are from states like New York, California, and New Jersey each having their own set of fiscal issues.
Timberrrrrrrrrr:
- I may be dating myself but I recall as a child saying "timberrrrrr" as something was about to collapse. Is that phrase becoming prescient once again as an older adult in predicting when the S&P 500 may be chopped again, pun intended? From the PRICE chart below notice how the red line representing lumber started a drawdown as the S&P 500 continued its uptrend in both July and August. But very quickly the S&P 500 followed lower in PRICE. A coincidence, or not? Of course, we will not know going forward until hindsight but give lumber credit for forecasting an S&P 500 decline. In the coming weeks it may make sense to watch lumber as it broke below a bearish descending triangle, but so far has proved to be a bear trap as seen on the daily chart here. A break back below the 490 pivot, with the impending death cross, could see it fill in that large gap below from the 5/15 session, and therefore pull the S&P 500 with it.

Biotech Blues:
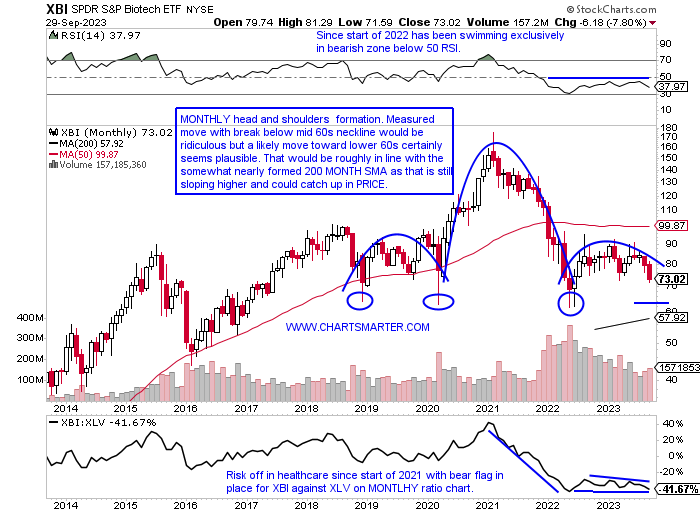
- As we get the benefit of MONTHLY candles that formed last Friday perhaps one of the more ominous charts is that of the XBI. Since May 2022 it has done very little to reclaim any of the PRICE damage that occurred during a 12 of 16-month losing streak that began with a bearish MONTLHY shooting star candle in February 2021. In fact, it is now curling lower again and looks poised to move toward the lower 60s area where it found bids in December 2018, March 2020, and May-June 2022, as we know PRICE has memory. The daily chart is sporting a bear flag and a move below the 72 pivot would carry a measured move to 64 (notice the bearish engulfing candle right at the very round 90 number from 6/14 setting the downtrend in motion). Another chart that suggests the XBI could be heading lower is the "risk off" flavor of the daily ratio comparing the XBI to the more mature biotechs in the IBB. Top holding AMGN is one of the reasons for the more mature IBB's outperformance up 17% over the last one-year period and pays a dividend yield better than 3%.
Financial Follies:
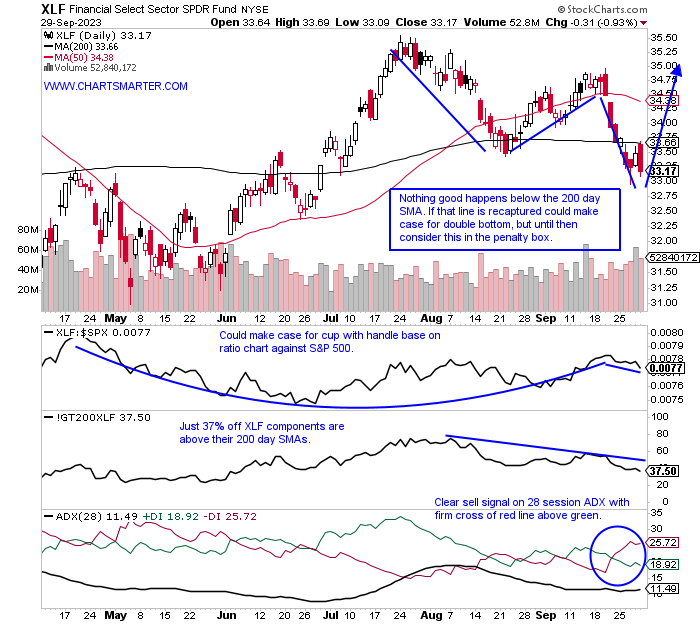
- The financials via the XLF are one of five major S&P sectors in the red YTD with one quarter left, and the weight on the ETF feels heavier in recent weeks. Over the last 2 weeks the fund has dropped by a total of 5% and on the WEEKLY chart resistance at the top of the symmetrical triangle had its downtrend resume (notice on the chart that Bollinger band width is coiling as it becomes muted suggesting that a big move is imminent too). It shows a triple bottom near the round 30 number but a break below the 32 pivot in the triangle would carry a measured move to 21. Top holding BRKB followed through lower this week slipping 2.7%, after the prior week recorded a bearish engulfing candle. Other lesser-followed names like IEP are still 64% from most recent 52-week highs and is hanging on to the very round 20 number. C is attempting to hold the round 40 number where it has traded in a rough range between 40-50 for one and a half years (the path of least resistance is lower as it was preceded by a downtrend). This group feels cumbersome and let us look at two names that are headed in different directions in APO and BAC.
Apollo Global:
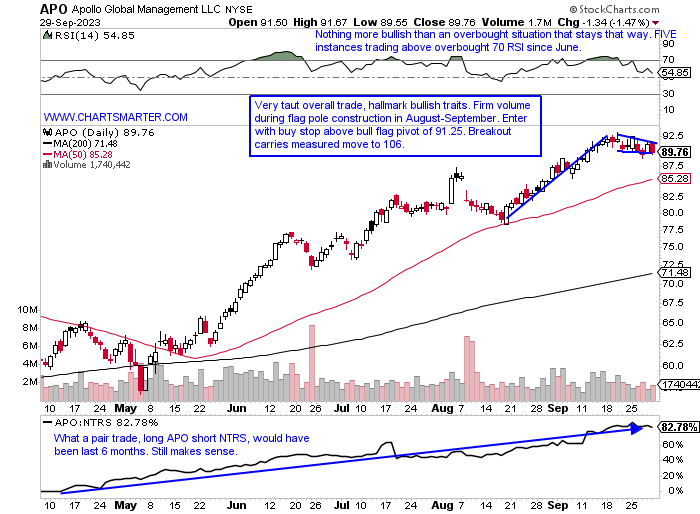
- Asset manager up 41% YTD and 88% over last one year period. Dividend yield of 1.9%.
- Name "just" 4% off most recent 52-week highs and has advanced 15 of the last 21 weeks. Distribution weeks (strong WEEKLY losses in well above average WEEKLY volume) in 2023 the weeks ending 3/10, 3/17, and 8/11 that fell 17.5, 6.2, and 5.5% have been unable to derail its progress.
- Earnings reactions mostly higher up 5.7, .7, and 3.9% on 8/3, 5/9 and 11/2/22 and fell 7.4% on 2/9.
- Enter with buy stop above bull flag.
- Entry APO 91.25. Stop 88.
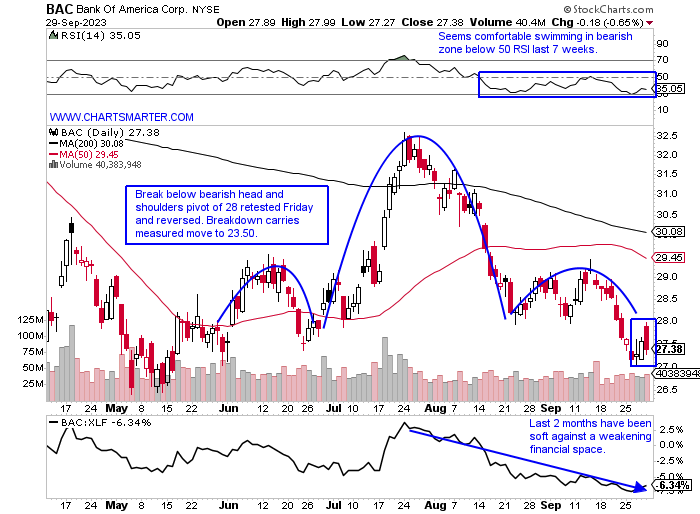
Bank of America:
- Bank laggard down 17% YTD and 11% over last one year period. Dividend yield of 3.5%.
- Name 29% off most recent 52-week highs (peers C and WFC are 23 and 16% off their respective annual peaks) and is lower 8 of the last 10 weeks, with 7 of the 8 decliners CLOSING at or in the lower half of the WEEKLY range.
- FOUR straight positive earnings reactions (EIGHT in total) up 4.4, .6, 2.2, and 6% on 7/18, 4/18, 1/13 and 10/17/22.
- Enter short after retest of break below head and shoulders.
- Entry BAC here. Buy stop 29.25.
Good luck.
This article requires a Chartsmarter membership. Please click here to join.
"There is no way around the hard work. Embrace it." - Roger Federer
Monthly Suspense:
- With everyone on edge over a possible government shutdown this weekend, let us relax and take a look at the MONTHLY technical picture for the most widely followed benchmark. If bullish seasonality kicks in to start Q4, these current back-to-back MONTHLY losses could be considered a cup with handle pattern. In my opinion then the lows of 4200, a bullish ascending triangle breakout on the WEEKLY chart need to hold. Below one can see how rare 3 month losing streaks are, and the last 2 Octobers rose robustly by 8 and 7% respectively in 2022 and 2021. For the less sanguine outlook, if that 4200 level does not hold a move back toward the rising 50 MONTH SMA comes into play, which could be near the very round 4000 number as PRICE catches down. One aspect of the chart below that is concerning is the possible false signal on the MONTHLY bullish MACD crossover that just happened recently. If that were to break back below it looks very similar to the rocky behavior during COVID. That could be the catalyst for a 7% plunge lower.
Municipals Wavering:
- With everyone's eyes on the bond market, and rightfully so as its size dwarfs the equity market, the action on the MUB caught my eye. Yes, the MONTHLY bull flag breakout on the 10-year suggests much higher PRICES (yields) there (notice the trade at or near overbought 70 RSI for almost 2 years demonstrating overbought does not mean overdone), but the action on the MONTHLY chart below of the MUB suggests some volatility may be forthcoming. Notice the volume in September was greater than the height of COVID in March 2020 and that could be the start of something. The volatility that came throughout 2022 was accompanied by a much larger MONTHLY volume. I am a round number theory believer and although the MUB has almost reached its measured move on the bear flag breakdown on the daily I think par or below could be in store for the ETF. This is concerning because this fixed-income ETF has been holding up better than the TLT or LQD since late 2022. I looked over the top holdings in the MUB and the bonds are from states like New York, California, and New Jersey each having their own set of fiscal issues.
Timberrrrrrrrrr:
- I may be dating myself but I recall as a child saying "timberrrrrr" as something was about to collapse. Is that phrase becoming prescient once again as an older adult in predicting when the S&P 500 may be chopped again, pun intended? From the PRICE chart below notice how the red line representing lumber started a drawdown as the S&P 500 continued its uptrend in both July and August. But very quickly the S&P 500 followed lower in PRICE. A coincidence, or not? Of course, we will not know going forward until hindsight but give lumber credit for forecasting an S&P 500 decline. In the coming weeks it may make sense to watch lumber as it broke below a bearish descending triangle, but so far has proved to be a bear trap as seen on the daily chart here. A break back below the 490 pivot, with the impending death cross, could see it fill in that large gap below from the 5/15 session, and therefore pull the S&P 500 with it.
Biotech Blues:
- As we get the benefit of MONTHLY candles that formed last Friday perhaps one of the more ominous charts is that of the XBI. Since May 2022 it has done very little to reclaim any of the PRICE damage that occurred during a 12 of 16-month losing streak that began with a bearish MONTLHY shooting star candle in February 2021. In fact, it is now curling lower again and looks poised to move toward the lower 60s area where it found bids in December 2018, March 2020, and May-June 2022, as we know PRICE has memory. The daily chart is sporting a bear flag and a move below the 72 pivot would carry a measured move to 64 (notice the bearish engulfing candle right at the very round 90 number from 6/14 setting the downtrend in motion). Another chart that suggests the XBI could be heading lower is the "risk off" flavor of the daily ratio comparing the XBI to the more mature biotechs in the IBB. Top holding AMGN is one of the reasons for the more mature IBB's outperformance up 17% over the last one-year period and pays a dividend yield better than 3%.
Financial Follies:
- The financials via the XLF are one of five major S&P sectors in the red YTD with one quarter left, and the weight on the ETF feels heavier in recent weeks. Over the last 2 weeks the fund has dropped by a total of 5% and on the WEEKLY chart resistance at the top of the symmetrical triangle had its downtrend resume (notice on the chart that Bollinger band width is coiling as it becomes muted suggesting that a big move is imminent too). It shows a triple bottom near the round 30 number but a break below the 32 pivot in the triangle would carry a measured move to 21. Top holding BRKB followed through lower this week slipping 2.7%, after the prior week recorded a bearish engulfing candle. Other lesser-followed names like IEP are still 64% from most recent 52-week highs and is hanging on to the very round 20 number. C is attempting to hold the round 40 number where it has traded in a rough range between 40-50 for one and a half years (the path of least resistance is lower as it was preceded by a downtrend). This group feels cumbersome and let us look at two names that are headed in different directions in APO and BAC.
Apollo Global:
- Asset manager up 41% YTD and 88% over last one year period. Dividend yield of 1.9%.
- Name "just" 4% off most recent 52-week highs and has advanced 15 of the last 21 weeks. Distribution weeks (strong WEEKLY losses in well above average WEEKLY volume) in 2023 the weeks ending 3/10, 3/17, and 8/11 that fell 17.5, 6.2, and 5.5% have been unable to derail its progress.
- Earnings reactions mostly higher up 5.7, .7, and 3.9% on 8/3, 5/9 and 11/2/22 and fell 7.4% on 2/9.
- Enter with buy stop above bull flag.
- Entry APO 91.25. Stop 88.
Bank of America:
- Bank laggard down 17% YTD and 11% over last one year period. Dividend yield of 3.5%.
- Name 29% off most recent 52-week highs (peers C and WFC are 23 and 16% off their respective annual peaks) and is lower 8 of the last 10 weeks, with 7 of the 8 decliners CLOSING at or in the lower half of the WEEKLY range.
- FOUR straight positive earnings reactions (EIGHT in total) up 4.4, .6, 2.2, and 6% on 7/18, 4/18, 1/13 and 10/17/22.
- Enter short after retest of break below head and shoulders.
- Entry BAC here. Buy stop 29.25.
Good luck.