"Change Begins at the End of Your Comfort Zone."
Change In Character?
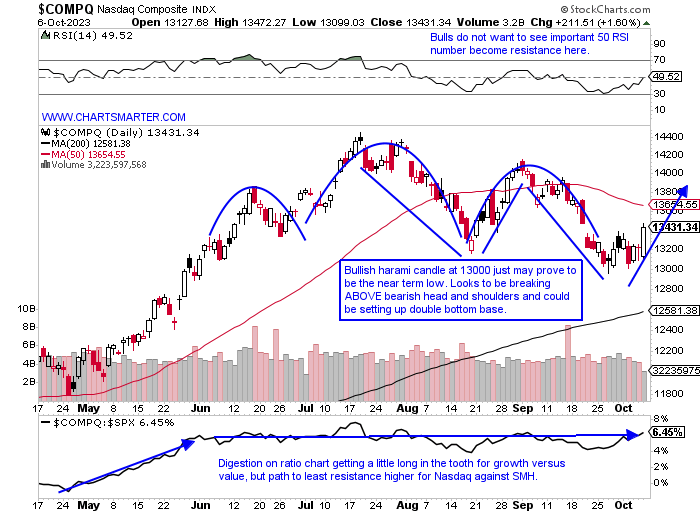
- The Nasdaq rose "just" 1.6% this past week, which is somewhat pedestrian, and seems tame after the big reversal Friday after the employment number. Sure the 10-year backed off just below the 5 number and that helped the "long duration" tech stocks. The tech-heavy benchmark CLOSED more than 300 handles from intraday lows and reacted well after Thursday's doji candle. I was concerned about it lingering near the 13000 number late this week but that issue was cleared up quickly with Friday's behavior. The WEEKLY chart looks constructive and it may be forming that handle on its long cup base after all. The week ending 9/29 did record a spinning top which is a bottoming candle and notice too that there is a good chance that prior resistance at the 13000 on the WEEKLY has now turned into support. Software via the IGV rose 2.7% Friday, its third-best gain of 2023, and it has been pulling the load more than the SMH. The IGV never breached its August lows, which the SMH did do. Of course, AAPL will have a huge say as it is the largest component in most tech-related instruments and it is higher 6 of the last 7 sessions. Volume could be more energetic, but it is common for this to occur at the start of a potential nascent turnaround as nonbelievers tend to play catch-up once the move gains traction.
Golden Buttress:
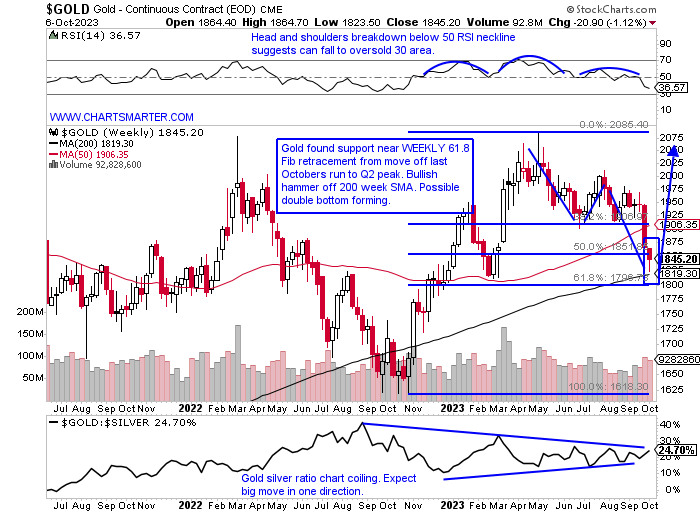
- There is no question Gold has been in a freefall. Friday ended a 10-session losing streak with a hammer-like candle, and with Tuesday-Thursday recording spinning tops it suggested selling pressure was drying up (notice the bearish death cross late last week, but understand that those occur after most of the technical damage is already done). That is where technical analysis comes into play as it is perilous attempting to catch a falling knife. One should await a positive catalyst, through a bullish candle that offers one good risk/reward to play against. Below is the WEEKLY chart of Gold and last week registered a bullish hammer off its rising 200 WEEK SMA. The week prior slumped more than 3% after the preceding 3 weeks prior that all CLOSED very taut within less than $4 of each other and we know that type of consolidation often produces very large moves. I think if last week's lows of 1823 hold we could see a move back toward 2000 into year end. Keep an eye on NEM which easily posted the best WEEKLY gain from any of the large-cap miners up 4% last week. It may have recorded a double bottom here with the last time recording a WEEKLY bullish hammer candle 11 months ago before an energetic run upward over the next 3 months.
Greenback Flashes the Doji:
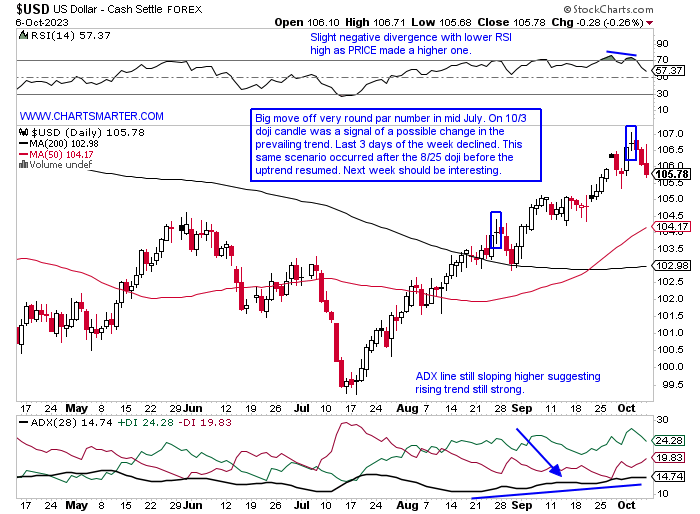
- Two of the three obstacles that have been keeping the equity markets hostage feel like this week may be undergoing a possible trend change. Crude has sunk the dollar feels heavy and the 10-year looks like it may follow suit. As Meatloaf would have said "Two out of three ain't bad." The chart of the dollar below shows the doji candle that was recorded on 10/3 may have declared a short-term top. The only caveat is this happened in late August as well and a very similar situation happened with a 3-session losing streak immediately following. It was comforted by the rising 200-day SMA before quickly resuming its move higher. The greenback is a bit more extended here and the fact that the doji from 8/25 was also a double top from late May shows that in a firm uptrend, bearish candles take less importance. That 200-day SMA is just starting to curl higher as well and the WEEKLY chart did register a bearish shooting star last week after the prior 10 of 11 weeks advanced. I feel a move back toward 104 makes sense to see if that prior double top (ceiling) is now support.
Widow Maker Strikes Again:
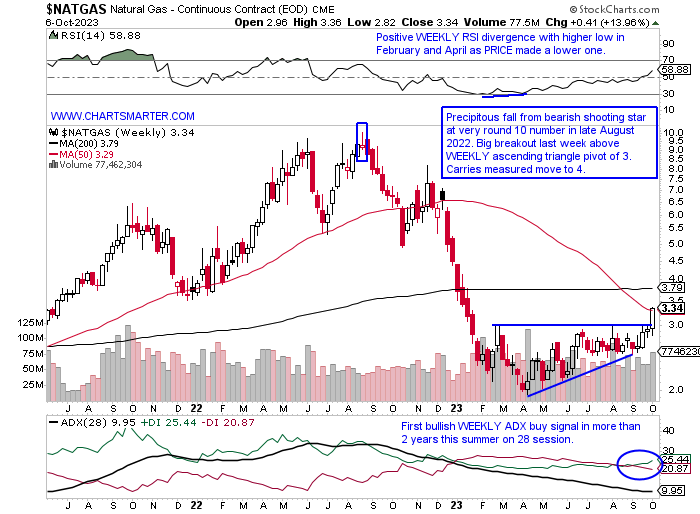
- With all the focus on crude oil this week, natural gas decided to sneakily produce a surge higher. Last week witnessed its first 4-week win streak since last summer, and more importantly, broke above the "round" 3 number on the WEEKLY chart below. The last week of February CLOSED one penny above $3, but then over the next 6 weeks, it sunk quickly to $2. Since then it has been making higher lows and the first week of August again touched the $3 level, but that week reversed CLOSING more than 10% from intraweek highs. Last week Natural Gas rose 14% and broke above a bullish WEEKLY ascending triangle pattern. Look for a measured move to 4 into year-end. The daily time frame paints a bullish picture as well with a move through a bull flag and notice the volume surge and how it CLOSED near highs for the daily range on both Thursday and Friday. The breakout also negated a bearish engulfing candle at 3 from the 8/10 session. The former ceiling at the round 3 number, is very likely support going forward.
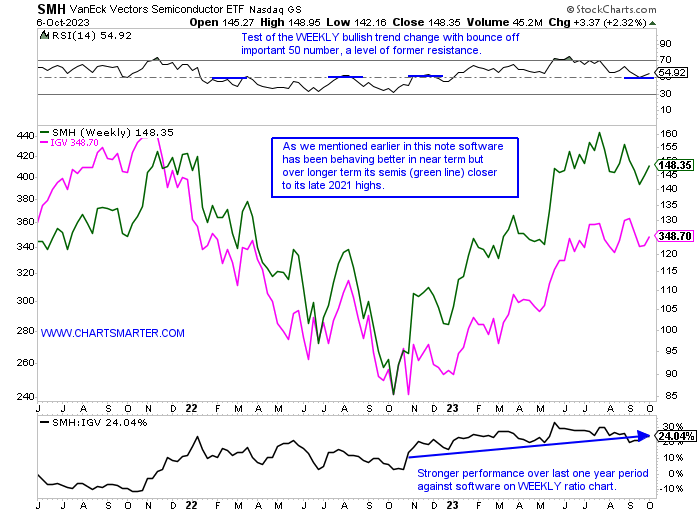
Semis To Challenge Double Top?
- We did state earlier how software has been acting better than semis as of late. Over the last 3 month period as the SMH is UNCH, the IGV has gained 3%. If we look at the overall picture going back almost 2 years to November 2021 however we see that the SMH is much closer to that peak than the IGV is. I have always stated that competition is a good thing, in real life and markets, and perhaps this will instill a move upward from software, but the WEEKLY chart if it can hold here for the SMH is looking more like a cup with handle, than a double top. The base being 2 years in duration makes a potential breakout, a strong one as the saying goes the longer the base the greater the space. Rare doji candles were influential on the daily chart calling short-term tops and bottoms at 140 and 160 thus far. All this being said I think semis showing longer-term strength deserve to be the focus. If markets continue to gain from here a rising tide will lift most boats, and let us look at a couple of semi-names that never wavered during the recent selling.
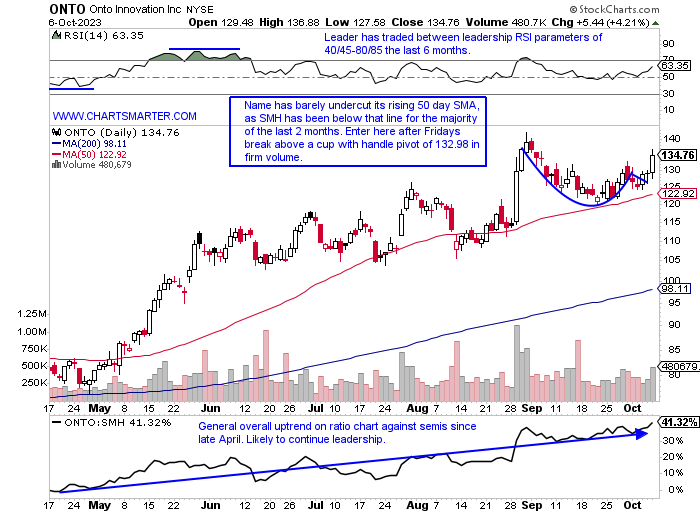
Onto Innovation:
- Semi play up 98% YTD and 88% over last one year period.
- Name 5% off most recent 52-week highs and in the upper half of the WEEKLY range that produced a huge 20% gain ending 9/1. Excellent follow-through from break above WEEKLY cup base at very round par number in May.
- Earnings reactions mixed up 5.1 and 3.2% on 5/5 and 10/28/22 and down 2.8 and 2.1% on 8/11 and 2/10.
- Enter after break above cup with handle pivot.
- Entry ONTO here. Stop 128.50 (REPORTS 10/26 after close).
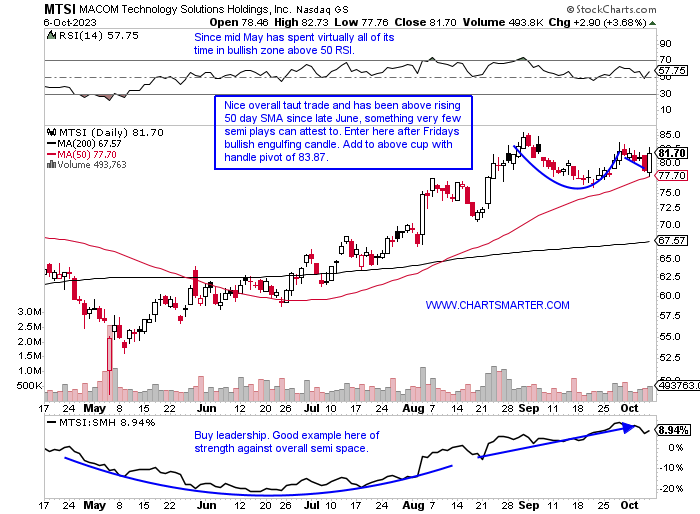
MACOM Technology:
- Semi play up 30% YTD and 41% over last one year period.
- Name 4% off most recent 52-week highs and this name ABOVE double top on WEEKLY chart at the round 80 number, moving above that pattern which the SMH has not yet. Respect.
- Earnings reactions mixed up 11.1 and 4.9% on 8/3 and 11/3/22 fell 3.8 and 2.9% on 5/4 and 2/2.
- Enter after bullish engulfing candle at rising 50-day SMA.
- Entry MTSI here. Stop 77.
Good luck.
This article requires a Chartsmarter membership. Please click here to join.
"Change Begins at the End of Your Comfort Zone."
Change In Character?
- The Nasdaq rose "just" 1.6% this past week, which is somewhat pedestrian, and seems tame after the big reversal Friday after the employment number. Sure the 10-year backed off just below the 5 number and that helped the "long duration" tech stocks. The tech-heavy benchmark CLOSED more than 300 handles from intraday lows and reacted well after Thursday's doji candle. I was concerned about it lingering near the 13000 number late this week but that issue was cleared up quickly with Friday's behavior. The WEEKLY chart looks constructive and it may be forming that handle on its long cup base after all. The week ending 9/29 did record a spinning top which is a bottoming candle and notice too that there is a good chance that prior resistance at the 13000 on the WEEKLY has now turned into support. Software via the IGV rose 2.7% Friday, its third-best gain of 2023, and it has been pulling the load more than the SMH. The IGV never breached its August lows, which the SMH did do. Of course, AAPL will have a huge say as it is the largest component in most tech-related instruments and it is higher 6 of the last 7 sessions. Volume could be more energetic, but it is common for this to occur at the start of a potential nascent turnaround as nonbelievers tend to play catch-up once the move gains traction.
Golden Buttress:
- There is no question Gold has been in a freefall. Friday ended a 10-session losing streak with a hammer-like candle, and with Tuesday-Thursday recording spinning tops it suggested selling pressure was drying up (notice the bearish death cross late last week, but understand that those occur after most of the technical damage is already done). That is where technical analysis comes into play as it is perilous attempting to catch a falling knife. One should await a positive catalyst, through a bullish candle that offers one good risk/reward to play against. Below is the WEEKLY chart of Gold and last week registered a bullish hammer off its rising 200 WEEK SMA. The week prior slumped more than 3% after the preceding 3 weeks prior that all CLOSED very taut within less than $4 of each other and we know that type of consolidation often produces very large moves. I think if last week's lows of 1823 hold we could see a move back toward 2000 into year end. Keep an eye on NEM which easily posted the best WEEKLY gain from any of the large-cap miners up 4% last week. It may have recorded a double bottom here with the last time recording a WEEKLY bullish hammer candle 11 months ago before an energetic run upward over the next 3 months.
Greenback Flashes the Doji:
- Two of the three obstacles that have been keeping the equity markets hostage feel like this week may be undergoing a possible trend change. Crude has sunk the dollar feels heavy and the 10-year looks like it may follow suit. As Meatloaf would have said "Two out of three ain't bad." The chart of the dollar below shows the doji candle that was recorded on 10/3 may have declared a short-term top. The only caveat is this happened in late August as well and a very similar situation happened with a 3-session losing streak immediately following. It was comforted by the rising 200-day SMA before quickly resuming its move higher. The greenback is a bit more extended here and the fact that the doji from 8/25 was also a double top from late May shows that in a firm uptrend, bearish candles take less importance. That 200-day SMA is just starting to curl higher as well and the WEEKLY chart did register a bearish shooting star last week after the prior 10 of 11 weeks advanced. I feel a move back toward 104 makes sense to see if that prior double top (ceiling) is now support.
Widow Maker Strikes Again:
- With all the focus on crude oil this week, natural gas decided to sneakily produce a surge higher. Last week witnessed its first 4-week win streak since last summer, and more importantly, broke above the "round" 3 number on the WEEKLY chart below. The last week of February CLOSED one penny above $3, but then over the next 6 weeks, it sunk quickly to $2. Since then it has been making higher lows and the first week of August again touched the $3 level, but that week reversed CLOSING more than 10% from intraweek highs. Last week Natural Gas rose 14% and broke above a bullish WEEKLY ascending triangle pattern. Look for a measured move to 4 into year-end. The daily time frame paints a bullish picture as well with a move through a bull flag and notice the volume surge and how it CLOSED near highs for the daily range on both Thursday and Friday. The breakout also negated a bearish engulfing candle at 3 from the 8/10 session. The former ceiling at the round 3 number, is very likely support going forward.
Semis To Challenge Double Top?
- We did state earlier how software has been acting better than semis as of late. Over the last 3 month period as the SMH is UNCH, the IGV has gained 3%. If we look at the overall picture going back almost 2 years to November 2021 however we see that the SMH is much closer to that peak than the IGV is. I have always stated that competition is a good thing, in real life and markets, and perhaps this will instill a move upward from software, but the WEEKLY chart if it can hold here for the SMH is looking more like a cup with handle, than a double top. The base being 2 years in duration makes a potential breakout, a strong one as the saying goes the longer the base the greater the space. Rare doji candles were influential on the daily chart calling short-term tops and bottoms at 140 and 160 thus far. All this being said I think semis showing longer-term strength deserve to be the focus. If markets continue to gain from here a rising tide will lift most boats, and let us look at a couple of semi-names that never wavered during the recent selling.
Onto Innovation:
- Semi play up 98% YTD and 88% over last one year period.
- Name 5% off most recent 52-week highs and in the upper half of the WEEKLY range that produced a huge 20% gain ending 9/1. Excellent follow-through from break above WEEKLY cup base at very round par number in May.
- Earnings reactions mixed up 5.1 and 3.2% on 5/5 and 10/28/22 and down 2.8 and 2.1% on 8/11 and 2/10.
- Enter after break above cup with handle pivot.
- Entry ONTO here. Stop 128.50 (REPORTS 10/26 after close).
MACOM Technology:
- Semi play up 30% YTD and 41% over last one year period.
- Name 4% off most recent 52-week highs and this name ABOVE double top on WEEKLY chart at the round 80 number, moving above that pattern which the SMH has not yet. Respect.
- Earnings reactions mixed up 11.1 and 4.9% on 8/3 and 11/3/22 fell 3.8 and 2.9% on 5/4 and 2/2.
- Enter after bullish engulfing candle at rising 50-day SMA.
- Entry MTSI here. Stop 77.
Good luck.