"He Who Sweats More in Training Will Bleed Less in War" -Unknown
Joining The Party?
- It is no secret that the small caps have been the laggard in 2023 with the Russell 2000 up just 2% in 2023 while the Nasdaq and S&P 500 are up 35 and 18% respectively (the Dow is higher by just 5% YTD). There has been some correlation in the last couple of months with the small caps gaining as the 10-year dropped as we know this group is very sensitive to interest rates. Several weeks back we thought the group was ripe for a move upward as it was testing a MONTHLY double-bottom breakout from November 2020. Keep in mind the Russell 2000 is concentrated mostly in financials and industrials so if its strength can continue it would point to a broadening out in improving breadth. There will be some headwinds for the IWM here as it faces a "cluster of evidence" here with an upside gap fill, 200-day SMA resistance, and the testing of the former breakdown of the bearish head and shoulders (to be fair the measured move toward 160 was achieved almost perfectly). A couple of CLOSES above the 200-day SMA should get bulls invigorated.

Turning Point?
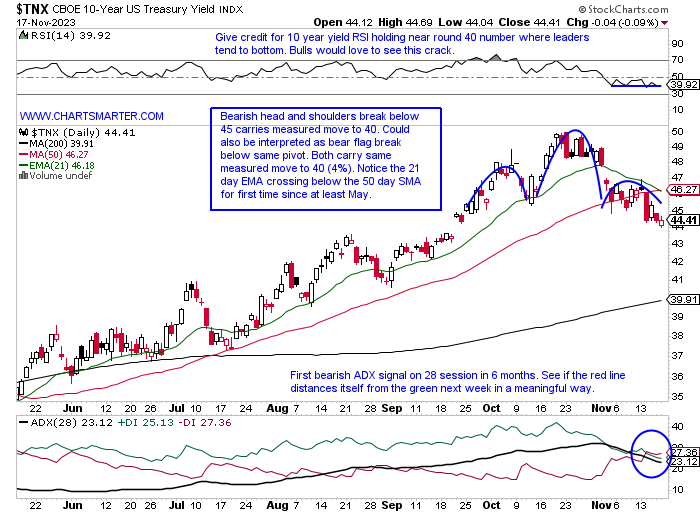
- All eyes continue to be fixated on the ten-year yield. Fatigue on this subject will arise as we know information value decays over time. Once something becomes too mainstream it begins to lose its luster. But for the time being the weakness in the TNX is putting a floor underneath the major benchmarks. On Friday it ever so slightly recorded a death cross with the 21-day EMA undercutting the 50-day SMA. Notice how the 21-day EMA (green line) which was supportive since May, now looks like resistance with the test there on Monday rejected soundly recording a bearish shooting star candle. The WEEKLY chart shows the double bottom breakout just above 4 which just happens to be the measured move lower from the head and shoulders/bear flag breakdown last week. Notice too the first WEEKLY bearish MACD crossover since late 2021 and the bearish WEEKLY engulfing candle this week following through lower from the bearish evening star pattern the week ending 11/3.

Round Number Rejection (Again):
- As the growth areas of the markets continue to surge can the "defensive" gold space keep up? The precious metal met a familiar for at the very round 2000 number Friday. Overall the WEEKLY chart still looks good with some real accumulation in October and nice follow-through after the completion of the morning star pattern off the rising 200-week SMA. The double bottom pivot of 2011 remains elusive, and even the very round 2000 number on a WEEKLY CLOSING basis as well with 4 of the last 5 weeks above 2000 intraweek with zero CLOSES above it (last week came with 3 handles of 2000 and 2 of those 5 weeks CLOSED with a 1998 and 1999 handle). The MONTHLY chart shows a well-defined bull flag and a move above 2100 carrying a measured move to 3000, of course over a much longer time frame. Getting back to the question can Gold participate with a strong stock market the WEEKLY chart here says yes. There is a correlation between Gold and the S&P 500 dating back two years that shows they can both gain ground in unison. Give gold the benefit of the doubt above 1935.

Escalator Up...
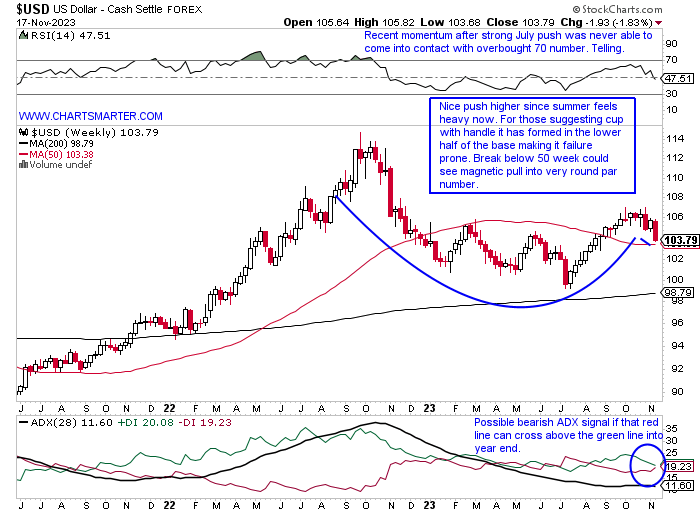
- And the elevator down? Of course, I have no idea what may occur with the greenback but after an 11 of 13-week win streak that started in July with a nice orderly push (escalator), some recent volatility suggests the elevator ride lower may be just beginning. Toward the end of that visually impressive streak, there were some dubious candles that posed the question if the move was tiring. A shooting star, a couple of spinning tops, and then back-to-back engulfing candles. On the chart below there have been some strong moves lower with the 11 of 15 week losing streak from last October to this January, a 9 of 10 week losing streak between February and April, and a 5 of 7 week streak from May to July. Was the recent move back above the 50 WEEK SMA a bull trap? The recent volatility after the very taut trade beginning this summer suggests some big moves could be in store. I think this tests the very round par number into Q1 '24 that should keep a bid under equities.

Semis Grooving:
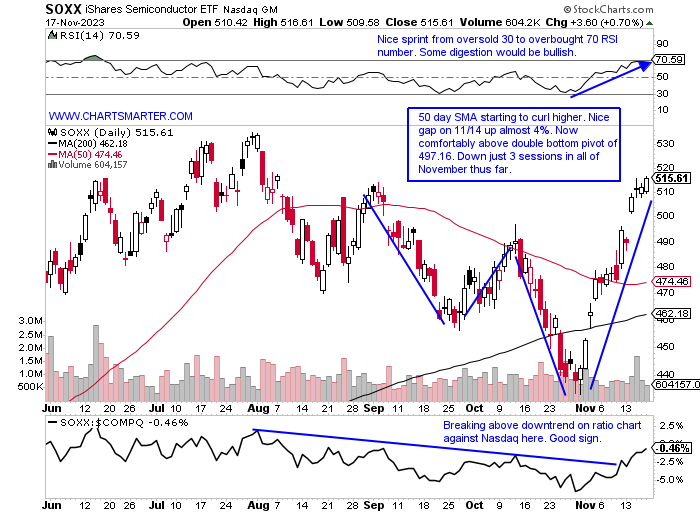
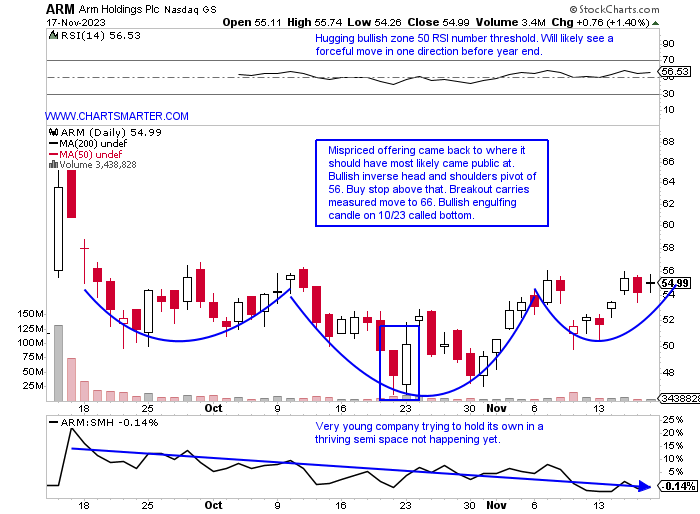
- The semiconductors continue to impress on this nascent market rally. The chart below of the SOXX to me is a better way of seeing how well the overall semiconductor space is doing. It is more "equally weighted" at the top with AMD AVGO NVDA and INTC all comprising between 8-9% of the fund (compare that to the SMH with NVDA, its largest holding, alone making up more than 20% of the ETF). The SMH is acting a bit better now at 52-week highs while the SOXX is 4% off its own annual peak. Of course, that is where concentration can be your best friend with NVDA behaving strongly. AVGO is a name on both its daily and WEEKLY chart looks very attractive. In November the daily chart broke above a bullish inverse head and shoulders formation and on the WEEKLY it has taken out a bull flag. Let us look at NVDA which is right near all-time highs, but notice the doji candle Tuesday and the bearish engulfing candle Wednesday at the familiar 500 number resistance. And ARM which has quickly gone into hiding after a much hyped-up recent IPO.

Nvidia:
- Semi leader up 237% YTD and 214% over last one-year period.
- Name 2% off most recent 52-week highs and brief undercut of very round 400 number three weeks ago was a big bear trap. Above 500 could see the very round 600 number quickly.
- Earnings reactions mostly higher up .1, 24.4, and 14% on 8/24, 5/25, and 2/23 after a loss of 1.5% on 11/17/22.
- Enter on pulback into double bottom breakout.
- Entry NVDA 485. Stop 470 (REPORTS Tuesday after the close).

Arm Holdings:
- New semi issue up 5% over the last one-week period and 4% over the last one month.
- Name 20% highs made from late September when it first started trading. Bullish engulfing WEEKLY candle last week and the last 9 weeks have all almost traded inside the week ending 9/15, its first week of trading ever.
- Lone earnings reaction on 11/9 fell 5.2%. Upside gap filled this week and not retreating a good sign.
- Enter with buy stop above bullish inverse head and shoulders pattern.
- Entry ARM 56. Stop 53.

This article requires a Chartsmarter membership. Please click here to join.
"He Who Sweats More in Training Will Bleed Less in War" -Unknown
Joining The Party?
- It is no secret that the small caps have been the laggard in 2023 with the Russell 2000 up just 2% in 2023 while the Nasdaq and S&P 500 are up 35 and 18% respectively (the Dow is higher by just 5% YTD). There has been some correlation in the last couple of months with the small caps gaining as the 10-year dropped as we know this group is very sensitive to interest rates. Several weeks back we thought the group was ripe for a move upward as it was testing a MONTHLY double-bottom breakout from November 2020. Keep in mind the Russell 2000 is concentrated mostly in financials and industrials so if its strength can continue it would point to a broadening out in improving breadth. There will be some headwinds for the IWM here as it faces a "cluster of evidence" here with an upside gap fill, 200-day SMA resistance, and the testing of the former breakdown of the bearish head and shoulders (to be fair the measured move toward 160 was achieved almost perfectly). A couple of CLOSES above the 200-day SMA should get bulls invigorated.

Turning Point?
- All eyes continue to be fixated on the ten-year yield. Fatigue on this subject will arise as we know information value decays over time. Once something becomes too mainstream it begins to lose its luster. But for the time being the weakness in the TNX is putting a floor underneath the major benchmarks. On Friday it ever so slightly recorded a death cross with the 21-day EMA undercutting the 50-day SMA. Notice how the 21-day EMA (green line) which was supportive since May, now looks like resistance with the test there on Monday rejected soundly recording a bearish shooting star candle. The WEEKLY chart shows the double bottom breakout just above 4 which just happens to be the measured move lower from the head and shoulders/bear flag breakdown last week. Notice too the first WEEKLY bearish MACD crossover since late 2021 and the bearish WEEKLY engulfing candle this week following through lower from the bearish evening star pattern the week ending 11/3.

Round Number Rejection (Again):
- As the growth areas of the markets continue to surge can the "defensive" gold space keep up? The precious metal met a familiar for at the very round 2000 number Friday. Overall the WEEKLY chart still looks good with some real accumulation in October and nice follow-through after the completion of the morning star pattern off the rising 200-week SMA. The double bottom pivot of 2011 remains elusive, and even the very round 2000 number on a WEEKLY CLOSING basis as well with 4 of the last 5 weeks above 2000 intraweek with zero CLOSES above it (last week came with 3 handles of 2000 and 2 of those 5 weeks CLOSED with a 1998 and 1999 handle). The MONTHLY chart shows a well-defined bull flag and a move above 2100 carrying a measured move to 3000, of course over a much longer time frame. Getting back to the question can Gold participate with a strong stock market the WEEKLY chart here says yes. There is a correlation between Gold and the S&P 500 dating back two years that shows they can both gain ground in unison. Give gold the benefit of the doubt above 1935.

Escalator Up...
- And the elevator down? Of course, I have no idea what may occur with the greenback but after an 11 of 13-week win streak that started in July with a nice orderly push (escalator), some recent volatility suggests the elevator ride lower may be just beginning. Toward the end of that visually impressive streak, there were some dubious candles that posed the question if the move was tiring. A shooting star, a couple of spinning tops, and then back-to-back engulfing candles. On the chart below there have been some strong moves lower with the 11 of 15 week losing streak from last October to this January, a 9 of 10 week losing streak between February and April, and a 5 of 7 week streak from May to July. Was the recent move back above the 50 WEEK SMA a bull trap? The recent volatility after the very taut trade beginning this summer suggests some big moves could be in store. I think this tests the very round par number into Q1 '24 that should keep a bid under equities.

Semis Grooving:
- The semiconductors continue to impress on this nascent market rally. The chart below of the SOXX to me is a better way of seeing how well the overall semiconductor space is doing. It is more "equally weighted" at the top with AMD AVGO NVDA and INTC all comprising between 8-9% of the fund (compare that to the SMH with NVDA, its largest holding, alone making up more than 20% of the ETF). The SMH is acting a bit better now at 52-week highs while the SOXX is 4% off its own annual peak. Of course, that is where concentration can be your best friend with NVDA behaving strongly. AVGO is a name on both its daily and WEEKLY chart looks very attractive. In November the daily chart broke above a bullish inverse head and shoulders formation and on the WEEKLY it has taken out a bull flag. Let us look at NVDA which is right near all-time highs, but notice the doji candle Tuesday and the bearish engulfing candle Wednesday at the familiar 500 number resistance. And ARM which has quickly gone into hiding after a much hyped-up recent IPO.

Nvidia:
- Semi leader up 237% YTD and 214% over last one-year period.
- Name 2% off most recent 52-week highs and brief undercut of very round 400 number three weeks ago was a big bear trap. Above 500 could see the very round 600 number quickly.
- Earnings reactions mostly higher up .1, 24.4, and 14% on 8/24, 5/25, and 2/23 after a loss of 1.5% on 11/17/22.
- Enter on pulback into double bottom breakout.
- Entry NVDA 485. Stop 470 (REPORTS Tuesday after the close).

Arm Holdings:
- New semi issue up 5% over the last one-week period and 4% over the last one month.
- Name 20% highs made from late September when it first started trading. Bullish engulfing WEEKLY candle last week and the last 9 weeks have all almost traded inside the week ending 9/15, its first week of trading ever.
- Lone earnings reaction on 11/9 fell 5.2%. Upside gap filled this week and not retreating a good sign.
- Enter with buy stop above bullish inverse head and shoulders pattern.
- Entry ARM 56. Stop 53.
