Not Recessionary:
- The industrial space as a whole has come to life during this one month plus market surge. And in particular a couple are screaming no recession forthcoming. The JETS ETF is now higher 4 of the last 5 weeks, albeit from a very low trajectory, but it signals a consumer willing to spend on discretionary items. More relevant may be the chart below of the IYT, which shows some possible good things on the horizon as we know goods need to be shipped and it shows up in the PRICE action. Railroads are acting well. CSX broke above a double bottom with handle trigger of 32.74 Friday. UNP, the top holding in the fund, is building the right side of a cup base. To be frank I was surprised to see UBER as the second largest component, although perhaps a smart idea by the selection committee to inject some growth into it. UPS, which I have always liked FDX more, recorded a bullish three white soldiers WEEKLY pattern this week. Overall the industrials over the last one month are holding in there with some of the best actors with the XLI up 10%. Give the group some respect.

Small Business Optimism?
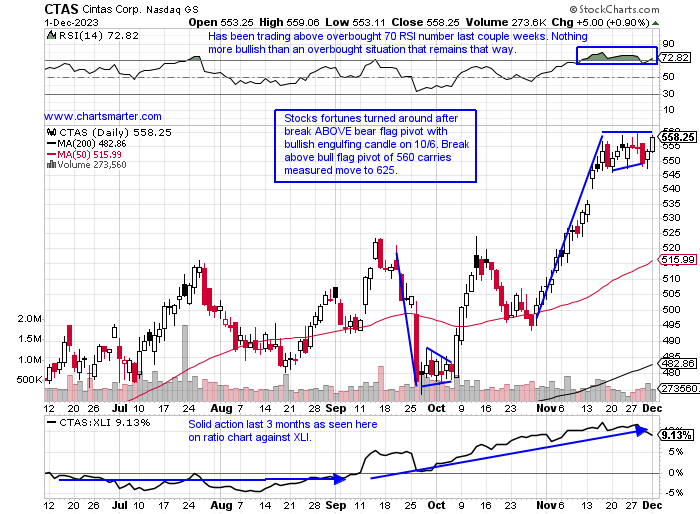
- There has always been one stock that I feel embodies the overall health of small businesses domestically and that is the chart below of CTAS. It has its tentacles in a variety of areas that young companies deem essential including uniforms and cleaning services among other things. The MONTHLY chart shows just how impressive that uptrend has been for over a decade (RSI was at many times near the 90 number, not a typo, between 2014-20) with the exception of COVID in early 2020. Notice that taut trade and it is now right at all-time highs. The daily chart below shows strength started before the November surge with a break ABOVE a bear flag in early October and we know from FALSE moves come fast ones in the opposite direction. The stock's uptrend has not correlated with a move upward in the IWM until today with its surge above its bull flag pivot of 180.
Recent Examples:
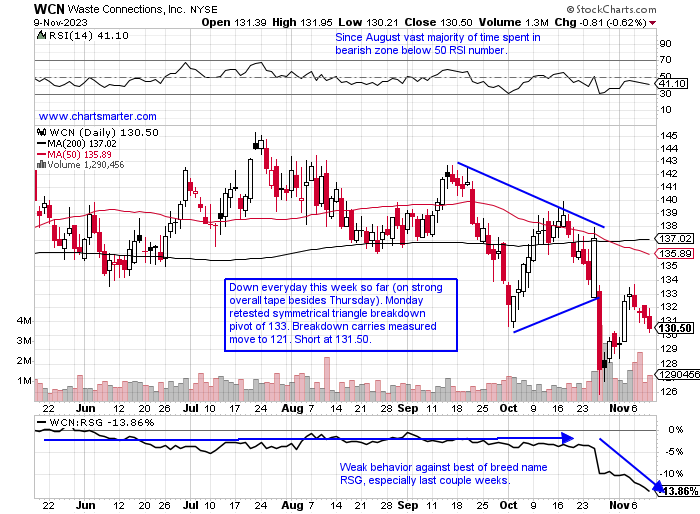
- The waste plays have been coming back to life and they seem to always be one of the stronger groups within the industrial space. WM is now at its 52-week high and Friday broke above a cup with handle base pivot of 172.92. RSG has acted even better and is now right at its annual peak, and has done just what you want a leader to do and that is to act well POST breakout from the double bottom trigger of 151.89 taken out on 11/3. Below is the chart of WCN and how it appeared in our 11/10 Industrial Note, and this is the laggard of the trio now 4% off its most recent annual peak, but we were WRONG about a short. Since mid-May on a WEEKLY basis has advanced in consecutive weeks just twice, and it has recorded recent distribution weeks falling 6.2 and 2% the weeks ending 10/27 and 11/10 in the first and third strongest WEEKLY volume of 2023 thus far. It will likely continue to lag the aforementioned two names but risk management always comes first.
Special Situations:
General Electric:
- Industrial play up 87% YTD and 84% over last one year period. Dividend yield of .3%.
- Name 1% off most recent 52-week highs and on first 6-week win streak in one year and to demonstrate its consistency has not recorded a 3-week losing streak in all of 2023, and fell back-to-back weeks just 4 times.
- Earnings reactions mostly higher up 6.5, 6.3, and 1.2% on 10/24, 7/25, and 1/24, and fell 1.7% on 4/25.
- Enter on pullback into bull flag breakout.
- Entry GE 121.50. Stop 118.

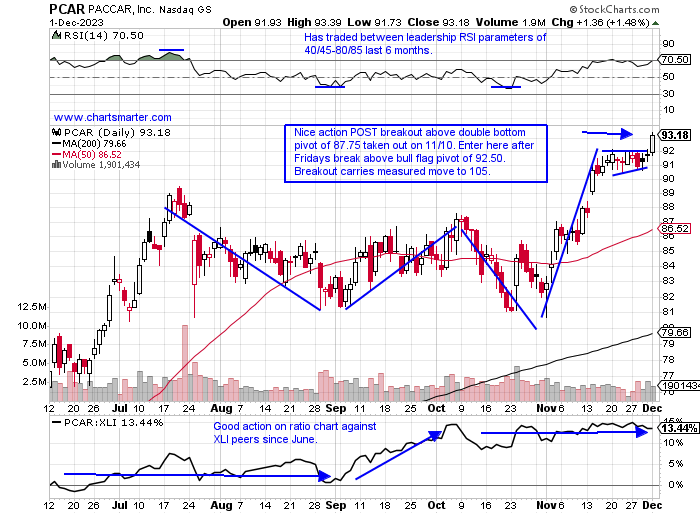
PACCAR:
- Transport play 41% YTD and 32% over last one year period. Dividend yield of 1.2%.
- Name at all-time highs and on a 6-week win streak with the last 5 all CLOSING at the top of the WEEKLY range. Has now recorded 3 WEEKLY CLOSES above very round 90 number which it was unable to accomplish week ending 7/21. Vast majority of stocks that travel through 90 go on to reach par and beyond.
- Earnings reactions mostly higher up 4.3, 1.4, and 8.6% on 10/24, 4/25, and 1/24, and fell 2.7% on 10/24.
- Enter after break above bull flag.
- Entry PCAR here. Stop 89.75.
Fluor:
- Industrial play up 13% YTD and 16% over last one year period.
- Name at 52-week highs and WEEKLY chart has look of bullish ascending triangle. Break above this area here carries measured move to the very round 50 number.
- Earnings reactions mixed up 5.9 and 15.6% on 11/3 and 8/4 and fell .7 and .2% on 5/5 and 2/21.
- Enter after break above bull flag pivot.
- Entry FLR here. Stop 37.25.

Good luck.
Entry summaries:
Buy pullback into bull flag breakout GE 121.50. Stop 118.
Buy after break above bull flag PCAR here. Stop 89.75.
Buy after above bull flag pivot FLR here. Stop 37.25.
This article requires a Chartsmarter membership. Please click here to join.
Not Recessionary:
- The industrial space as a whole has come to life during this one month plus market surge. And in particular a couple are screaming no recession forthcoming. The JETS ETF is now higher 4 of the last 5 weeks, albeit from a very low trajectory, but it signals a consumer willing to spend on discretionary items. More relevant may be the chart below of the IYT, which shows some possible good things on the horizon as we know goods need to be shipped and it shows up in the PRICE action. Railroads are acting well. CSX broke above a double bottom with handle trigger of 32.74 Friday. UNP, the top holding in the fund, is building the right side of a cup base. To be frank I was surprised to see UBER as the second largest component, although perhaps a smart idea by the selection committee to inject some growth into it. UPS, which I have always liked FDX more, recorded a bullish three white soldiers WEEKLY pattern this week. Overall the industrials over the last one month are holding in there with some of the best actors with the XLI up 10%. Give the group some respect.
Small Business Optimism?
- There has always been one stock that I feel embodies the overall health of small businesses domestically and that is the chart below of CTAS. It has its tentacles in a variety of areas that young companies deem essential including uniforms and cleaning services among other things. The MONTHLY chart shows just how impressive that uptrend has been for over a decade (RSI was at many times near the 90 number, not a typo, between 2014-20) with the exception of COVID in early 2020. Notice that taut trade and it is now right at all-time highs. The daily chart below shows strength started before the November surge with a break ABOVE a bear flag in early October and we know from FALSE moves come fast ones in the opposite direction. The stock's uptrend has not correlated with a move upward in the IWM until today with its surge above its bull flag pivot of 180.
Recent Examples:
- The waste plays have been coming back to life and they seem to always be one of the stronger groups within the industrial space. WM is now at its 52-week high and Friday broke above a cup with handle base pivot of 172.92. RSG has acted even better and is now right at its annual peak, and has done just what you want a leader to do and that is to act well POST breakout from the double bottom trigger of 151.89 taken out on 11/3. Below is the chart of WCN and how it appeared in our 11/10 Industrial Note, and this is the laggard of the trio now 4% off its most recent annual peak, but we were WRONG about a short. Since mid-May on a WEEKLY basis has advanced in consecutive weeks just twice, and it has recorded recent distribution weeks falling 6.2 and 2% the weeks ending 10/27 and 11/10 in the first and third strongest WEEKLY volume of 2023 thus far. It will likely continue to lag the aforementioned two names but risk management always comes first.
Special Situations:
General Electric:
- Industrial play up 87% YTD and 84% over last one year period. Dividend yield of .3%.
- Name 1% off most recent 52-week highs and on first 6-week win streak in one year and to demonstrate its consistency has not recorded a 3-week losing streak in all of 2023, and fell back-to-back weeks just 4 times.
- Earnings reactions mostly higher up 6.5, 6.3, and 1.2% on 10/24, 7/25, and 1/24, and fell 1.7% on 4/25.
- Enter on pullback into bull flag breakout.
- Entry GE 121.50. Stop 118.
PACCAR:
- Transport play 41% YTD and 32% over last one year period. Dividend yield of 1.2%.
- Name at all-time highs and on a 6-week win streak with the last 5 all CLOSING at the top of the WEEKLY range. Has now recorded 3 WEEKLY CLOSES above very round 90 number which it was unable to accomplish week ending 7/21. Vast majority of stocks that travel through 90 go on to reach par and beyond.
- Earnings reactions mostly higher up 4.3, 1.4, and 8.6% on 10/24, 4/25, and 1/24, and fell 2.7% on 10/24.
- Enter after break above bull flag.
- Entry PCAR here. Stop 89.75.
Fluor:
- Industrial play up 13% YTD and 16% over last one year period.
- Name at 52-week highs and WEEKLY chart has look of bullish ascending triangle. Break above this area here carries measured move to the very round 50 number.
- Earnings reactions mixed up 5.9 and 15.6% on 11/3 and 8/4 and fell .7 and .2% on 5/5 and 2/21.
- Enter after break above bull flag pivot.
- Entry FLR here. Stop 37.25.
Good luck.
Entry summaries:
Buy pullback into bull flag breakout GE 121.50. Stop 118.
Buy after break above bull flag PCAR here. Stop 89.75.
Buy after above bull flag pivot FLR here. Stop 37.25.