"No one is hated more than he who speaks truth." - Plato
Rolling "Index" Bull Market:
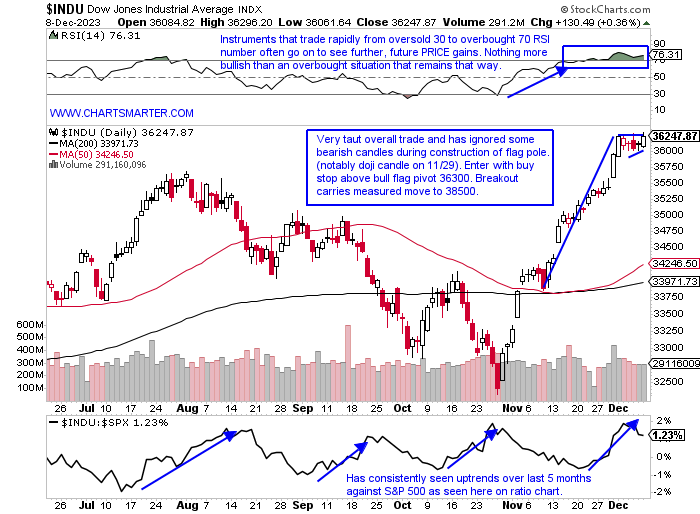
- We have mentioned the rolling bull markets in Q4 numerous times where different sectors will take a leadership role to give prior generals a chance to regain their stamina. Like musical chairs, if you will, between technology, financials, industrials, and real estate. We have seen a surge in the small caps with with the benchmark showing three gap ups, rare for an index, in such a short period on 11/2, 11/3, and 11/14. It is now setting up yet another bull flag formation with a break above 187.50 carrying a measured move to almost the very round 200 number. We all know how well the Nasdaq has done of late, but not getting much attention is the power the Dow has shown recently. Over the last one month period it has distanced itself from the S&P 500 and Nasdaq, and the daily chart below shows a bull flag. Of course, this is a PRICE-weighted index so take a look at the most influential names like UNH which is right at a cup base pivot, GS less than 2% from a double bottom trigger, and HD in an ascending triangle. All three of these are WEEKLY charts and in year-long plus patterns, so we could see a nice move into 2024. And for good measure do not discount AAPL, the largest company on the planet, just breaking above a bull flag pattern on the daily with a measured move to 215.
Dollar Grooving:
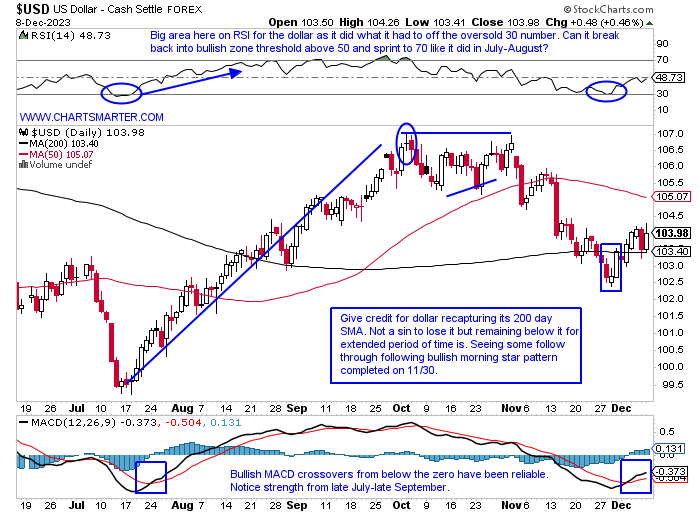
- With all the chatter of a dollar in decline, remember talk is cheap. PRICE speaks, and although the former statement may be correct over time the present picture in my opinion speaks to one of strength. I did recently have a short position on into a retest of the break BELOW the bull flag near 106 (we know from FALSE moves come fast ones in the opposite direction), but I covered after the bullish morning star pattern from 11/30 which recaptured the 200 day SMA. Other factors came into play with the bounce that started at the 61.8% Fibonacci retracement area, from the move off the very round par number in the second half of July to the top just above 107 with the doji candle that was recorded on 10/3. Notice how RSI is right at a line in the sand here and if this can push through the important 50 number can may its way quickly to the overbought 70 number we witnessed in July-August. And in mid-August when it touched the overbought 70 figure PRICE kept moving higher from roughly 104-107. It is a good example of overbought not meaning overdone. Continued strength here could be a headwind for equities.
Crude Awakening:
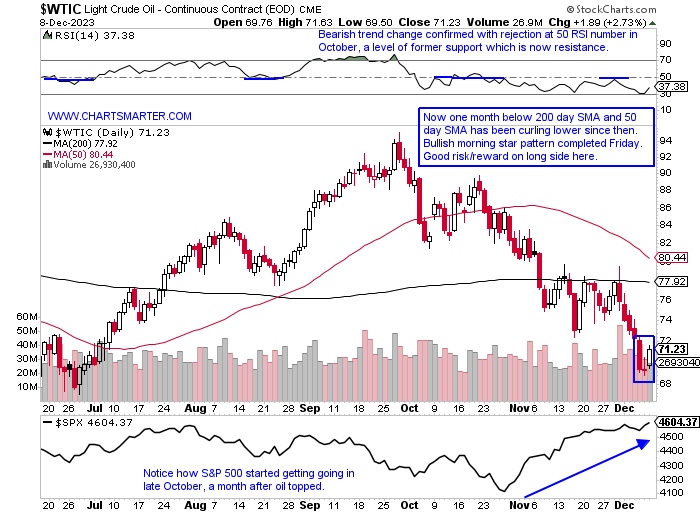
- One factor in the recent push higher overall for markets has been the softness of oil. WTI is now on a 7-week losing streak, its first since 2018, and not surprisingly started with the WEEKLY doji candle from the week ending 10/20 (which correctly called for a change in the prevailing direction after the prior 12 of 14-week winning streak). It is now finding support too at the rising 50 WEEK SMA which it did several time notice between March-June. Below is the daily chart which like the chart of the dollar we mentioned in the prior paragraph, recorded a bullish morning star pattern Friday. WTI is still well below the 200-day SMA, and we know the saying "Nothing good happens below that line", so I think we can see a move back toward the secular level in the upper 70s, but will both the dollar and oil appreciate together? That is often an inverse relationship, but notice here they can move together in harmony as seen over the last 6 months (except for July and currently). One has to come away impressed as the equity markets have been shrugging off not only a stronger greenback (nascent ascent) and now possibly crude (bulls will say it's a sign of improved economic activity), but a VIX trading near the COVID lows. Can a move back toward the very round 10 number from the 2017-8 era occur before a double-bottom base takes shape?
"Risk On" Indicator:
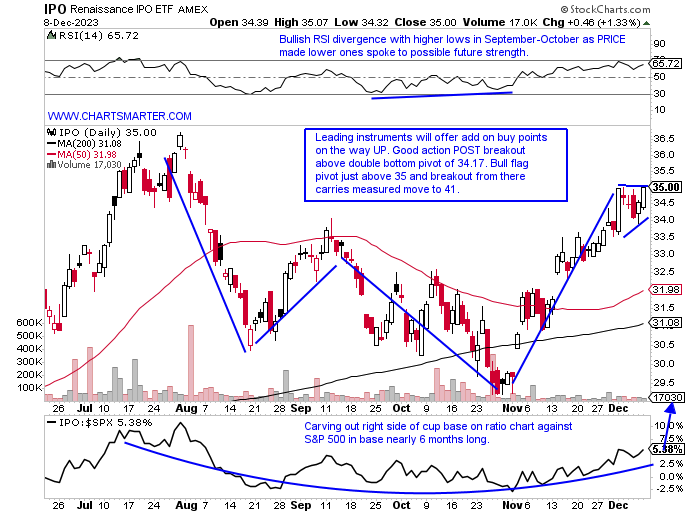
- There are many ways to gauge how "giddy" market participants feel. One could look at various sentiment indicators. They can look at the SPY:TLT ratio chart which witnessed recently broke below a nice uptrend for equities. Some like to peer at the WEEKLY chart of ARKK which is sporting a bullish inverse head and shoulders formation. Below is another of the chart of the IPO ETF. I am old enough to remember when the number of new issues was used to try and capture the feel of investor's dispositions. The chart below should just be used as an illustration as it is not very liquid, but it shows how names that came public, somewhat recently are behaving, and the visual is displaying improvement. Among the top holdings, are names like ABNB PLTR COIN DASH RBLX RIVN, the definition essentially of volatility. KVUE is an interesting play as it has recaptured the very round 20 number and its 21-day EMA (also recorded a bullish golden cross climbing above the 50-day SMA), and notice how influential that line (green) has been. It was resistance basically from the get-go after the JNJ spinoff.
Japan Rising:
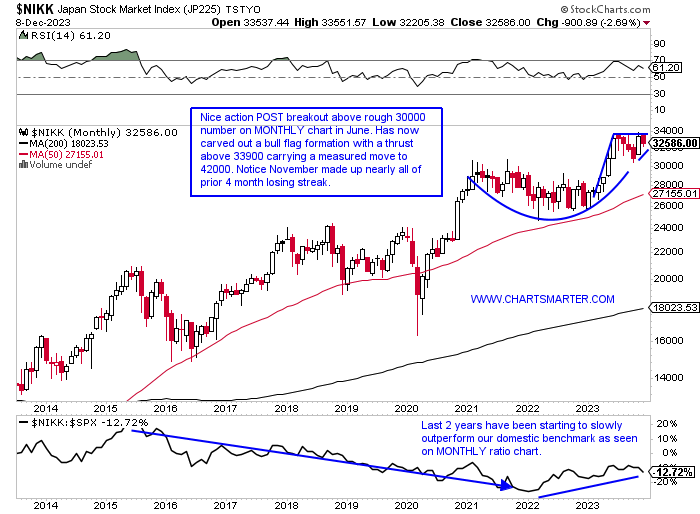
- As benchmarks around the world are rising, Germany hitting all-time highs, Pakistan surging albeit from low levels, Argentina is now bull flagging near the very round 50 number, with a huge contribution from MELI, but do not forget YPF perhaps the strongest energy company in the world right now also bull flagging after doubling in PRICE in just the last one month alone. Below though is the chart of the NIKKEI and Japan has been in focus and is approaching all-time highs not seen since the late 1980s. We know the best breakouts tend to work right away and offer additional buy points on the way UP and that is just what it has done. The very round 30000 number, not surprisingly was tough to get above, as it was above the figure intramonth in February-April and again in September 2021 with none CLOSING above. This October for good measure successfully retested that 2 year breakout and has since formed a bull flag. December so far has not been as sanguine as our domestic major averages but this could be resting for a potential move into 2024. Let us take a look at a couple of names that will participate if that happens.
Toyota:
- Auto play higher by 37% YTD and 32% over last one year period. Dividend yield of 2.4%.
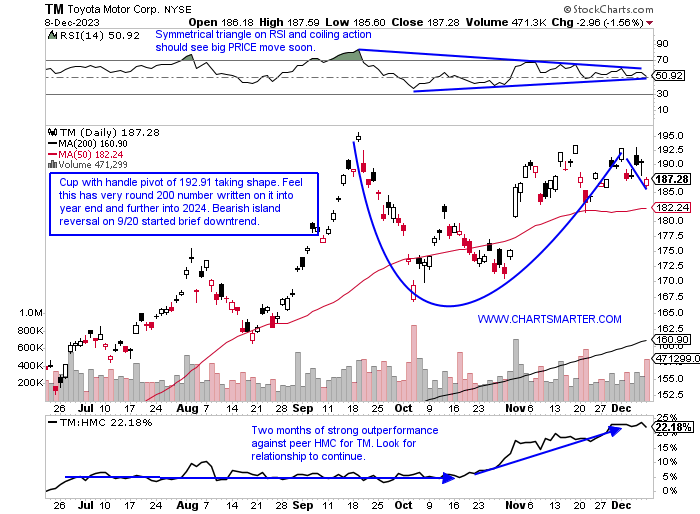
- Name 4% off most recent 52-week highs (good relative strength as HMC is 17% off its annual peak) despite being up just 5 of the last 12 weeks. The week ending 11/3 screamed higher by almost 10%. The WEEKLY chart also shows an add-on cup with handle pivot of 195.75.
- FOUR straight positive earnings reactions up 6, 2.1, 1.9, and .7% on 11/1, 8/1, 5/10, and 2/9.
- Enter with buy stop above cup with handle pivot.
- Entry TM 192.91. Stop 181.
Sony Group:
- Consumer electronics play 17% YTD and 13% over last one year period. Dividend yield of .6%.
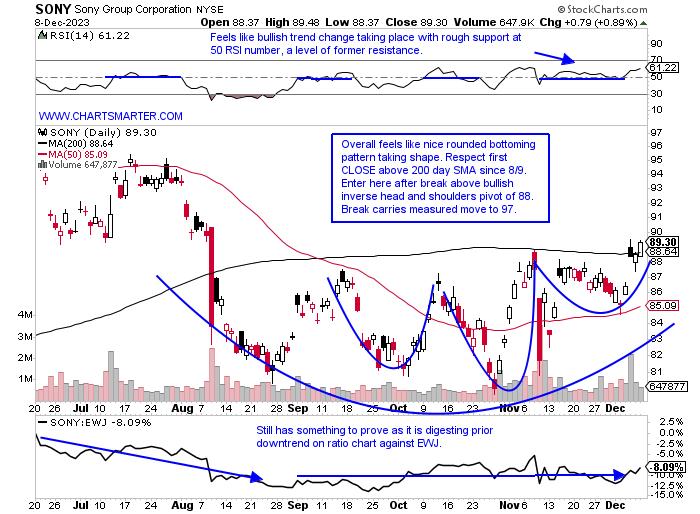
- Name 12% off most recent 52-week highs and good regional relative strength up almost 4% as EWJ fell nearly 1%. The WEEKLY chart in my opinion will see a move into very round par number soon which if can break above should see a powerful move to 135 perhaps late in 2024 above an ascending triangle.
- Earnings reactions mostly lower down 6.6, 6.6, and 5.7% on 11/9, 8/9 and, 4/28 after a gain of 4.8% on 2/2.
- Enter after break above inverse head and shoulders pattern.
- Entry SONY here. Stop 85.
This article requires a Chartsmarter membership. Please click here to join.
"No one is hated more than he who speaks truth." - Plato
Rolling "Index" Bull Market:
- We have mentioned the rolling bull markets in Q4 numerous times where different sectors will take a leadership role to give prior generals a chance to regain their stamina. Like musical chairs, if you will, between technology, financials, industrials, and real estate. We have seen a surge in the small caps with with the benchmark showing three gap ups, rare for an index, in such a short period on 11/2, 11/3, and 11/14. It is now setting up yet another bull flag formation with a break above 187.50 carrying a measured move to almost the very round 200 number. We all know how well the Nasdaq has done of late, but not getting much attention is the power the Dow has shown recently. Over the last one month period it has distanced itself from the S&P 500 and Nasdaq, and the daily chart below shows a bull flag. Of course, this is a PRICE-weighted index so take a look at the most influential names like UNH which is right at a cup base pivot, GS less than 2% from a double bottom trigger, and HD in an ascending triangle. All three of these are WEEKLY charts and in year-long plus patterns, so we could see a nice move into 2024. And for good measure do not discount AAPL, the largest company on the planet, just breaking above a bull flag pattern on the daily with a measured move to 215.
Dollar Grooving:
- With all the chatter of a dollar in decline, remember talk is cheap. PRICE speaks, and although the former statement may be correct over time the present picture in my opinion speaks to one of strength. I did recently have a short position on into a retest of the break BELOW the bull flag near 106 (we know from FALSE moves come fast ones in the opposite direction), but I covered after the bullish morning star pattern from 11/30 which recaptured the 200 day SMA. Other factors came into play with the bounce that started at the 61.8% Fibonacci retracement area, from the move off the very round par number in the second half of July to the top just above 107 with the doji candle that was recorded on 10/3. Notice how RSI is right at a line in the sand here and if this can push through the important 50 number can may its way quickly to the overbought 70 number we witnessed in July-August. And in mid-August when it touched the overbought 70 figure PRICE kept moving higher from roughly 104-107. It is a good example of overbought not meaning overdone. Continued strength here could be a headwind for equities.
Crude Awakening:
- One factor in the recent push higher overall for markets has been the softness of oil. WTI is now on a 7-week losing streak, its first since 2018, and not surprisingly started with the WEEKLY doji candle from the week ending 10/20 (which correctly called for a change in the prevailing direction after the prior 12 of 14-week winning streak). It is now finding support too at the rising 50 WEEK SMA which it did several time notice between March-June. Below is the daily chart which like the chart of the dollar we mentioned in the prior paragraph, recorded a bullish morning star pattern Friday. WTI is still well below the 200-day SMA, and we know the saying "Nothing good happens below that line", so I think we can see a move back toward the secular level in the upper 70s, but will both the dollar and oil appreciate together? That is often an inverse relationship, but notice here they can move together in harmony as seen over the last 6 months (except for July and currently). One has to come away impressed as the equity markets have been shrugging off not only a stronger greenback (nascent ascent) and now possibly crude (bulls will say it's a sign of improved economic activity), but a VIX trading near the COVID lows. Can a move back toward the very round 10 number from the 2017-8 era occur before a double-bottom base takes shape?
"Risk On" Indicator:
- There are many ways to gauge how "giddy" market participants feel. One could look at various sentiment indicators. They can look at the SPY:TLT ratio chart which witnessed recently broke below a nice uptrend for equities. Some like to peer at the WEEKLY chart of ARKK which is sporting a bullish inverse head and shoulders formation. Below is another of the chart of the IPO ETF. I am old enough to remember when the number of new issues was used to try and capture the feel of investor's dispositions. The chart below should just be used as an illustration as it is not very liquid, but it shows how names that came public, somewhat recently are behaving, and the visual is displaying improvement. Among the top holdings, are names like ABNB PLTR COIN DASH RBLX RIVN, the definition essentially of volatility. KVUE is an interesting play as it has recaptured the very round 20 number and its 21-day EMA (also recorded a bullish golden cross climbing above the 50-day SMA), and notice how influential that line (green) has been. It was resistance basically from the get-go after the JNJ spinoff.
Japan Rising:
- As benchmarks around the world are rising, Germany hitting all-time highs, Pakistan surging albeit from low levels, Argentina is now bull flagging near the very round 50 number, with a huge contribution from MELI, but do not forget YPF perhaps the strongest energy company in the world right now also bull flagging after doubling in PRICE in just the last one month alone. Below though is the chart of the NIKKEI and Japan has been in focus and is approaching all-time highs not seen since the late 1980s. We know the best breakouts tend to work right away and offer additional buy points on the way UP and that is just what it has done. The very round 30000 number, not surprisingly was tough to get above, as it was above the figure intramonth in February-April and again in September 2021 with none CLOSING above. This October for good measure successfully retested that 2 year breakout and has since formed a bull flag. December so far has not been as sanguine as our domestic major averages but this could be resting for a potential move into 2024. Let us take a look at a couple of names that will participate if that happens.
Toyota:
- Auto play higher by 37% YTD and 32% over last one year period. Dividend yield of 2.4%.
- Name 4% off most recent 52-week highs (good relative strength as HMC is 17% off its annual peak) despite being up just 5 of the last 12 weeks. The week ending 11/3 screamed higher by almost 10%. The WEEKLY chart also shows an add-on cup with handle pivot of 195.75.
- FOUR straight positive earnings reactions up 6, 2.1, 1.9, and .7% on 11/1, 8/1, 5/10, and 2/9.
- Enter with buy stop above cup with handle pivot.
- Entry TM 192.91. Stop 181.
Sony Group:
- Consumer electronics play 17% YTD and 13% over last one year period. Dividend yield of .6%.
- Name 12% off most recent 52-week highs and good regional relative strength up almost 4% as EWJ fell nearly 1%. The WEEKLY chart in my opinion will see a move into very round par number soon which if can break above should see a powerful move to 135 perhaps late in 2024 above an ascending triangle.
- Earnings reactions mostly lower down 6.6, 6.6, and 5.7% on 11/9, 8/9 and, 4/28 after a gain of 4.8% on 2/2.
- Enter after break above inverse head and shoulders pattern.
- Entry SONY here. Stop 85.