Size Matter?
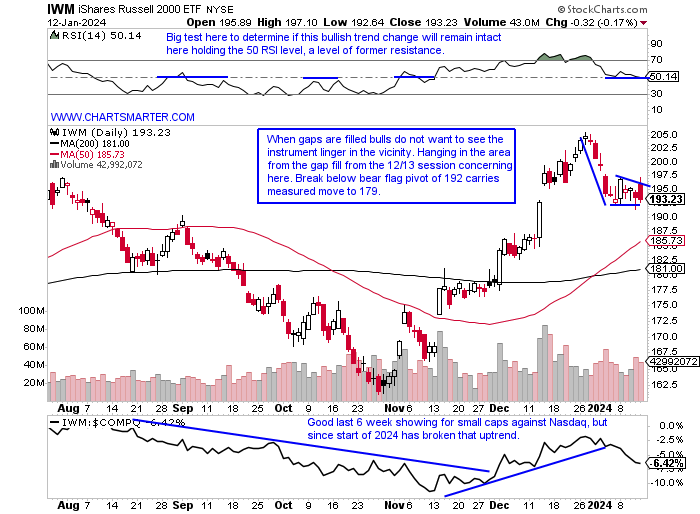
- Small caps are often thought of as a leading indicator, and maybe they are, but for me, they are a good predictor of interest rates. Keep in mind the vast majority of smaller companies are unprofitable and rely on financing to stay afloat. The performance chart of the IWM compared to the major three US benchmarks shows a big divergence. Whether one believes the IWM is a good leading indicator or forecaster of interest rates this is not a good development. We will talk about the 10-year yield later in this note, but is the weakness in the IWM trying to convey that rates are bottoming? The WEEKLY chart shows the current 3-week losing streak with the completion of a bearish evening star pattern the week ending 1/5 that fell nearly 4%. On its MONTHLY chart, we highlighted several times that it did see a nice bounce near the 160 level, the area of a prior double-bottom breakout from November 2020. But notice how big monthly gains circled have led to very little follow-through in the past. The IWM is now 6% off its most recent annual peak, with the Dow, Nasdaq, and S&P 500 all at or 1% off their own. Is this shouting "risk off" in play? The benchmarks could use a healthy breather.
Rate Tease:
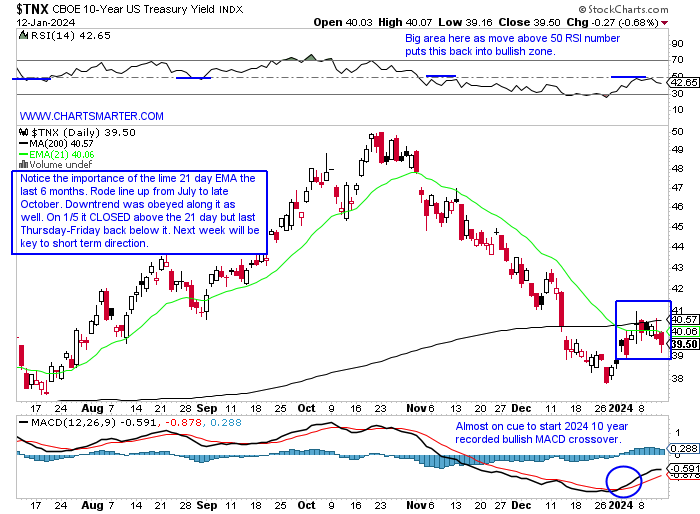
- The 10-year yield is talked about incessantly as to what direction equities may be headed, and with good reason, this chart shows the divergent paths the S&P 500 and the ten-year yield have taken and the zero correlation. Therefore market participants look for clues to where the yield may head next. On the daily chart below one can see the important role the 21-day EMA has played as it rode the line higher almost precisely from late July to the end of October when the stock market began its ferocious move upward. Whether one is bullish or bearish they can paint their bias accordingly. The 21-day EMA has stopped sloping lower although it has not started inclining. It is still holding the bullish island reversal with the gap up from the first day of 2024 (after the gap down on 12/14) and there seems to be a tug of war here at the "round"4 number. Remember it was stopped cold at 5 back in late October. I feel one has to be patient and let the next direction be made somewhat known with a move above 4.1 bearish for stocks and a move below 3.9% bullish. We did speak about the TLT and our concern with the WEEKLY gravestone doji a few weeks back and if that continues its nascent move lower from the very round par number it could be a headwind for equities.
Dollar Dilemma:
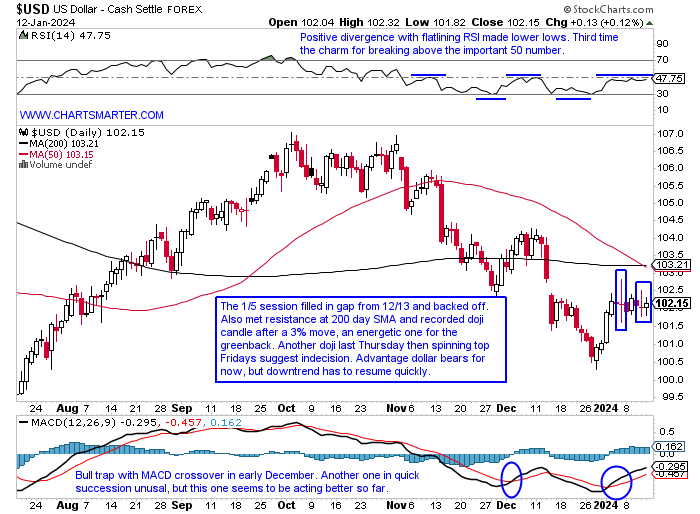
- The greenback slipping since late October after breaking BELOW a bull flag (and we know from FALSE moves often come fast moves in the opposite direction) has put a bid under equities. The dollar is right back to the very round par number, now for a fourth time since the beginning of 2023, and this is the latest venture into the level since a WEEKLY cup base looked to be taking shape after an 11-of-13-week win streak between mid-July and early-October. Many technicians believe the more times a line is touched the greater the support gets. I am not in that camp and wonder if this latest move into 100 is one too many. In my humble opinion, I think this takes a move toward the lower to mid-90s where a double bottom pattern could take shape. Dollar bulls will say 2 doji candles in the last 6 sessions, which are adept at signaling changes in the prevailing direction, could be a sign selling pressure is abating. An interesting development has been the close relationship between the dollar and oil. If you are an energy bull you want to see the dollar go higher. As we just spoke about intermarket relationships that have held over the years, like between stocks and the ten-year, some have not. This chart here shows how closely both oil and the dollar have traded, which was not the case in years past. It goes to show the value of certain information decays over time.
Feeling High?
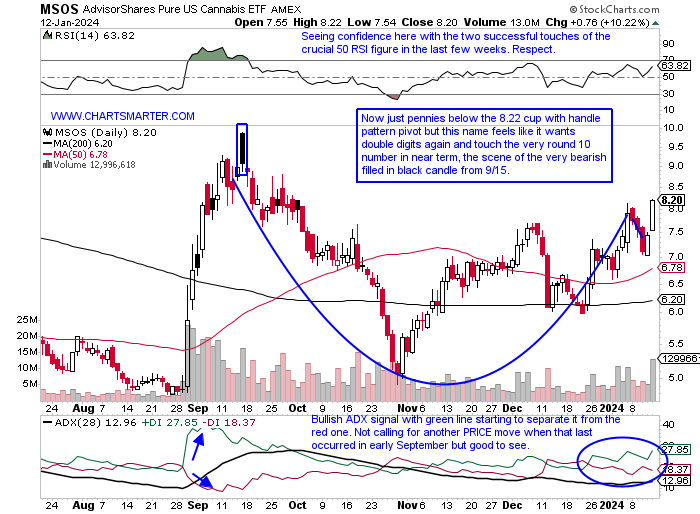
- A group, that I would not consider an asset class at all, but that has quietly been moving in the right direction and deserves some attention is the cannabis ETF MSOS. It is a very liquid one, and the group is still very speculative and I would advocate just playing the fund and not individual names within. I do not get caught up in the craziness of feverish moves, and wait for the noise to cool down before judging a possible investment. That would have been smart after the doubling in PRICE from 5-10 and then giving back all of that move just 6 weeks later following legislation in September. Perhaps real interest started in the space with the JAZZ buyout of GWPH in May 2021, and even before with STZ investing in Canopy, which proved to be a flop. I am not advocating its medicinal properties, only the recent PRICE action. Last Thursday-Friday rose by a combined 15% on robust volume and on the WEEKLY chart one can see the interest developing as volume expands. Will Nutting has been all over this and compares it to coal a few years back where no one wanted it and very very few covered the sector.
Equipment Check:
- Energy was not kind to investors in 2023, finishing the year in the red. Notice here how it has kept to its normal showing as being either the best or worst major S&P sector performer (green squares) dating back to 2014 (in 2017 and last year it was very close to the cellar). Looking at the daily chart of the OIH below last week's PRICE did undercut the mid-December lows and RSI made a higher high so that could be a good start for energy equipment bulls. It is hard to get excited with anything below the 200-day SMA, and a potential death cross may be coming, but that often occurs after most of the technical damage has happened. I feel there is good risk/reward here for at least a dead cat bounce and seasonality the last 5 years suggest so too with average MONTHLY gains of 2.5% in January and February (notice how dismal March is with an average loss of 14%!). Peering at the OIH names and with the fund now 20% off most recent 52-week highs, there are just 3 large cap plays in the group (HAL SLB and BKR), and on that basis alone shouts sentiment may be washed out in the space. Let us take a look at a couple of opportunities below in WFRD and PTEN.
Weatherford International:
- Energy equipment play 72% over last one year period and down 1% over last 3 months.
- Name 8% off most recent 52 week highs (good relative strength as OIH is 20% off its own) and last week fell .7% as the OIH slipped 4.4%. Still dealing with bearish WEEKLY gravestone doji candle at very round par number from week ending 12/29.
- FOUR consecutive positive earnings reactions (7 in total) up .5, 3.8, 3.9 and 12.6% on 10/25, 7/26, 4/26 and 2/8.
- Enter on pullback into very round number.
- Entry WFRD 93. Stop 89.
Patterson UTI Energy:
- Energy equipment play 41% over last one year period and 25% over last 3 months. Dividend yield of 3.1%.
- Name 42% off most recent 52 week highs and since last week of September has advanced on a WEEKLY basis just 2 times, not a typo. On MONTHLY chart retesting bull flag breakout from very round 10 number from February 2022. Huge volume during cuurent 5 month losing streak.
- Earnings reactions mixed up 3.8 and .9% on 11/8 and 7/27 and fell 2.5 and 14.4% on 4/27 and 2/9.
- Enter on pullback into WEEKLY bullish falling wedge/200 WEEK SMA.
- Entry PTEN here. Stop 9.25.
This article requires a Chartsmarter membership. Please click here to join.
Size Matter?
- Small caps are often thought of as a leading indicator, and maybe they are, but for me, they are a good predictor of interest rates. Keep in mind the vast majority of smaller companies are unprofitable and rely on financing to stay afloat. The performance chart of the IWM compared to the major three US benchmarks shows a big divergence. Whether one believes the IWM is a good leading indicator or forecaster of interest rates this is not a good development. We will talk about the 10-year yield later in this note, but is the weakness in the IWM trying to convey that rates are bottoming? The WEEKLY chart shows the current 3-week losing streak with the completion of a bearish evening star pattern the week ending 1/5 that fell nearly 4%. On its MONTHLY chart, we highlighted several times that it did see a nice bounce near the 160 level, the area of a prior double-bottom breakout from November 2020. But notice how big monthly gains circled have led to very little follow-through in the past. The IWM is now 6% off its most recent annual peak, with the Dow, Nasdaq, and S&P 500 all at or 1% off their own. Is this shouting "risk off" in play? The benchmarks could use a healthy breather.
Rate Tease:
- The 10-year yield is talked about incessantly as to what direction equities may be headed, and with good reason, this chart shows the divergent paths the S&P 500 and the ten-year yield have taken and the zero correlation. Therefore market participants look for clues to where the yield may head next. On the daily chart below one can see the important role the 21-day EMA has played as it rode the line higher almost precisely from late July to the end of October when the stock market began its ferocious move upward. Whether one is bullish or bearish they can paint their bias accordingly. The 21-day EMA has stopped sloping lower although it has not started inclining. It is still holding the bullish island reversal with the gap up from the first day of 2024 (after the gap down on 12/14) and there seems to be a tug of war here at the "round"4 number. Remember it was stopped cold at 5 back in late October. I feel one has to be patient and let the next direction be made somewhat known with a move above 4.1 bearish for stocks and a move below 3.9% bullish. We did speak about the TLT and our concern with the WEEKLY gravestone doji a few weeks back and if that continues its nascent move lower from the very round par number it could be a headwind for equities.
Dollar Dilemma:
- The greenback slipping since late October after breaking BELOW a bull flag (and we know from FALSE moves often come fast moves in the opposite direction) has put a bid under equities. The dollar is right back to the very round par number, now for a fourth time since the beginning of 2023, and this is the latest venture into the level since a WEEKLY cup base looked to be taking shape after an 11-of-13-week win streak between mid-July and early-October. Many technicians believe the more times a line is touched the greater the support gets. I am not in that camp and wonder if this latest move into 100 is one too many. In my humble opinion, I think this takes a move toward the lower to mid-90s where a double bottom pattern could take shape. Dollar bulls will say 2 doji candles in the last 6 sessions, which are adept at signaling changes in the prevailing direction, could be a sign selling pressure is abating. An interesting development has been the close relationship between the dollar and oil. If you are an energy bull you want to see the dollar go higher. As we just spoke about intermarket relationships that have held over the years, like between stocks and the ten-year, some have not. This chart here shows how closely both oil and the dollar have traded, which was not the case in years past. It goes to show the value of certain information decays over time.
Feeling High?
- A group, that I would not consider an asset class at all, but that has quietly been moving in the right direction and deserves some attention is the cannabis ETF MSOS. It is a very liquid one, and the group is still very speculative and I would advocate just playing the fund and not individual names within. I do not get caught up in the craziness of feverish moves, and wait for the noise to cool down before judging a possible investment. That would have been smart after the doubling in PRICE from 5-10 and then giving back all of that move just 6 weeks later following legislation in September. Perhaps real interest started in the space with the JAZZ buyout of GWPH in May 2021, and even before with STZ investing in Canopy, which proved to be a flop. I am not advocating its medicinal properties, only the recent PRICE action. Last Thursday-Friday rose by a combined 15% on robust volume and on the WEEKLY chart one can see the interest developing as volume expands. Will Nutting has been all over this and compares it to coal a few years back where no one wanted it and very very few covered the sector.
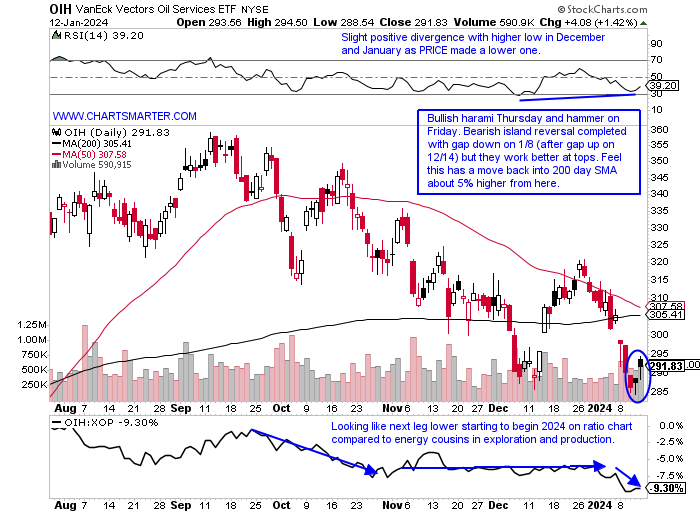
Equipment Check:
- Energy was not kind to investors in 2023, finishing the year in the red. Notice here how it has kept to its normal showing as being either the best or worst major S&P sector performer (green squares) dating back to 2014 (in 2017 and last year it was very close to the cellar). Looking at the daily chart of the OIH below last week's PRICE did undercut the mid-December lows and RSI made a higher high so that could be a good start for energy equipment bulls. It is hard to get excited with anything below the 200-day SMA, and a potential death cross may be coming, but that often occurs after most of the technical damage has happened. I feel there is good risk/reward here for at least a dead cat bounce and seasonality the last 5 years suggest so too with average MONTHLY gains of 2.5% in January and February (notice how dismal March is with an average loss of 14%!). Peering at the OIH names and with the fund now 20% off most recent 52-week highs, there are just 3 large cap plays in the group (HAL SLB and BKR), and on that basis alone shouts sentiment may be washed out in the space. Let us take a look at a couple of opportunities below in WFRD and PTEN.
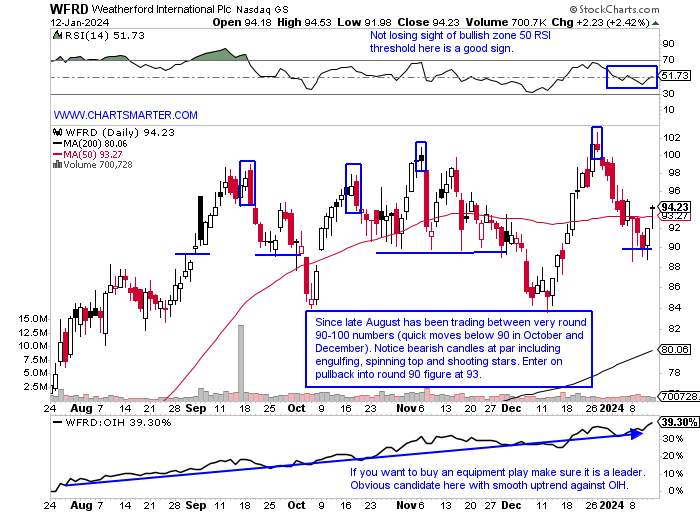
Weatherford International:
- Energy equipment play 72% over last one year period and down 1% over last 3 months.
- Name 8% off most recent 52 week highs (good relative strength as OIH is 20% off its own) and last week fell .7% as the OIH slipped 4.4%. Still dealing with bearish WEEKLY gravestone doji candle at very round par number from week ending 12/29.
- FOUR consecutive positive earnings reactions (7 in total) up .5, 3.8, 3.9 and 12.6% on 10/25, 7/26, 4/26 and 2/8.
- Enter on pullback into very round number.
- Entry WFRD 93. Stop 89.
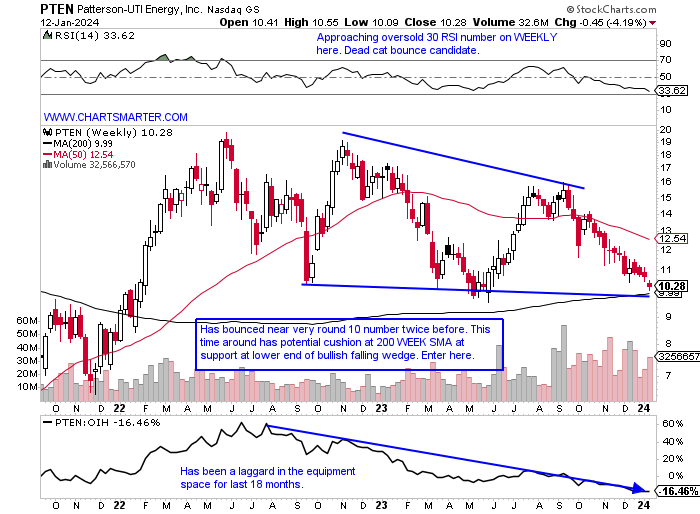
Patterson UTI Energy:
- Energy equipment play 41% over last one year period and 25% over last 3 months. Dividend yield of 3.1%.
- Name 42% off most recent 52 week highs and since last week of September has advanced on a WEEKLY basis just 2 times, not a typo. On MONTHLY chart retesting bull flag breakout from very round 10 number from February 2022. Huge volume during cuurent 5 month losing streak.
- Earnings reactions mixed up 3.8 and .9% on 11/8 and 7/27 and fell 2.5 and 14.4% on 4/27 and 2/9.
- Enter on pullback into WEEKLY bullish falling wedge/200 WEEK SMA.
- Entry PTEN here. Stop 9.25.