"People who say it cannot be done should not interrupt those who are doing it." George Bernard Shaw
Monthly Green shoots:
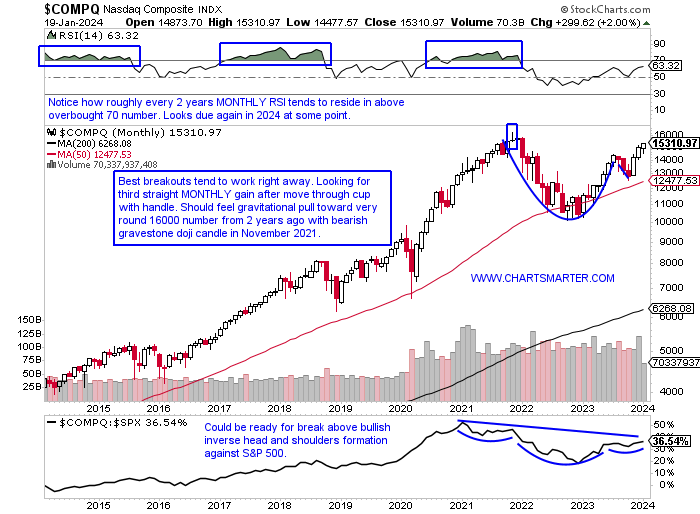
- The Nasdaq is now higher 2% YTD and has recovered nicely after the week ending 1/5 slid 3.25%, as the last couple of weeks CLOSED at the top of the WEEKLY range with advances of more than 3 and 2%. Thoughts of the "missed" Santa Claus rally and the "first 5 days of January" indicator that supposedly forecasts negative returns are now behind us. Peaking at the MONTHLY chart of the Nasdaq puts sanguine feelings in bulls. It is acting well POST breakout above the cup with handle above 14446 and look for this to make a move toward the very round 16000 number in the first half or sooner, and that is just more than 4% from current PRICES. I am looking for it to duplicate with the S&P 500 did last week which was to hit all-time highs (notice how this chart shows the S&P 500, the purple line ahead of the Nasdaq for the last 2 years, but before that dating back to 2014 it was the Nasdaq leading). Is it a negative that it is trailing what the supposedly less dynamic, growthier benchmark, or is it just giving it a target to strive for? I think the latter and with the way semis are acting, especially NVDA (although it may prudently pause here after hitting its measured move to 600 from the bull flag breakout). Look for the Nasdaq to reach 16000 by end of Q1 and then maybe it will take a cue from how the S&P 500 acts at all time highs.
Going for Gold:
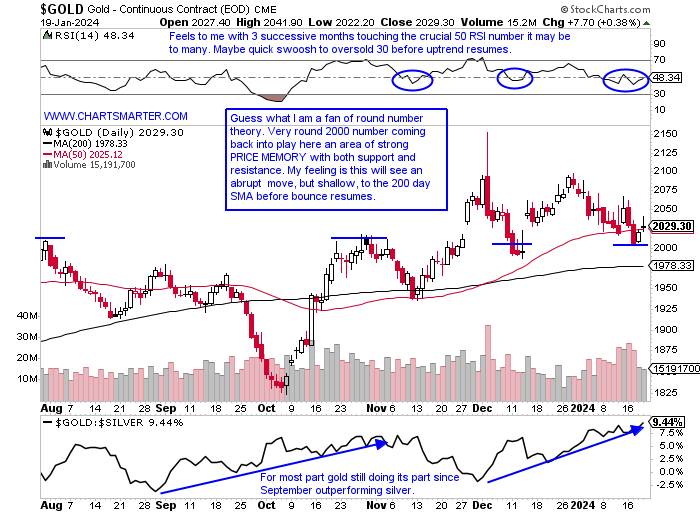
- In my opinion, gold feels heavy to me, but not in need of a sizable correction. I think it is a fact of the inverse relationship they have traded with interest rates. This chart here shows this, with the exception between mid October-mid November, but it has now resumed its normal ways. So if one is a bull on rates one has to lean bearish gold. The daily chart below shows how it is stalling here just above the very round 2000 number. I think there will be a lot of stops in this area making it likely for a quick move lower to shake the tree for weak shareholders. The WEEKLY chart shows the retest here of the double bottom breakout above 2000, but I think a move toward 1980, which is the 200-day SMA on the daily is a likely destination before another double bottom pattern appears. If it takes off higher here without me so be it, but I do think that wild session, that reversed hard lower on 12/4 meant something. Something tells me those highs will be tested again sometime in the first half of 2024.
Taxing Dax:
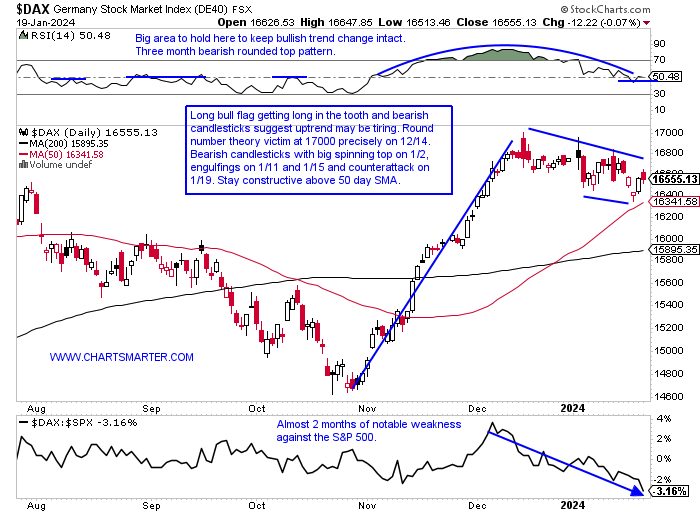
- Is one of Europe's most important benchmarks spent? It is too early to tell, and the uptrend is still in place, but getting somewhat fragile. Unlike the S&P 500 which is right at all-time/52-week highs, the DAX is almost 3% off that peak and its WEEKLY chart may have given some clues to the ongoing weakness with the gravestone doji candle in early December. Since then it has recorded 2 spinning tops and an engulfing candle too and notice the cup base breakout emerged from a V shape, which tend to be failure prone but that remains to be seen. It is also coming up on almost 1 year of underperformance against the S&P 500. Looking at some ADR charts within ADDYY (now at an oversold 30 RSI which could produce at least a dead cat bounce like it did last September) has now CLOSED the last 7 weeks at lows for the WEEKLY range and is underperforming domestic peer NKE which is having plenty of issues of its own but is right at the very round par number. Speaking of luxury issues in the region, POAHY is on a 5 week losing streak and 25% off its annual peak. Its MONTHLY chart shows the precipitous decline after failing to CLOSE above the very round 10 number (was above intramonth seven times between March '21-February '22 but saw ZERO CLOSES above 10). SAP is a darling but the DAX needs to hold that 50 day SMA 1.3% from Fridays finish.
Not Recessionary:
- With earnings season starting to perk up, and the financials behind us, next up we will see what the rails have to say. They give a good gauge of how the economy is doing so investors will be listening intently. The daily chart below of the IYT speaks to the health of how the railroads are doing, and as there is not a pure play rail ETF, this may be as close as it comes. Three of the top 5 holdings in the fund are top-holding UNP, which is now trading back to the peak of the very well-received earnings reaction on 7/26/23 which jumped 10%. CSX, the fourth largest component, is just 2% from its most recent 52-week highs (UNP and NSC are 3 and 10% from their annual peaks) and it is sporting a good-looking bull flag, with a breakout above 35 carrying a measured move to 41. Its WEEKLY chart has pros and cons with it holding above a long ascending triangle with five consecutive WEEKLY CLOSES with a 34 handle, but not exactly pulling away from the breakout level and has recorded some fatiguing candles, notably a doji candle the first week of 2024. All 3 of these REPORT next week so I would watch how they respond before pulling the trigger.

Healthcare Fragrant:
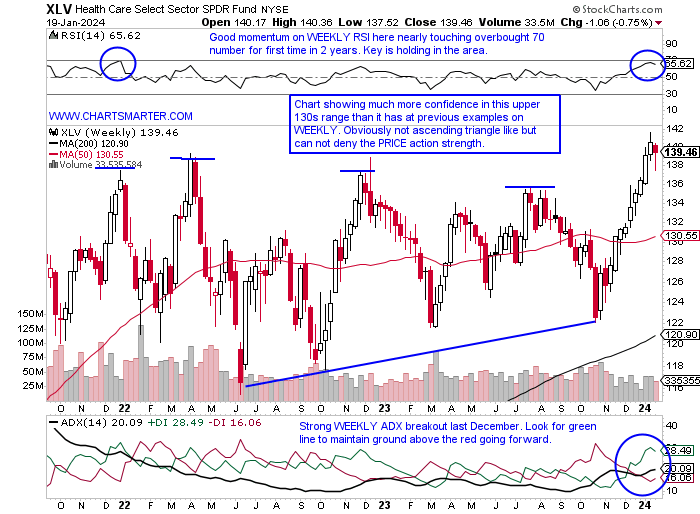
- The healthcare group over the last one month period has been acting very well. It is the second-best major S&P sector performer up better than 3%, being outdone only by technology. And in the last couple of weeks, it has not been helped along by biotech with the XBI now on a 7 session losing streak. The ratio chart shows that biotech is still in firm control since the late October lows, but if the market gets a bit more defensive like it was this summer look for this possible, nascent rounded bottom to start grinding higher (notice how between August-October the XLV was dominant). Seasonality displays it is now within its worst 2-month swing over the last 5 years with the January-February time frame both producing negative returns. But credit must be given where it is due and PRICE is so far not retreating quickly as it has done the previous 4 times since late 2021 in the upper 130s, and bulls will say last week was a bullish hammer and bears a hanging man WEEKLY candle. Let us take a look at a couple of good good-looking setups in the space.
Merck:
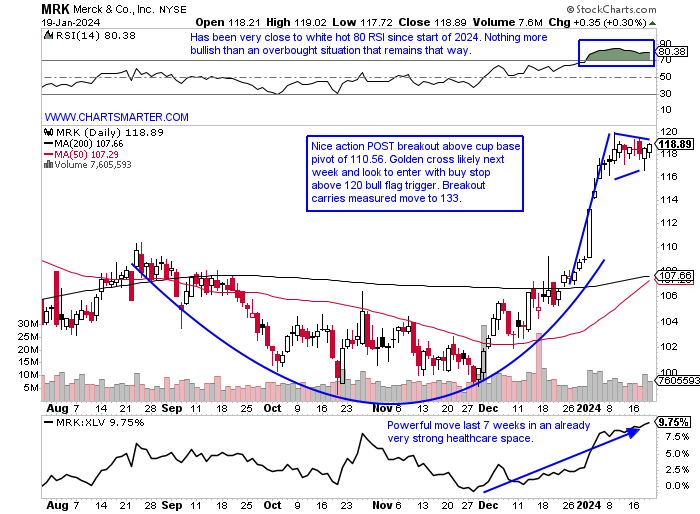
- Pharma play up 9% YTD and 8% over last one year period. Dividend yield of 2.6%.
- Name 1% off most recent 52-week highs and WEEKLY chart shows nice break above 117.30 cup base pivot and nice bullish MACD crossover from below the zero line. The current 10-week win streak started right at very round par number.
- Earnings reactions mixed up 1.9 and 1.5% on 10/26 and 4/27 and fell 1.3 and 3.3% on 8/1 and 2/2.
- Enter with buy stop above bull flag.
- Entry MRK 120. Stop 116.25 (REPORTS 2/1 before open).
Novo Nordisk:
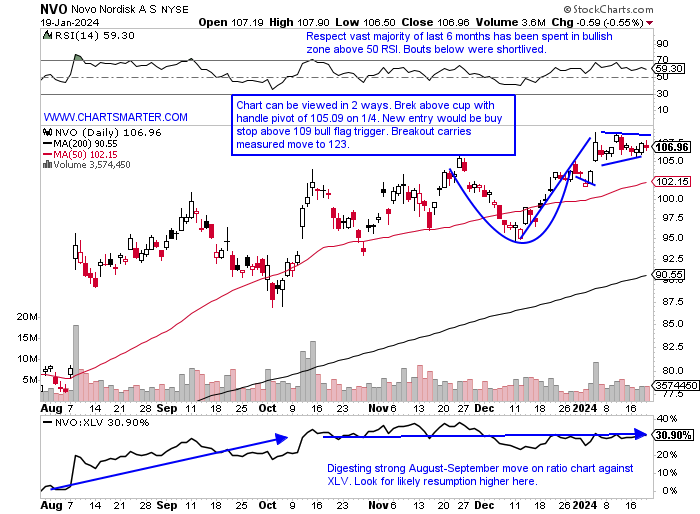
- Danish pharma up 3% YTD and 52% over last one year period. Dividend yield of .5%.
- Name 2% off most recent 52-week highs and in the last 2 years to demonstrate its consistency has not recorded a WEEKLY losing streak of more than 3, and only did that 3 times since January 2022. Last 3 weeks have all CLOSED tautly within 1.18 of each other and we know breaks from that type of coiling action tend to be powerful. Rare doji candle last week.
- Earnings reactions mixed up 3.3 and .2% on 11/2 and 2/1 and fell 2.9 and 4.4% on 8/10 and 5/4.
- Enter with buy stop above bull flag.
- Entry NVO 109. Stop 105.25 (REPORTS before open).
This article requires a Chartsmarter membership. Please click here to join.
"People who say it cannot be done should not interrupt those who are doing it." George Bernard Shaw
Monthly Green shoots:
- The Nasdaq is now higher 2% YTD and has recovered nicely after the week ending 1/5 slid 3.25%, as the last couple of weeks CLOSED at the top of the WEEKLY range with advances of more than 3 and 2%. Thoughts of the "missed" Santa Claus rally and the "first 5 days of January" indicator that supposedly forecasts negative returns are now behind us. Peaking at the MONTHLY chart of the Nasdaq puts sanguine feelings in bulls. It is acting well POST breakout above the cup with handle above 14446 and look for this to make a move toward the very round 16000 number in the first half or sooner, and that is just more than 4% from current PRICES. I am looking for it to duplicate with the S&P 500 did last week which was to hit all-time highs (notice how this chart shows the S&P 500, the purple line ahead of the Nasdaq for the last 2 years, but before that dating back to 2014 it was the Nasdaq leading). Is it a negative that it is trailing what the supposedly less dynamic, growthier benchmark, or is it just giving it a target to strive for? I think the latter and with the way semis are acting, especially NVDA (although it may prudently pause here after hitting its measured move to 600 from the bull flag breakout). Look for the Nasdaq to reach 16000 by end of Q1 and then maybe it will take a cue from how the S&P 500 acts at all time highs.
Going for Gold:
- In my opinion, gold feels heavy to me, but not in need of a sizable correction. I think it is a fact of the inverse relationship they have traded with interest rates. This chart here shows this, with the exception between mid October-mid November, but it has now resumed its normal ways. So if one is a bull on rates one has to lean bearish gold. The daily chart below shows how it is stalling here just above the very round 2000 number. I think there will be a lot of stops in this area making it likely for a quick move lower to shake the tree for weak shareholders. The WEEKLY chart shows the retest here of the double bottom breakout above 2000, but I think a move toward 1980, which is the 200-day SMA on the daily is a likely destination before another double bottom pattern appears. If it takes off higher here without me so be it, but I do think that wild session, that reversed hard lower on 12/4 meant something. Something tells me those highs will be tested again sometime in the first half of 2024.
Taxing Dax:
- Is one of Europe's most important benchmarks spent? It is too early to tell, and the uptrend is still in place, but getting somewhat fragile. Unlike the S&P 500 which is right at all-time/52-week highs, the DAX is almost 3% off that peak and its WEEKLY chart may have given some clues to the ongoing weakness with the gravestone doji candle in early December. Since then it has recorded 2 spinning tops and an engulfing candle too and notice the cup base breakout emerged from a V shape, which tend to be failure prone but that remains to be seen. It is also coming up on almost 1 year of underperformance against the S&P 500. Looking at some ADR charts within ADDYY (now at an oversold 30 RSI which could produce at least a dead cat bounce like it did last September) has now CLOSED the last 7 weeks at lows for the WEEKLY range and is underperforming domestic peer NKE which is having plenty of issues of its own but is right at the very round par number. Speaking of luxury issues in the region, POAHY is on a 5 week losing streak and 25% off its annual peak. Its MONTHLY chart shows the precipitous decline after failing to CLOSE above the very round 10 number (was above intramonth seven times between March '21-February '22 but saw ZERO CLOSES above 10). SAP is a darling but the DAX needs to hold that 50 day SMA 1.3% from Fridays finish.
Not Recessionary:
- With earnings season starting to perk up, and the financials behind us, next up we will see what the rails have to say. They give a good gauge of how the economy is doing so investors will be listening intently. The daily chart below of the IYT speaks to the health of how the railroads are doing, and as there is not a pure play rail ETF, this may be as close as it comes. Three of the top 5 holdings in the fund are top-holding UNP, which is now trading back to the peak of the very well-received earnings reaction on 7/26/23 which jumped 10%. CSX, the fourth largest component, is just 2% from its most recent 52-week highs (UNP and NSC are 3 and 10% from their annual peaks) and it is sporting a good-looking bull flag, with a breakout above 35 carrying a measured move to 41. Its WEEKLY chart has pros and cons with it holding above a long ascending triangle with five consecutive WEEKLY CLOSES with a 34 handle, but not exactly pulling away from the breakout level and has recorded some fatiguing candles, notably a doji candle the first week of 2024. All 3 of these REPORT next week so I would watch how they respond before pulling the trigger.
Healthcare Fragrant:
- The healthcare group over the last one month period has been acting very well. It is the second-best major S&P sector performer up better than 3%, being outdone only by technology. And in the last couple of weeks, it has not been helped along by biotech with the XBI now on a 7 session losing streak. The ratio chart shows that biotech is still in firm control since the late October lows, but if the market gets a bit more defensive like it was this summer look for this possible, nascent rounded bottom to start grinding higher (notice how between August-October the XLV was dominant). Seasonality displays it is now within its worst 2-month swing over the last 5 years with the January-February time frame both producing negative returns. But credit must be given where it is due and PRICE is so far not retreating quickly as it has done the previous 4 times since late 2021 in the upper 130s, and bulls will say last week was a bullish hammer and bears a hanging man WEEKLY candle. Let us take a look at a couple of good good-looking setups in the space.
Merck:
- Pharma play up 9% YTD and 8% over last one year period. Dividend yield of 2.6%.
- Name 1% off most recent 52-week highs and WEEKLY chart shows nice break above 117.30 cup base pivot and nice bullish MACD crossover from below the zero line. The current 10-week win streak started right at very round par number.
- Earnings reactions mixed up 1.9 and 1.5% on 10/26 and 4/27 and fell 1.3 and 3.3% on 8/1 and 2/2.
- Enter with buy stop above bull flag.
- Entry MRK 120. Stop 116.25 (REPORTS 2/1 before open).
Novo Nordisk:
- Danish pharma up 3% YTD and 52% over last one year period. Dividend yield of .5%.
- Name 2% off most recent 52-week highs and in the last 2 years to demonstrate its consistency has not recorded a WEEKLY losing streak of more than 3, and only did that 3 times since January 2022. Last 3 weeks have all CLOSED tautly within 1.18 of each other and we know breaks from that type of coiling action tend to be powerful. Rare doji candle last week.
- Earnings reactions mixed up 3.3 and .2% on 11/2 and 2/1 and fell 2.9 and 4.4% on 8/10 and 5/4.
- Enter with buy stop above bull flag.
- Entry NVO 109. Stop 105.25 (REPORTS before open).