Leader Basking:
- In last week's China/Japan Note, we discussed our affinity for JD over BABA. The latter name everyone has been hyper-focused upon and my belief is that script should be flipped. If one were to look at how many of the most popular names in the KWEB have performed since the overall market bottomed last October, one may be surprised to see how JD has been a leader, even overtaking PDD which has been an excellent actor itself (over the last 30 days JD has flexed its muscles against peers including NTES and BIDU). JD is still 28% off its most recent 52-week highs but is now on an 8-session win streak with the last 7 sessions CLOSING at or in the upper half of the daily range, a hallmark bullish trait. Last week JD jumped 19%, for its best WEEKLY return in more than 2 years, and recaptured its 50 WEEK SMA for the first time since early 2023, and notice RSI is at its best reading since the start of 2022. We liked that MONTHLY chart on JD where it enjoyed solid support at the very round 20 number, and April with 2 days left is nicely following through with March's bullish morning star pattern completion.

Battery Charge:
- The EV names have had a very tough sledding as of late and it has been getting plenty of media attention. Is this a possible sign that sentiment has reached a level where some tradeable lows are in for some of the participants? Below is the sign of one of the most visible names in the group with TSLA. One positive was last week's well-received earnings reaction on 3/24 jumping 12%, its first advance after REPORTING number in its last 5 (and the prior 4 all fell between 9-12%). It felt like a throw-in-the-kitchen sink type of moment. The WEEKLY timeframe looks good with last week recording a bullish piercing line candle CLOSING near highs for the WEEKLY range which cut into a former dragonfly doji candle from the week ending 4/28/23 (notice how round number theory came into play as well with back-to-back bullish hammer candles at par as a bottom and a bearish engulfing candle at the 300 figure the week ending 7/21/23). The MONTHLY time frame looks solid with a bullish hammer with 2 sessions left and it retesting the bullish piercing line from January 2023 (notice the rare MONTHLY doji at the very round 400 number in November 2021 being the canary in the coal mine). One can be long this name with a CLOSING stop under 157.

Recent Examples:
- Keeping on with the auto theme, when one discusses best in breed one can include the European leader in RACE. One has to be impressed with the action POST breakout above the cup base pivot of 370.29 from 2/1, and we know the best breakouts tend to work right away. It has found some recent comfort along its 50-day SMA and is now breaking ABOVE a bearish head and shoulders and we know from FALSE moves come fast ones in the opposite direction. Interesting was the move in HOG which took the proverbial escalator up (since the overall market lows last October) and elevator down last Thursday after an ill-received earnings reaction (it achieved its measured flag move and now sits on its 200-day SMA). That brings us to my favorite auto-play in TM and how it appeared in our China/Japan Note last weekend. We were looking for a pullback of 10 handles into 223 and we got that with the gap down on 4/25. The updated WEEKLY chart here shows the spinning top candle (good sign selling pressure may be abating), last week after a 13% haircut. Continue to use your 205 stop.

Special Situations:
Stellantis:
- Dutch auto play up 6% YTD and 54% over last one year period. Dividend yield of 6.7%.
- Name 16% off most recent 52-week highs and WEEKLY chart recorded bullish inside week (spinning top) with very taut range ending prior 4-week losing streak (looks similar to the pause before breaking the 6-week losing streak in late 2022-early 2023.
- FOUR straight positive earnings reactions up 6.6, 3.6, 3.7, and 4.6% on 2/15, 7/27/23, 2/22/23, and 7/29/22.
- Enter with buy stop above 21-day EMA.
- Entry STLA 25.20. Stop 24.

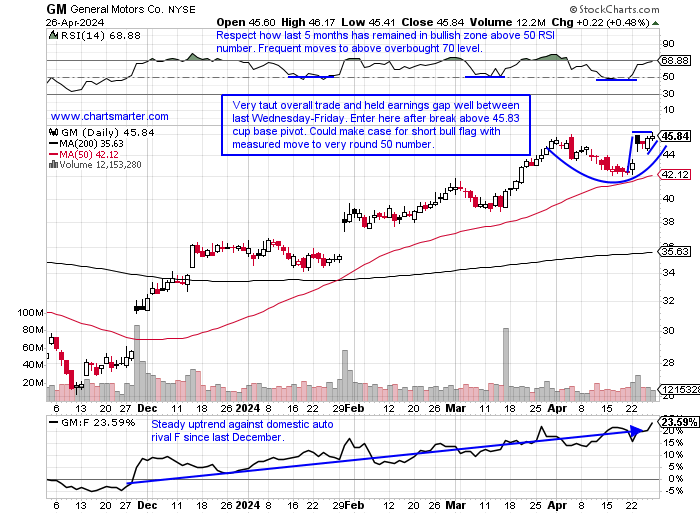
General Motors:
- Auto play up 28% YTD and 42% over last one-year period. Dividend yield of 1%.
- Name 1% off most recent 52-week highs (compare with F 17% off its own annual peak). WEEKLY chart shows nice comfort with 6 consecutive CLOSES above the secular line with multiple pushbacks in 2022-2023. Like the rapid move from oversold 30 to overbought 70 RSI on WEEKLY too.
- Earnings reactions mixed with back-to-back gains of 4.4 and 7.8% on 4/23 and 1/30 after losses of 2.3 and 3.5% on 10/24 and 7/25/23.
- Enter after break above cup base pattern.
- Entry GM here. Stop 42.50.
Rivian:
- Auto laggard down 61% YTD and 25% over last one-year period.
- Name 68% off most recent 52-week highs and down 17% thus far in April looking at its first 4-month losing streak ever. Has been some recent put activity at the 2.5 strike (which would align with measured move lower from descending triangle). Think a nice pair here is long TSLA/short RIVN.
- Three straight negative earnings reactions off 25.6, 2.4, and 9.9% on 2/22, 11/8, and 8/9/23.
- Enter short into downward sloping 21-day EMA.
- Entry RIVN 9.50. Buy stop 10.25 (REPORTS 5/7 after close).

Entry summaries:
Buy stop above 21-day EMA STLA 25.20. Stop 24.
Buy after cup base breakout GM here. Stop 42.50.
Short into downward sloping 21-day EMA RIVN 9.50. Buy stop 10.25.
This article requires a Chartsmarter membership. Please click here to join.
Leader Basking:
- In last week's China/Japan Note, we discussed our affinity for JD over BABA. The latter name everyone has been hyper-focused upon and my belief is that script should be flipped. If one were to look at how many of the most popular names in the KWEB have performed since the overall market bottomed last October, one may be surprised to see how JD has been a leader, even overtaking PDD which has been an excellent actor itself (over the last 30 days JD has flexed its muscles against peers including NTES and BIDU). JD is still 28% off its most recent 52-week highs but is now on an 8-session win streak with the last 7 sessions CLOSING at or in the upper half of the daily range, a hallmark bullish trait. Last week JD jumped 19%, for its best WEEKLY return in more than 2 years, and recaptured its 50 WEEK SMA for the first time since early 2023, and notice RSI is at its best reading since the start of 2022. We liked that MONTHLY chart on JD where it enjoyed solid support at the very round 20 number, and April with 2 days left is nicely following through with March's bullish morning star pattern completion.
Battery Charge:
- The EV names have had a very tough sledding as of late and it has been getting plenty of media attention. Is this a possible sign that sentiment has reached a level where some tradeable lows are in for some of the participants? Below is the sign of one of the most visible names in the group with TSLA. One positive was last week's well-received earnings reaction on 3/24 jumping 12%, its first advance after REPORTING number in its last 5 (and the prior 4 all fell between 9-12%). It felt like a throw-in-the-kitchen sink type of moment. The WEEKLY timeframe looks good with last week recording a bullish piercing line candle CLOSING near highs for the WEEKLY range which cut into a former dragonfly doji candle from the week ending 4/28/23 (notice how round number theory came into play as well with back-to-back bullish hammer candles at par as a bottom and a bearish engulfing candle at the 300 figure the week ending 7/21/23). The MONTHLY time frame looks solid with a bullish hammer with 2 sessions left and it retesting the bullish piercing line from January 2023 (notice the rare MONTHLY doji at the very round 400 number in November 2021 being the canary in the coal mine). One can be long this name with a CLOSING stop under 157.
Recent Examples:
- Keeping on with the auto theme, when one discusses best in breed one can include the European leader in RACE. One has to be impressed with the action POST breakout above the cup base pivot of 370.29 from 2/1, and we know the best breakouts tend to work right away. It has found some recent comfort along its 50-day SMA and is now breaking ABOVE a bearish head and shoulders and we know from FALSE moves come fast ones in the opposite direction. Interesting was the move in HOG which took the proverbial escalator up (since the overall market lows last October) and elevator down last Thursday after an ill-received earnings reaction (it achieved its measured flag move and now sits on its 200-day SMA). That brings us to my favorite auto-play in TM and how it appeared in our China/Japan Note last weekend. We were looking for a pullback of 10 handles into 223 and we got that with the gap down on 4/25. The updated WEEKLY chart here shows the spinning top candle (good sign selling pressure may be abating), last week after a 13% haircut. Continue to use your 205 stop.
Special Situations:
Stellantis:
- Dutch auto play up 6% YTD and 54% over last one year period. Dividend yield of 6.7%.
- Name 16% off most recent 52-week highs and WEEKLY chart recorded bullish inside week (spinning top) with very taut range ending prior 4-week losing streak (looks similar to the pause before breaking the 6-week losing streak in late 2022-early 2023.
- FOUR straight positive earnings reactions up 6.6, 3.6, 3.7, and 4.6% on 2/15, 7/27/23, 2/22/23, and 7/29/22.
- Enter with buy stop above 21-day EMA.
- Entry STLA 25.20. Stop 24.
General Motors:
- Auto play up 28% YTD and 42% over last one-year period. Dividend yield of 1%.
- Name 1% off most recent 52-week highs (compare with F 17% off its own annual peak). WEEKLY chart shows nice comfort with 6 consecutive CLOSES above the secular line with multiple pushbacks in 2022-2023. Like the rapid move from oversold 30 to overbought 70 RSI on WEEKLY too.
- Earnings reactions mixed with back-to-back gains of 4.4 and 7.8% on 4/23 and 1/30 after losses of 2.3 and 3.5% on 10/24 and 7/25/23.
- Enter after break above cup base pattern.
- Entry GM here. Stop 42.50.
Rivian:
- Auto laggard down 61% YTD and 25% over last one-year period.
- Name 68% off most recent 52-week highs and down 17% thus far in April looking at its first 4-month losing streak ever. Has been some recent put activity at the 2.5 strike (which would align with measured move lower from descending triangle). Think a nice pair here is long TSLA/short RIVN.
- Three straight negative earnings reactions off 25.6, 2.4, and 9.9% on 2/22, 11/8, and 8/9/23.
- Enter short into downward sloping 21-day EMA.
- Entry RIVN 9.50. Buy stop 10.25 (REPORTS 5/7 after close).
Entry summaries:
Buy stop above 21-day EMA STLA 25.20. Stop 24.
Buy after cup base breakout GM here. Stop 42.50.
Short into downward sloping 21-day EMA RIVN 9.50. Buy stop 10.25.