"When it's over leave, don't continue watering a dead flower." - Unknown
Canary in the Coal Mine?
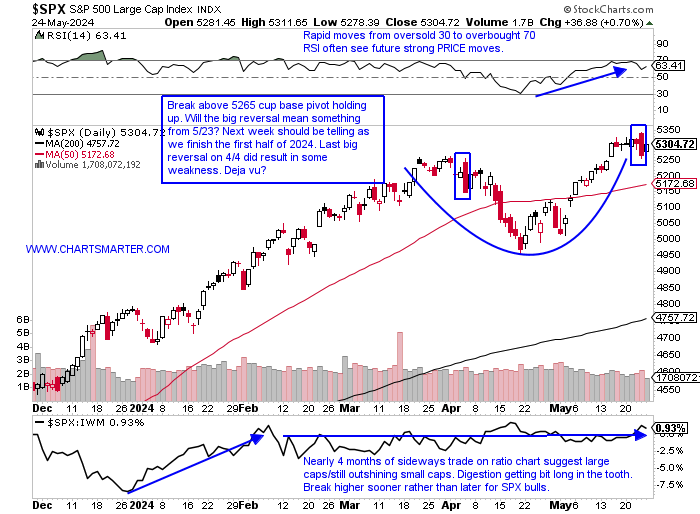
- Will the big bearish reversal last Thursday have a similar effect to the last one on 5/23? Of course, no one knows and the daily chart of the S&P 500 did record a bullish harami candle and the trend is still firmly higher so chances are the damage will be limited. Add to that holiday-shortened weeks traditionally being bullish and with fresh money getting ready to flow in at the start of June. Other major benchmarks have met roadblocks as the very round numbers, with the Dow 40000 hats a bit premature with just one CLOSE above the figure on 5/17 by a measly 3 points. It has since pulled back 1000 points after the double top there from March with the bearish engulfing candle on 3/22 and the completion of a bearish evening star on 4/1. The Nasdaq came within 4 handles of 17000 Thursday before its own nasty reversal. The MONTHLY chart of the S&P 500 shows good support at the very round 5000 number and the longer term time frame speaks to more PRICE appreciation into year-end with good action POST breakout above the cup with handle which now has a target to 5700.
Dollar Difficulty:
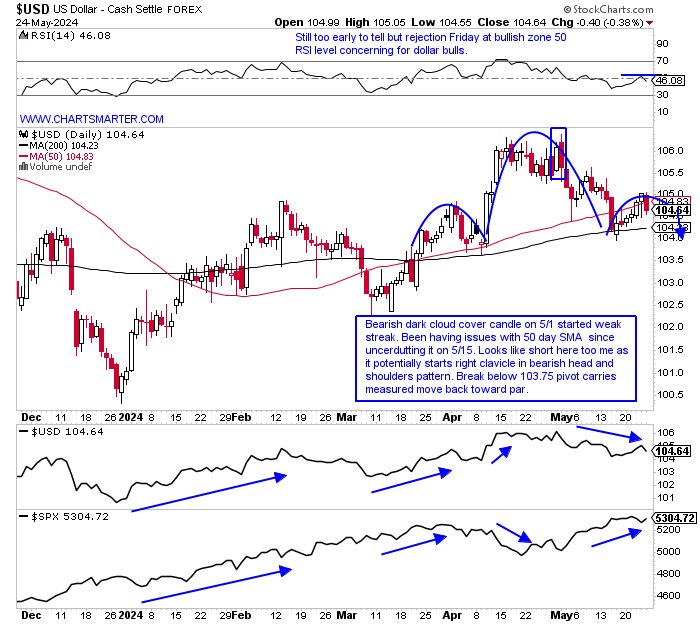
- The dollar is in a precarious situation as it may be ready to roll over. The daily chart below shows a potential bearish head and shoulders formation. Softness started with the bearish dark clouder cover candle on 5/1 which also attempted to break above a bull flag but CLOSED very poorly. The greenback was on a 4 session win streak last week coming into Friday but ended up CLOSING below the 50-day SMA. As far as overall market implications notice at the bottom of the chart below that January and February they traded higher in tandem and did so again in March. Since mid-April however, it started to trade to its normal inverse relationship with the dollar higher and market trading lower. As May took hold the opposite occurred with the S&P 500 seeing a bump higher as the dollar fell. The dollar's action will often have a direct impact on how commodities trade and we will focus later on copper and silver, but here is crude oil and it is showing some positive RSI divergence and trying to shore up some support near a prior bullish ascending triangle breakout. If it can hold 76 here I think with some potential dollar weakness it can start trading higher in the second half of 2024.
Doctors Visit:
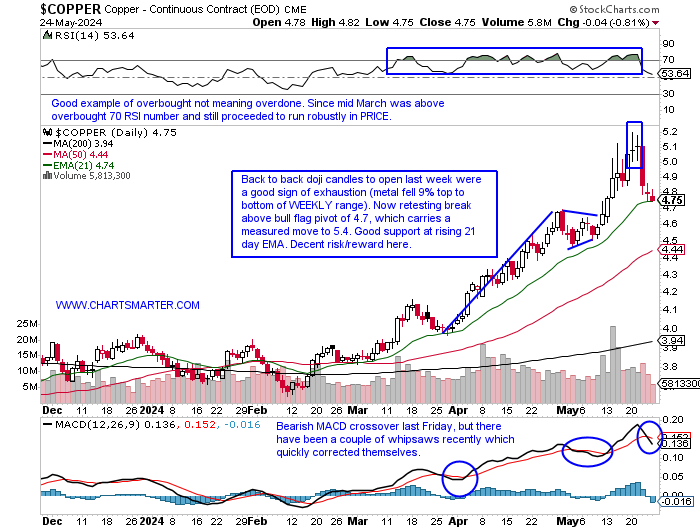
- Copper is often referred to as "doctor", as to its gauge of economic strength or weakness depending on its movements. One can see below that it has been acting firmly but it pulled back the last 3 days of last week to "visit" its upward-sloping 21. day EMA. Since breaking above that line in February it has been comforting and provided support. The MONTHLY chart shows it is in an area of familiar resistance at the "round" 5 number, only having been above it in March 2022, recording a bearish shooting star candle and starting a downtrend that was stopped in July that at its 200-day SMA which registered a bullish hammer. Notice this month so far is shaping out a very similar candle, although it has all of next week to change that by 5/31. The big recent move from 4-5 came after the four straight months between November and February all CLOSED very taut within just 9 pennies of each other. As far as individual names go I prefer as I have for a long time SCCO over FCX with the ratio chart confirming it. FCX is in an interesting spot here as it is just below a bull flag breakout that carries a measured move to 70, and I think a move into the very round 50 number is a good entry as that would also be the first touch of the rising 50 day SMA after the breakout, often an ideal entry point.
Silver Lining:
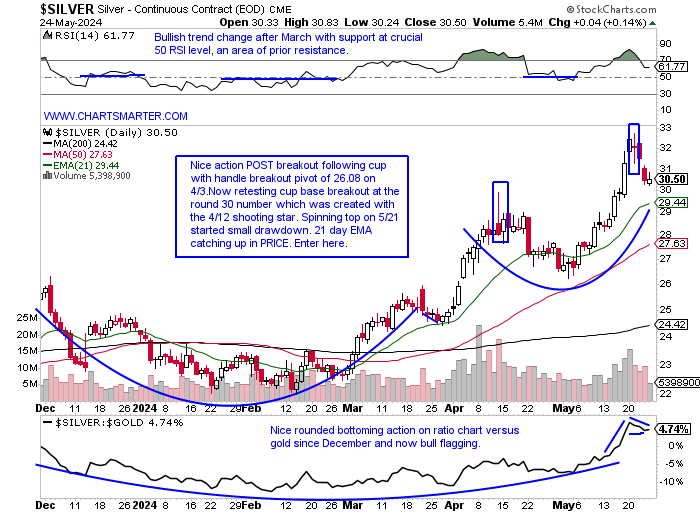
- Silver looks like it will be undergoing a big test next week as it retests a former cup base breakout right at the round 30 number. Most breakouts are retested to prove their validity and there was some bearish RSI divergence in April and May and some dubious candlesticks that precipitated the downward move. Perhaps the selling is coming as seasonality tends to be weak this summer with the exception of July which over the last 4 years has an MONTHLY gain of nearly 9%. As for breakouts being retested notice here on the WEEKLY chart that it did so at the 26 area 3 weeks back following a breakout above a long bullish ascending triangle, and the measured move to 34 has not yet been met. Looking on yet another timeframe notice how important the round 30 number has been on the MONTHLY chart as it is attempting to break above a 30.01 pivot that was created in August 2020 (that month and February 2021 were the only months that were above 30 intramonth in the last decade, but neither CLOSED above it). That makes this Friday's finish crucial to see if it can CLOSE above 30. Some individual names to consider include PAAS which itself is retreating into a former bull flag breakout just above the very round 20 number.
Semis Burden:
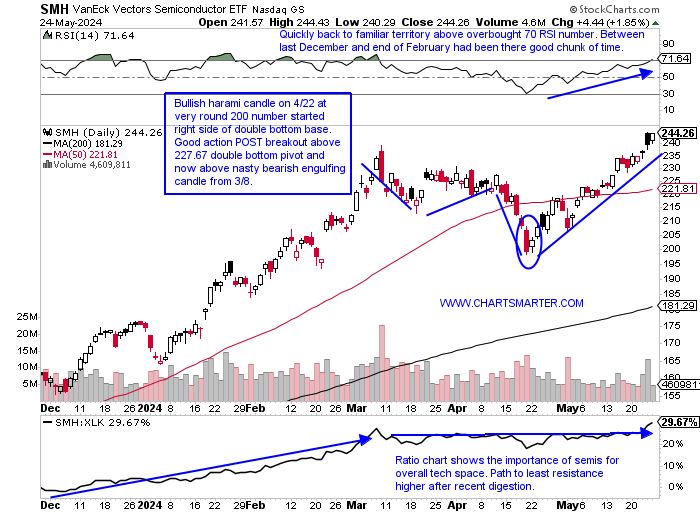
- A lot of responsibility has been placed on the semiconductor's shoulders for technology strength. Can they keep delivering while waiting for other groups within to participate? NVDA did its part this week with Thursday gapping higher by 9% and for good measure adding another 2% Friday, and breakaway gaps to all-time highs are very bullish. It is interesting to see how the third largest name on the planet is the top holding in both the SMH and SOXX, but the composition is different. In the SMH it makes up more than 22% of the fund, while in the SOXX it is less than half of that at 9.8%. That makes their respective charts look a bit different. Below is the chart of the SMH which is above its double-bottom breakout pivot and at all-time highs, while the SOXX has not yet broken above the nasty bearish engulfing candle on 3/8. Composition matters so if you are bullish semis, and especially NVDA it makes sense to buy the SMH, and that can be seen on the ratio chart comparing the two with the SOXX in a downtrend since the start of 2024. Let us take a look at two names in the space below in SMTC and MCHP.
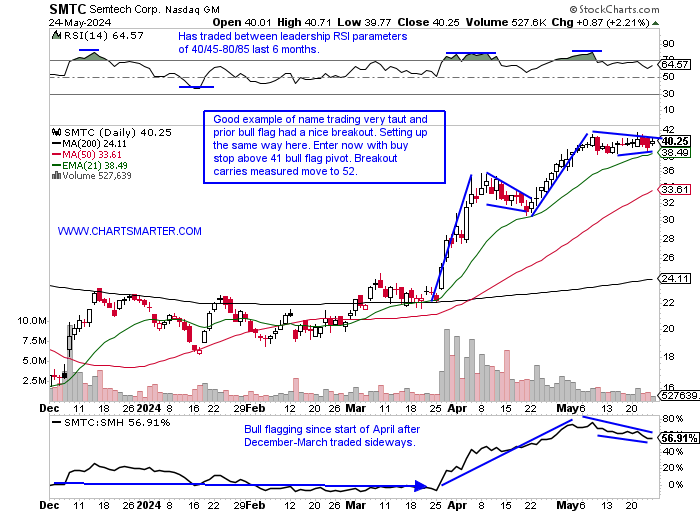
Semtech:
- Semi play up 84% YTD and 94% over last one year period.
- Name 3% off most recent 52-week highs and stock has now gained 200% since the overall market lows last November. MONTHLY chart shows gains in 5 of last 6 and look for at least move into upside gap fill into August 2022 near 45.
- FOUR straight positive earnings reactions mostly higher up 6.8, 16.3, 10.1, and 4/9% on 3/29, 12/7, 9/8, and 6/8/23.
- Enter with buy stop above bull flag.
- Entry SMTC 41. Stop 38.
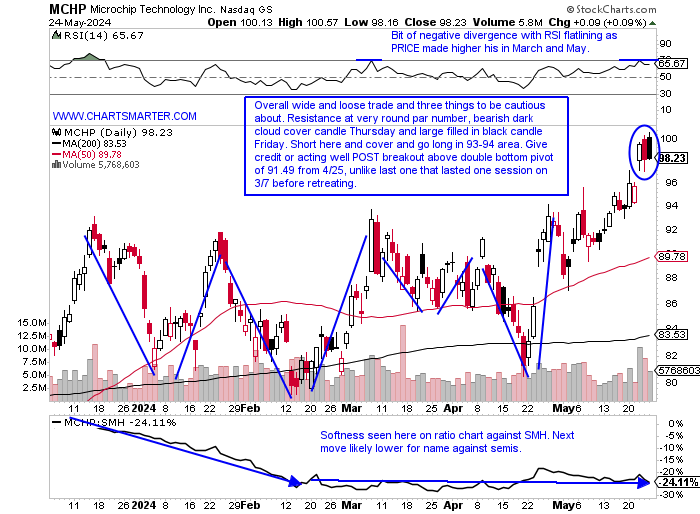
Microchip:
- Semi play up 9% YTD and 33% over last one year period. Dividend yield of 1.8%.
- Name 2% off most recent 52 week highs and on WEEKLY chart we will be looking for a pullback into bullish ascending triangle breakout at 93-94 level. Breakout carries measured move to 118. Notice weakness against semis since start of 2023.
- Earnings reactions mostly lower down 1.8, 1.6, and 6.8% on 5/7, 2/2, and 8/4/23, and rose 3.8% on 11/3/23.
- Enter short into bearish filled in black candle/very round par number.
- Entry MCHP here. Buy stop 101.
This article requires a Chartsmarter membership. Please click here to join.
"When it's over leave, don't continue watering a dead flower." - Unknown
Canary in the Coal Mine?
- Will the big bearish reversal last Thursday have a similar effect to the last one on 5/23? Of course, no one knows and the daily chart of the S&P 500 did record a bullish harami candle and the trend is still firmly higher so chances are the damage will be limited. Add to that holiday-shortened weeks traditionally being bullish and with fresh money getting ready to flow in at the start of June. Other major benchmarks have met roadblocks as the very round numbers, with the Dow 40000 hats a bit premature with just one CLOSE above the figure on 5/17 by a measly 3 points. It has since pulled back 1000 points after the double top there from March with the bearish engulfing candle on 3/22 and the completion of a bearish evening star on 4/1. The Nasdaq came within 4 handles of 17000 Thursday before its own nasty reversal. The MONTHLY chart of the S&P 500 shows good support at the very round 5000 number and the longer term time frame speaks to more PRICE appreciation into year-end with good action POST breakout above the cup with handle which now has a target to 5700.
Dollar Difficulty:
- The dollar is in a precarious situation as it may be ready to roll over. The daily chart below shows a potential bearish head and shoulders formation. Softness started with the bearish dark clouder cover candle on 5/1 which also attempted to break above a bull flag but CLOSED very poorly. The greenback was on a 4 session win streak last week coming into Friday but ended up CLOSING below the 50-day SMA. As far as overall market implications notice at the bottom of the chart below that January and February they traded higher in tandem and did so again in March. Since mid-April however, it started to trade to its normal inverse relationship with the dollar higher and market trading lower. As May took hold the opposite occurred with the S&P 500 seeing a bump higher as the dollar fell. The dollar's action will often have a direct impact on how commodities trade and we will focus later on copper and silver, but here is crude oil and it is showing some positive RSI divergence and trying to shore up some support near a prior bullish ascending triangle breakout. If it can hold 76 here I think with some potential dollar weakness it can start trading higher in the second half of 2024.
Doctors Visit:
- Copper is often referred to as "doctor", as to its gauge of economic strength or weakness depending on its movements. One can see below that it has been acting firmly but it pulled back the last 3 days of last week to "visit" its upward-sloping 21. day EMA. Since breaking above that line in February it has been comforting and provided support. The MONTHLY chart shows it is in an area of familiar resistance at the "round" 5 number, only having been above it in March 2022, recording a bearish shooting star candle and starting a downtrend that was stopped in July that at its 200-day SMA which registered a bullish hammer. Notice this month so far is shaping out a very similar candle, although it has all of next week to change that by 5/31. The big recent move from 4-5 came after the four straight months between November and February all CLOSED very taut within just 9 pennies of each other. As far as individual names go I prefer as I have for a long time SCCO over FCX with the ratio chart confirming it. FCX is in an interesting spot here as it is just below a bull flag breakout that carries a measured move to 70, and I think a move into the very round 50 number is a good entry as that would also be the first touch of the rising 50 day SMA after the breakout, often an ideal entry point.
Silver Lining:
- Silver looks like it will be undergoing a big test next week as it retests a former cup base breakout right at the round 30 number. Most breakouts are retested to prove their validity and there was some bearish RSI divergence in April and May and some dubious candlesticks that precipitated the downward move. Perhaps the selling is coming as seasonality tends to be weak this summer with the exception of July which over the last 4 years has an MONTHLY gain of nearly 9%. As for breakouts being retested notice here on the WEEKLY chart that it did so at the 26 area 3 weeks back following a breakout above a long bullish ascending triangle, and the measured move to 34 has not yet been met. Looking on yet another timeframe notice how important the round 30 number has been on the MONTHLY chart as it is attempting to break above a 30.01 pivot that was created in August 2020 (that month and February 2021 were the only months that were above 30 intramonth in the last decade, but neither CLOSED above it). That makes this Friday's finish crucial to see if it can CLOSE above 30. Some individual names to consider include PAAS which itself is retreating into a former bull flag breakout just above the very round 20 number.
Semis Burden:
- A lot of responsibility has been placed on the semiconductor's shoulders for technology strength. Can they keep delivering while waiting for other groups within to participate? NVDA did its part this week with Thursday gapping higher by 9% and for good measure adding another 2% Friday, and breakaway gaps to all-time highs are very bullish. It is interesting to see how the third largest name on the planet is the top holding in both the SMH and SOXX, but the composition is different. In the SMH it makes up more than 22% of the fund, while in the SOXX it is less than half of that at 9.8%. That makes their respective charts look a bit different. Below is the chart of the SMH which is above its double-bottom breakout pivot and at all-time highs, while the SOXX has not yet broken above the nasty bearish engulfing candle on 3/8. Composition matters so if you are bullish semis, and especially NVDA it makes sense to buy the SMH, and that can be seen on the ratio chart comparing the two with the SOXX in a downtrend since the start of 2024. Let us take a look at two names in the space below in SMTC and MCHP.
Semtech:
- Semi play up 84% YTD and 94% over last one year period.
- Name 3% off most recent 52-week highs and stock has now gained 200% since the overall market lows last November. MONTHLY chart shows gains in 5 of last 6 and look for at least move into upside gap fill into August 2022 near 45.
- FOUR straight positive earnings reactions mostly higher up 6.8, 16.3, 10.1, and 4/9% on 3/29, 12/7, 9/8, and 6/8/23.
- Enter with buy stop above bull flag.
- Entry SMTC 41. Stop 38.
Microchip:
- Semi play up 9% YTD and 33% over last one year period. Dividend yield of 1.8%.
- Name 2% off most recent 52 week highs and on WEEKLY chart we will be looking for a pullback into bullish ascending triangle breakout at 93-94 level. Breakout carries measured move to 118. Notice weakness against semis since start of 2023.
- Earnings reactions mostly lower down 1.8, 1.6, and 6.8% on 5/7, 2/2, and 8/4/23, and rose 3.8% on 11/3/23.
- Enter short into bearish filled in black candle/very round par number.
- Entry MCHP here. Buy stop 101.