Nasdaq Thrust:
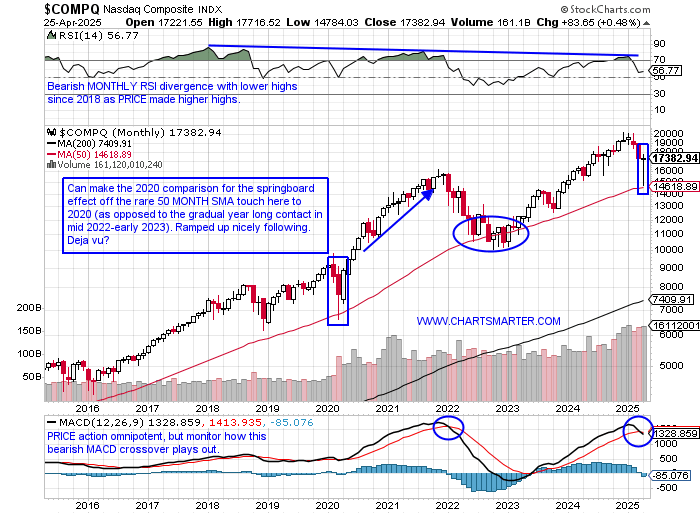
- Many like to proclaim a true rally can not occur without the financials. I would say technology is more important and the MONTHLY chart below of the Nasdaq shows the infrequent contact with the 50 MONTH SMA. It was nearly precise in touching the secular line and was a 50% retracement from the run from the very round 10000 to 20000 from October 2022 to last December. Where is its near-term likely path from here? The WEEKLY timeframe has a nice look to it, with a bullish piercing line and engulfing candle during the weeks ending 4/11 and 4/25, both rising by 7% (those were both the best returns since the week ending 11/11/22 that rose by 8.1%). Both CLOSED in the upper half of the WEEKLY range and it now has a path to the 50 WEEK SMA which is just above the 18000 figure. In hindsight, the rare contact with the oversold 30 RSI number was an excellent signal. Notice on the DAILY chart the third time was the charm in breaking above the bear flag breakdown, which did meet its measured move lower of roughly 2500 handles. My feeling is this still has another 1000 handle run, on the daily timeframe that will be near the declining 200-day SMA. If and when that occurs we can reassess from there.
Semi Standout:
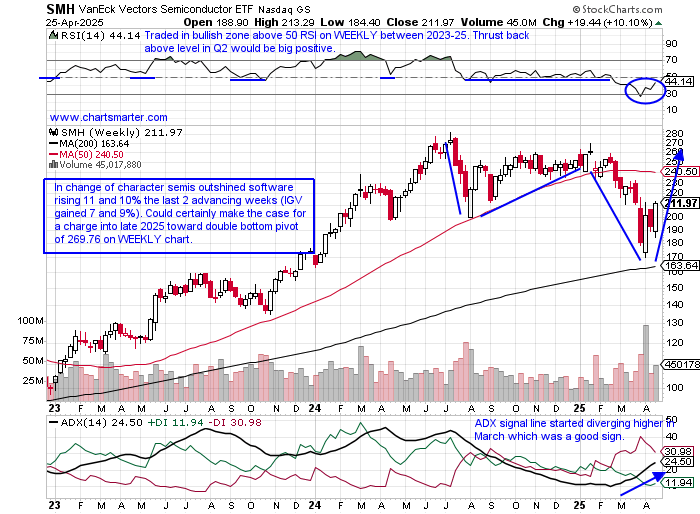
- It is no secret semiconductors have been overshadowed by software for some time. For sure it is a good development that the group is starting to catch a bid. Truth be told it has plenty of work to do as the SMH is now 25% off its most recent 52-week highs as the IGV is "just" 15% off its own annual peak. Zooming out on the WEEKLY chart below on can see the right side of a possible double bottom base setting up. Two of the last 3 weeks have recorded double-digit advances and for some historical context, the last time the fund put up very strong returns like the current example was the week ending 11/11/22 that screamed higher by more than 15% (recorded a doji candle the next week but ground higher after giving some back) and the 19% combined gain the weeks ending between 5/19-26/23, both in boxes, and also pushed upward. The daily chart sports a bullish island reversal completed on 4/23 (preceded by the gap down on 4/16) and it is right at the top of the 4/9 surge that rose 17%, not a typo. Bulls are pointing to the break above the 50 RSI number to record a bullish trend change (notice the support and resistance at the 50 level the last 6 months). Interestingly, NVDA "lagged" up 9% for the week and recorded a bullish piercing line candle, the only member of the top 10 holdings to not register a bullish engulfing candle (except AMD).
Recent Examples:
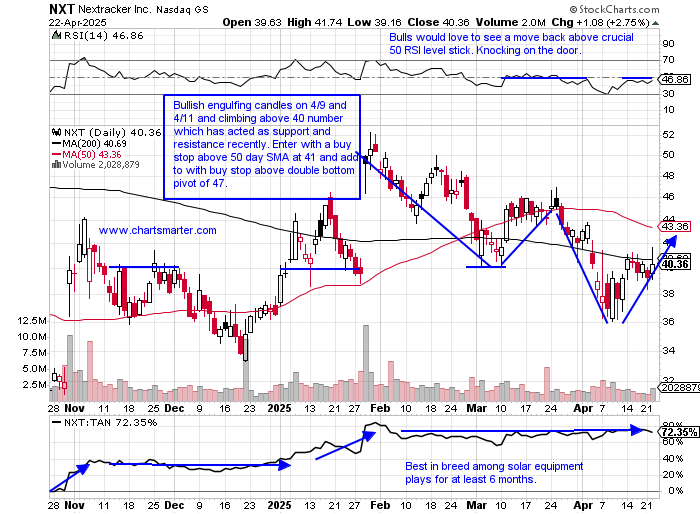
- Solar equipment names are attempting to shine, pun intended, as the TAN on the MONTHLY chart with 3 sessions left in April is trying to put up a bullish hammer (notice how the robust 10-month winning streak from the COVID era ended with a similar inverse bearish shooting star candle in January 2021). Best-in-breed GEV looks poised to travel toward an upside gap fill from the 4/20 session in the near term. Below is another leader in the space with the daily chart of NXT and how it appeared in our 4/23 Technology Note. We suggested a purchase with a buy stop above 41 and it is not quickly approaching an add-on buy point above a double bottom pivot of 47. On its MONTHLY chart April is sporting a bullish hammer candle after testing the lows of the huge January jump of 40%, which also was the scene of a breakout ABOVE a bearish head and shoulders pattern and we know from FALSE moves come fast ones in the opposite direction.
Special Situations:
DoorDash:
- Internet play up 12% YTD and 42% over last one year period.
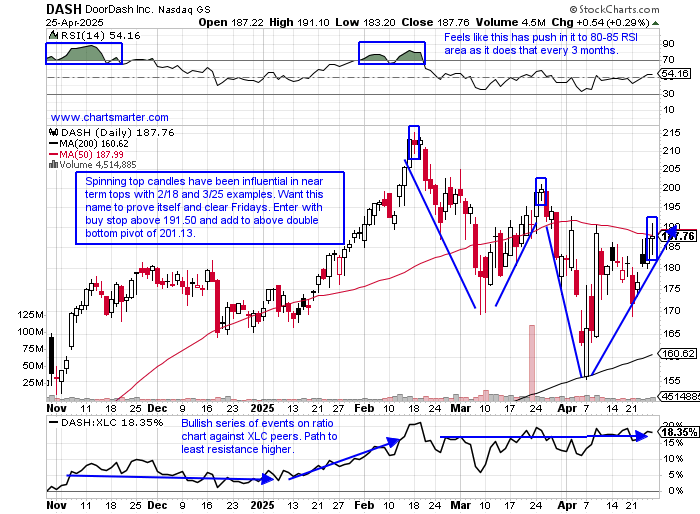
- Name 13% off most recent 52-week highs and MONTHLY chart shows good consistency since Q4 '22 with just two instances of consecutive losses. Now setting up deep add-on cup with handle pivot of 215.35 in base that started with bearish shooting star in November 2021.
- Earnings reactions mostly higher up 4, .9, and 8.3% on 2/12, 10/31, and 8/2/24 and fell 10.3% on 5/2/24.
- Enter with buy stop above problematic spinning top candle.
- Entry DASH 191.50. Stop 183.
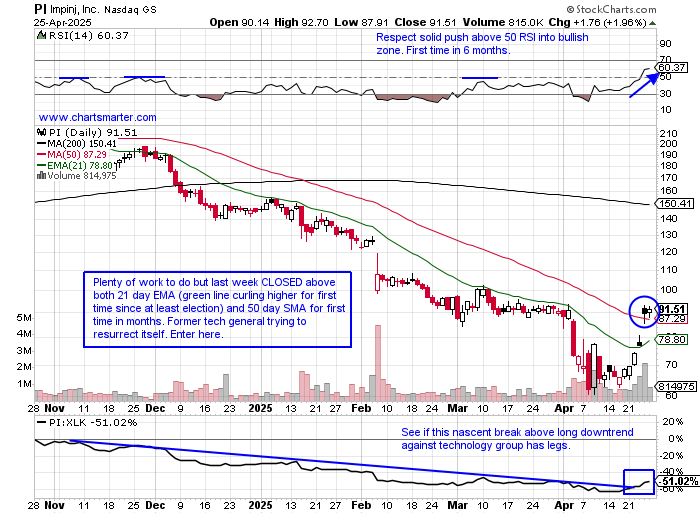
Impinj:
- Tech play down 37% YTD and 39% over last one year period.
- Name 62% off most recent 52-week highs and MONTHLY chart shows name making higher lows since COVID and April with 3 days left is recording a bullish gravestone doji candle. Volume already the strongest since November 2017. Looking to end 4-month losing streak and last one led to an 11 of 12-month win streak between October 2023 to November 2024.
- Earnings reactions mixed up 16.4 and 4.4% on 4/24 and 7/24/24 and fell 15.2 and 13.6% on 2/6 and 10/24/24.
- Enter after 21-day EMA/50-day SMA reclaim.
- Entry PI here. Stop 85.
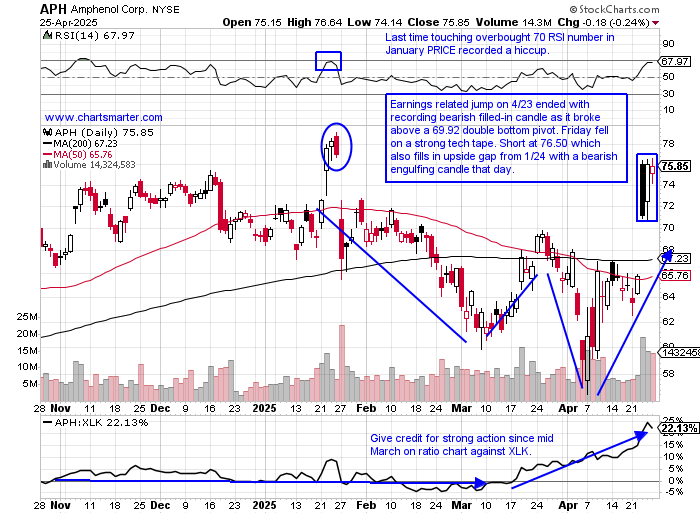
Amphenol:
- Electronic components play up 9% YTD and 26% over last one year period. Dividend yield of .9%.
- Name 4% off most recent 52-week highs and MONTHLY chart trading into long spinning top candle from January at the round 80 number. On DAILY chart still think this can fill in the earnings related gap in the near term near the 65 level before resuming uptrend.
- Earnings reactions mostly higher up 8.2, 7, and 2.4% on 4/23, 1/22, and 10/23/24 and fell 6.4% on 7/24/24.
- Enter short into large bearish filled-in candle.
- Entry APH 76.50. Buy stop 79.25.
Good luck.
Entry summaries:
Buy stop above problematic spinning top candle DASH 191.50. Stop 183.
Buy after 21-day EMA/50-day SMA reclaim PI here. Stop 85.
Short into large bearish filled-in candle APH 76.50. Buy stop 79.25.
This article requires a Chartsmarter membership. Please click here to join.
Nasdaq Thrust:
- Many like to proclaim a true rally can not occur without the financials. I would say technology is more important and the MONTHLY chart below of the Nasdaq shows the infrequent contact with the 50 MONTH SMA. It was nearly precise in touching the secular line and was a 50% retracement from the run from the very round 10000 to 20000 from October 2022 to last December. Where is its near-term likely path from here? The WEEKLY timeframe has a nice look to it, with a bullish piercing line and engulfing candle during the weeks ending 4/11 and 4/25, both rising by 7% (those were both the best returns since the week ending 11/11/22 that rose by 8.1%). Both CLOSED in the upper half of the WEEKLY range and it now has a path to the 50 WEEK SMA which is just above the 18000 figure. In hindsight, the rare contact with the oversold 30 RSI number was an excellent signal. Notice on the DAILY chart the third time was the charm in breaking above the bear flag breakdown, which did meet its measured move lower of roughly 2500 handles. My feeling is this still has another 1000 handle run, on the daily timeframe that will be near the declining 200-day SMA. If and when that occurs we can reassess from there.
Semi Standout:
- It is no secret semiconductors have been overshadowed by software for some time. For sure it is a good development that the group is starting to catch a bid. Truth be told it has plenty of work to do as the SMH is now 25% off its most recent 52-week highs as the IGV is "just" 15% off its own annual peak. Zooming out on the WEEKLY chart below on can see the right side of a possible double bottom base setting up. Two of the last 3 weeks have recorded double-digit advances and for some historical context, the last time the fund put up very strong returns like the current example was the week ending 11/11/22 that screamed higher by more than 15% (recorded a doji candle the next week but ground higher after giving some back) and the 19% combined gain the weeks ending between 5/19-26/23, both in boxes, and also pushed upward. The daily chart sports a bullish island reversal completed on 4/23 (preceded by the gap down on 4/16) and it is right at the top of the 4/9 surge that rose 17%, not a typo. Bulls are pointing to the break above the 50 RSI number to record a bullish trend change (notice the support and resistance at the 50 level the last 6 months). Interestingly, NVDA "lagged" up 9% for the week and recorded a bullish piercing line candle, the only member of the top 10 holdings to not register a bullish engulfing candle (except AMD).
Recent Examples:
- Solar equipment names are attempting to shine, pun intended, as the TAN on the MONTHLY chart with 3 sessions left in April is trying to put up a bullish hammer (notice how the robust 10-month winning streak from the COVID era ended with a similar inverse bearish shooting star candle in January 2021). Best-in-breed GEV looks poised to travel toward an upside gap fill from the 4/20 session in the near term. Below is another leader in the space with the daily chart of NXT and how it appeared in our 4/23 Technology Note. We suggested a purchase with a buy stop above 41 and it is not quickly approaching an add-on buy point above a double bottom pivot of 47. On its MONTHLY chart April is sporting a bullish hammer candle after testing the lows of the huge January jump of 40%, which also was the scene of a breakout ABOVE a bearish head and shoulders pattern and we know from FALSE moves come fast ones in the opposite direction.
Special Situations:
DoorDash:
- Internet play up 12% YTD and 42% over last one year period.
- Name 13% off most recent 52-week highs and MONTHLY chart shows good consistency since Q4 '22 with just two instances of consecutive losses. Now setting up deep add-on cup with handle pivot of 215.35 in base that started with bearish shooting star in November 2021.
- Earnings reactions mostly higher up 4, .9, and 8.3% on 2/12, 10/31, and 8/2/24 and fell 10.3% on 5/2/24.
- Enter with buy stop above problematic spinning top candle.
- Entry DASH 191.50. Stop 183.
Impinj:
- Tech play down 37% YTD and 39% over last one year period.
- Name 62% off most recent 52-week highs and MONTHLY chart shows name making higher lows since COVID and April with 3 days left is recording a bullish gravestone doji candle. Volume already the strongest since November 2017. Looking to end 4-month losing streak and last one led to an 11 of 12-month win streak between October 2023 to November 2024.
- Earnings reactions mixed up 16.4 and 4.4% on 4/24 and 7/24/24 and fell 15.2 and 13.6% on 2/6 and 10/24/24.
- Enter after 21-day EMA/50-day SMA reclaim.
- Entry PI here. Stop 85.
Amphenol:
- Electronic components play up 9% YTD and 26% over last one year period. Dividend yield of .9%.
- Name 4% off most recent 52-week highs and MONTHLY chart trading into long spinning top candle from January at the round 80 number. On DAILY chart still think this can fill in the earnings related gap in the near term near the 65 level before resuming uptrend.
- Earnings reactions mostly higher up 8.2, 7, and 2.4% on 4/23, 1/22, and 10/23/24 and fell 6.4% on 7/24/24.
- Enter short into large bearish filled-in candle.
- Entry APH 76.50. Buy stop 79.25.
Good luck.
Entry summaries:
Buy stop above problematic spinning top candle DASH 191.50. Stop 183.
Buy after 21-day EMA/50-day SMA reclaim PI here. Stop 85.
Short into large bearish filled-in candle APH 76.50. Buy stop 79.25.