If one thought the overall markets have been volatile, the energy sector has registered a very ugly reversal. The XLE recorded a nasty double top almost to the penny with intraday highs of on 78.45 and 78.39 on 12/12/16 and 1/24/18 more than a year apart. The ETF now sits 15% off most recent 52 week highs, and CLOSED lower Friday, albeit fractionally. The OIH has encountered even more weakness now 29% off its most recent highs. We know that moves tend to overshoot on both the up and downside and PUMP is a name that may have done just that, yet is holding up on a technical basis. Directly below is the chart and how it appeared in our Thursday 10/19/17 Game Plan and then we taking a present view at the end of this post.
PUMP is a recent energy services IPO that has gained just 1% since inception in March. There have been just two earnings reactions with a gain of 3.2% on 8/9 and a loss of 1% on 5/11. The stock is on an impressive 5 week winning streak adding more than a combined 22%, although the last 2 weeks recorded a spinning top and shooting star candles. Looking left on the chart one sees that the name was stopped cold in the low 15's the first day it started trading public on 3/17, then again on 4/12, 6/13 and again on 10/10 (in fact there has been just one CLOSE above 15, by one penny on 10/11). Enter PUMP with a buy stop above a bullish ascending triangle trigger of 15.25 which carries a measured move to 19.50.

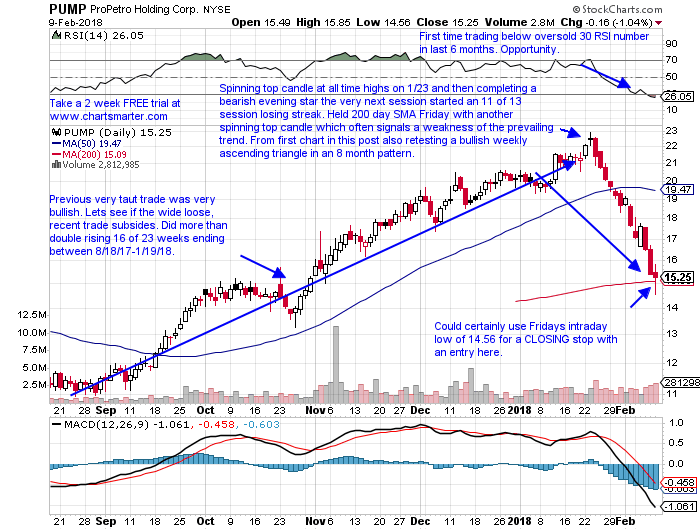
Trigger PUMP 15.25. Stop 14.
Taking a more recent look PUMP has lost a third of its value down 33% from most recent 52 week highs and is now down 24% YTD. It is on a current 3 week losing streak with all 3 CLOSING at the lows for the weekly range creating a bearish three black crows pattern. Remember however those are secondary indicators ALWAYS to price. Fridays action could pose a nice risk/reward scenario off the still upward sloping 200 day SMA. It did hold the 15 level which held a lot of significance dating back to the stock first trading public in March '17.
If you liked what you read why not visit www.chartsmarter.com.
If one thought the overall markets have been volatile, the energy sector has registered a very ugly reversal. The XLE recorded a nasty double top almost to the penny with intraday highs of on 78.45 and 78.39 on 12/12/16 and 1/24/18 more than a year apart. The ETF now sits 15% off most recent 52 week highs, and CLOSED lower Friday, albeit fractionally. The OIH has encountered even more weakness now 29% off its most recent highs. We know that moves tend to overshoot on both the up and downside and PUMP is a name that may have done just that, yet is holding up on a technical basis. Directly below is the chart and how it appeared in our Thursday 10/19/17 Game Plan and then we taking a present view at the end of this post.
PUMP is a recent energy services IPO that has gained just 1% since inception in March. There have been just two earnings reactions with a gain of 3.2% on 8/9 and a loss of 1% on 5/11. The stock is on an impressive 5 week winning streak adding more than a combined 22%, although the last 2 weeks recorded a spinning top and shooting star candles. Looking left on the chart one sees that the name was stopped cold in the low 15's the first day it started trading public on 3/17, then again on 4/12, 6/13 and again on 10/10 (in fact there has been just one CLOSE above 15, by one penny on 10/11). Enter PUMP with a buy stop above a bullish ascending triangle trigger of 15.25 which carries a measured move to 19.50.
Trigger PUMP 15.25. Stop 14.
Taking a more recent look PUMP has lost a third of its value down 33% from most recent 52 week highs and is now down 24% YTD. It is on a current 3 week losing streak with all 3 CLOSING at the lows for the weekly range creating a bearish three black crows pattern. Remember however those are secondary indicators ALWAYS to price. Fridays action could pose a nice risk/reward scenario off the still upward sloping 200 day SMA. It did hold the 15 level which held a lot of significance dating back to the stock first trading public in March '17.
If you liked what you read why not visit www.chartsmarter.com.