Technology Overview:
- The Nasdaq, like the the S&P 500 and Dow, ended the day near the UNCH mark Friday, unusual for an end of quarter session. The tech heavy benchmark rose .7% for the week, and for the last three has CLOSED at or in the upper half of the weekly range. It seems hesitant to decisively push above the round 8000 number. It now sports a cup base trigger of 8134 which could really accelerate the index, if a breakout were to occur. We will speak about the disappointing semiconductor arena later, but lets accentuate the positives. Software, via the PSJ, has jumped 37% YTD, and the IBB has gained 14% so far in 2018. Of course Monday kicks in October, and looking back over the last 5 years October has CLOSED the month higher from where it began 80% of the time, and November is a perfect 5 for 5 (November has been the new Santa Claus). Lets keep in mind the Nasdaq is going for a SEVENTH yearly gain in a row, and it looks very likely as it is up 16.6% YTD, well outperforming its next best benchmark competitor, the Russell 2000 which is higher by 10.5% so far. The latter is a bit concerning as former resistance at the round 1700 number between June-August, which became support this month, now looks tenuous again.
Examples:
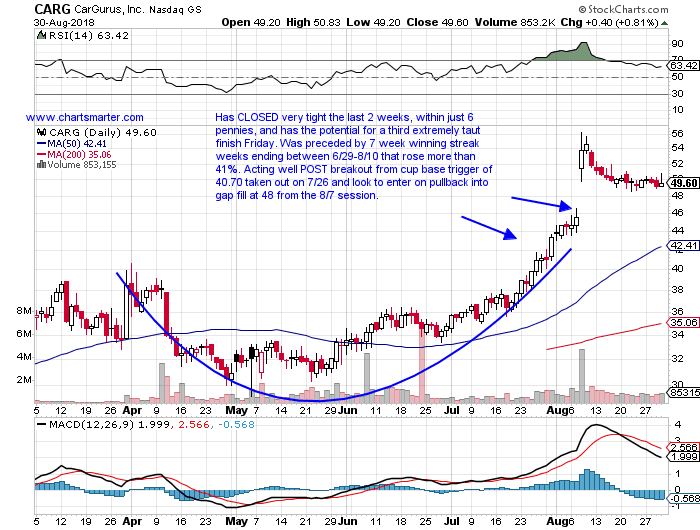
- There are certain patterns that I admire more than others. The round number theory I happen to be a big fan of, and below is another set up I look for too, the gap fill. OXY did it recently and is now higher 9 of the last 12 sessions. FLT filled in a gap this June and has responded well since, and in retail SCVL did it this week. Below is the chart of CARG, an online auto play, and how it was presented in our Friday 8/31 Game Plan. The name is almost exactly one year old, and has doubled since its first week coming public. The round number theory came into play with this name as the 40 figure was the scene in a cup base breakout trigger of 40.70 on 7/26 in a pattern 4 months long. It filled in a gap on 9/6 from the session precisely from the 8/7 session and has since risen nearly 20%. It is an excellent example of why new issues in strong sectors should be taken seriously.
Seasonality:
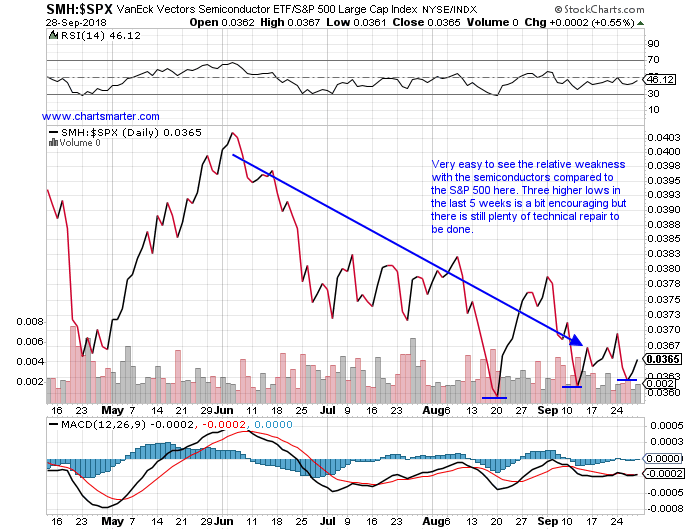
- The XLK continues to keep grinding higher, and in the process keeping nervous bulls at bay. That is a good thing as it adds fuel to the fire, to keep the rally alive. One can not announce a discussion about technology overall without mentioning the semiconductors. They are ubiquitous in nearly every product one can think of from automobiles, to mobile phones, to home appliances. I think you get the picture. If the space is acting soft it could be a tell to which directions the markets could turn. Below is a ratio chart comparing the performance of the semiconductors to the S&P 500. A picture is worth a thousand words. I chart everyday and it still amazes me how well the Nasdaq has held up, even with some huge semi laggards, which were former leaders, from this group such as MU, LRCX and AMBA all down between 30-42%. If this sector can get its act together, to be fair there are big winners like NVDA, XLNX and QCOM, we could see a traditional, robust year end move.
Special Situations:
Peer BAH is higher by 30% YTD, although did slip 5.4% last week. CNDT is a somewhat recent XRX spinoff higher by 39% YTD and 43% over the last one year period. Earnings have been mostly higher with gains of 5.4, 11.7, 3.3 and 5.3% on 8/8, 2/21, 11/8, 17 and 8/9/17 and a loss of 2.7% on 5/9. The stock is higher 7 of the last 9 weeks, beginning with a 5 week winning streak the weeks ending 8/3-31 which rose 25%. It is acting well POST breakout from a cup base trigger of 21.16 taken out on 8/17. Enter CNDT with a buy stop above a bull flag trigger of 23 which carries a measured move to 28.
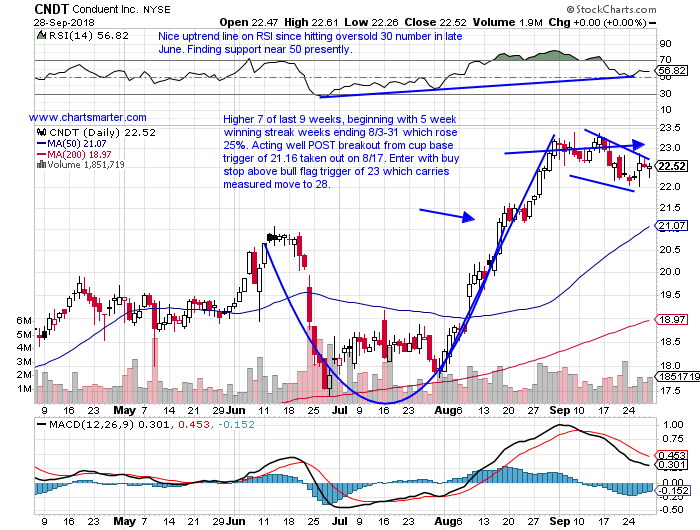
Trigger CNDT 23. Stop 22.
Bifurcation in the space with LITE down 19% from most recent 52 week highs, while VIAV is just 2% off its. CIEN is a telecommunications play higher by 49% YTD and 42% over the last one year period. Earnings have been mixed with larger gains of 12.4 and 10.1% on 8/30 and 3/6 and losses of 4.2 and 1.9% on 5/31 and 12/7/17. The stock is higher 7 of the last 9 weeks, that began with a 5 week winning streak the weeks ending between 8/3-31 that rose by a combined 23%. More positive is the action the last 4 weeks with all CLOSING very taut within just .34 of each other. It has acted well POST breakout from a cup base trigger of 27.64 taken out on 8/24. Enter CIEN with a buy stop above a bull flag trigger of 31.50 which carries a measured move to 36.
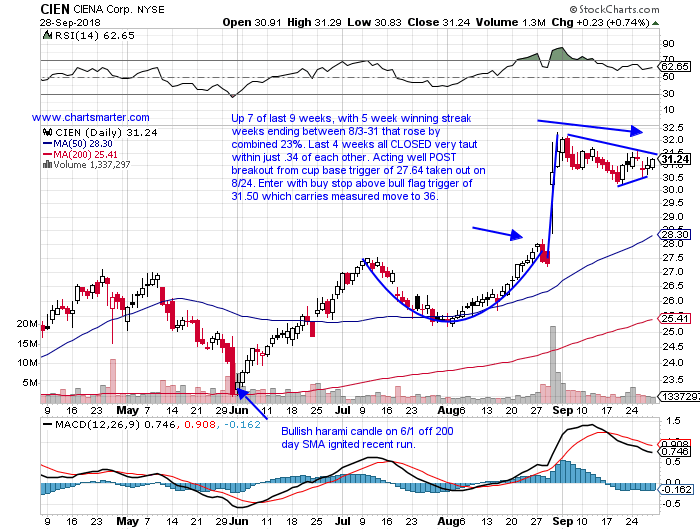
Trigger CIEN 31.50. Stop 30.25.
Peers CDW and ACXM acting rather well too. DXC is a computer services play lower by 1% YTD and higher by 9% over the last one year period and sports a small dividend yield of .8%. Earnings have been mostly higher with advances of 2.2, 5.5, 4.6 and 7.1% on 8/8, 2/9, 11/8/17 and 8/9/17 and a loss of 5.5% on 5/25. The stock is higher 5 of the last 7 weeks, with all 5 up weeks CLOSING in the upper half of the weekly range. The very round 90 number was tough to get above between April-August and was the pivot in a bullish ascending triangle, with the break above in August carrying a measured move to 103. More recently on 91 on 9/12 and enter DXC on a pullback into move at 92.50.
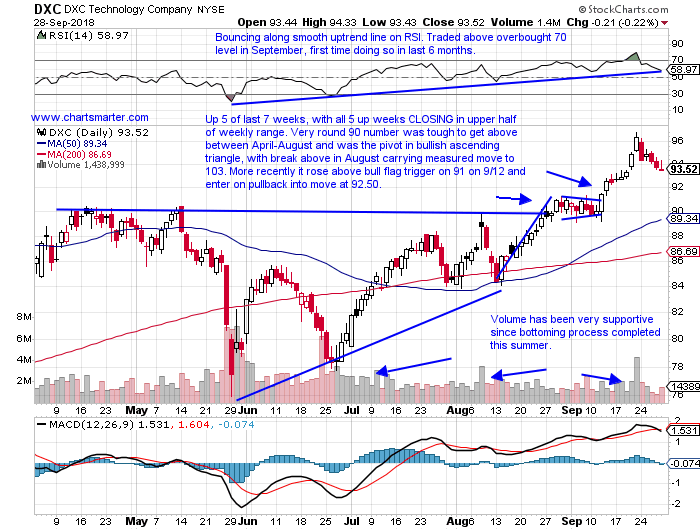
Trigger DXC 92.50. Stop 89.
Stock in fluent in round number theory today after getting stopped at very round 20 number, pun intended. RST is a software play higher by 60% YTD and 92% over the last one year period. Earnings have been well received with FOUR straight positive reactions higher by 4.8, 3.8, .1 and 5.3% on 8/3, 5/10, 3/8 and 11/3/17. The stock is on a powerful 3 week winning streak higher by a combined 28%. Today it recorded a bearish shooting star candle at the 20 figure and look to enter RST on a pullback toward the cup base breakout trigger of 17.59 taken out on 9/18 that jumped 5.5% in huge volume at 18.75.
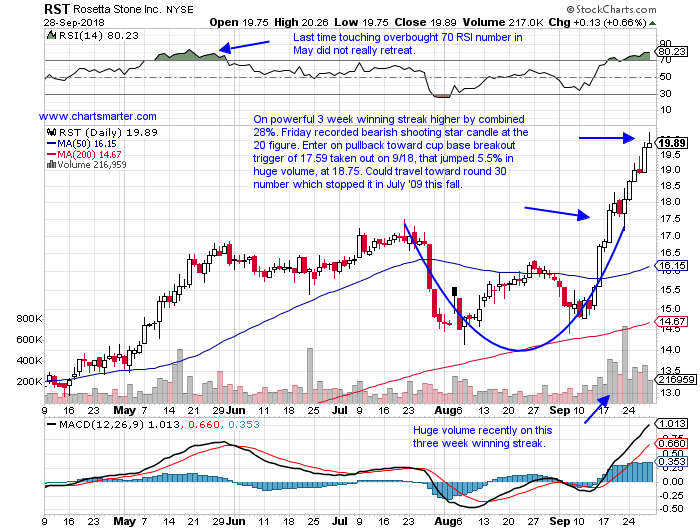
Trigger RST 18.75. Stop 17.
Names that get chopped in half do so for a reason, and rarely come back from such depths. MTSI is a semiconductor laggard lower by 37% YTD and 54% over the last one year period. Earnings have been very ill received with losses of 2.6, 36.7, 18 and 25.5% on 8/1, 2/7, 11/15/17 and 8/2/17, and a gain of 17.6% on 5/2. The stock is lower 7 of the last 11 weeks, and now sits 55% off most recent 52 week highs. Both its 50 and 200 day SMAs are sloping downward, and it recorded a bearish engulfing candle on 9/21 at 50 day SMA resistance. Short MTSI into that pattern at 21.25 and add to below a bearish descending triangle of 19 that carries a measured move to 12.
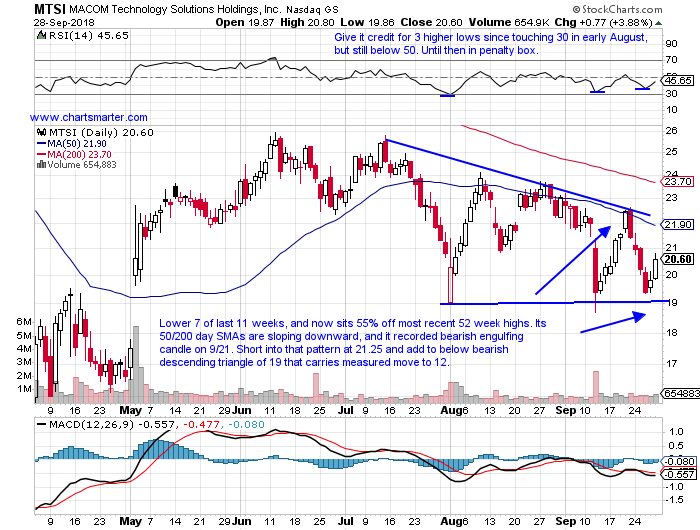
Trigger MTSI 21.25. Buy stop 22.50.
Good luck.
Trigger summaries:
Buy stop above cup base trigger CNDT 23. Stop 22.
Buy stop above cup base trigger CIEN 31.50. Stop 30.25.
Buy pullback into recent bull flag breakout DXC 92.50. Stop 89.
Buy pullback into recent cup base breakout RST 18.75. Stop 17.
Short into recent bearish engulfing candle MTSI 21.25. Buy stop 22.50.
Technology Overview:
- The Nasdaq, like the the S&P 500 and Dow, ended the day near the UNCH mark Friday, unusual for an end of quarter session. The tech heavy benchmark rose .7% for the week, and for the last three has CLOSED at or in the upper half of the weekly range. It seems hesitant to decisively push above the round 8000 number. It now sports a cup base trigger of 8134 which could really accelerate the index, if a breakout were to occur. We will speak about the disappointing semiconductor arena later, but lets accentuate the positives. Software, via the PSJ, has jumped 37% YTD, and the IBB has gained 14% so far in 2018. Of course Monday kicks in October, and looking back over the last 5 years October has CLOSED the month higher from where it began 80% of the time, and November is a perfect 5 for 5 (November has been the new Santa Claus). Lets keep in mind the Nasdaq is going for a SEVENTH yearly gain in a row, and it looks very likely as it is up 16.6% YTD, well outperforming its next best benchmark competitor, the Russell 2000 which is higher by 10.5% so far. The latter is a bit concerning as former resistance at the round 1700 number between June-August, which became support this month, now looks tenuous again.
Examples:
- There are certain patterns that I admire more than others. The round number theory I happen to be a big fan of, and below is another set up I look for too, the gap fill. OXY did it recently and is now higher 9 of the last 12 sessions. FLT filled in a gap this June and has responded well since, and in retail SCVL did it this week. Below is the chart of CARG, an online auto play, and how it was presented in our Friday 8/31 Game Plan. The name is almost exactly one year old, and has doubled since its first week coming public. The round number theory came into play with this name as the 40 figure was the scene in a cup base breakout trigger of 40.70 on 7/26 in a pattern 4 months long. It filled in a gap on 9/6 from the session precisely from the 8/7 session and has since risen nearly 20%. It is an excellent example of why new issues in strong sectors should be taken seriously.

Seasonality:
- The XLK continues to keep grinding higher, and in the process keeping nervous bulls at bay. That is a good thing as it adds fuel to the fire, to keep the rally alive. One can not announce a discussion about technology overall without mentioning the semiconductors. They are ubiquitous in nearly every product one can think of from automobiles, to mobile phones, to home appliances. I think you get the picture. If the space is acting soft it could be a tell to which directions the markets could turn. Below is a ratio chart comparing the performance of the semiconductors to the S&P 500. A picture is worth a thousand words. I chart everyday and it still amazes me how well the Nasdaq has held up, even with some huge semi laggards, which were former leaders, from this group such as MU, LRCX and AMBA all down between 30-42%. If this sector can get its act together, to be fair there are big winners like NVDA, XLNX and QCOM, we could see a traditional, robust year end move.

Special Situations:
Peer BAH is higher by 30% YTD, although did slip 5.4% last week. CNDT is a somewhat recent XRX spinoff higher by 39% YTD and 43% over the last one year period. Earnings have been mostly higher with gains of 5.4, 11.7, 3.3 and 5.3% on 8/8, 2/21, 11/8, 17 and 8/9/17 and a loss of 2.7% on 5/9. The stock is higher 7 of the last 9 weeks, beginning with a 5 week winning streak the weeks ending 8/3-31 which rose 25%. It is acting well POST breakout from a cup base trigger of 21.16 taken out on 8/17. Enter CNDT with a buy stop above a bull flag trigger of 23 which carries a measured move to 28.

Trigger CNDT 23. Stop 22.
Bifurcation in the space with LITE down 19% from most recent 52 week highs, while VIAV is just 2% off its. CIEN is a telecommunications play higher by 49% YTD and 42% over the last one year period. Earnings have been mixed with larger gains of 12.4 and 10.1% on 8/30 and 3/6 and losses of 4.2 and 1.9% on 5/31 and 12/7/17. The stock is higher 7 of the last 9 weeks, that began with a 5 week winning streak the weeks ending between 8/3-31 that rose by a combined 23%. More positive is the action the last 4 weeks with all CLOSING very taut within just .34 of each other. It has acted well POST breakout from a cup base trigger of 27.64 taken out on 8/24. Enter CIEN with a buy stop above a bull flag trigger of 31.50 which carries a measured move to 36.

Trigger CIEN 31.50. Stop 30.25.
Peers CDW and ACXM acting rather well too. DXC is a computer services play lower by 1% YTD and higher by 9% over the last one year period and sports a small dividend yield of .8%. Earnings have been mostly higher with advances of 2.2, 5.5, 4.6 and 7.1% on 8/8, 2/9, 11/8/17 and 8/9/17 and a loss of 5.5% on 5/25. The stock is higher 5 of the last 7 weeks, with all 5 up weeks CLOSING in the upper half of the weekly range. The very round 90 number was tough to get above between April-August and was the pivot in a bullish ascending triangle, with the break above in August carrying a measured move to 103. More recently on 91 on 9/12 and enter DXC on a pullback into move at 92.50.

Trigger DXC 92.50. Stop 89.
Stock in fluent in round number theory today after getting stopped at very round 20 number, pun intended. RST is a software play higher by 60% YTD and 92% over the last one year period. Earnings have been well received with FOUR straight positive reactions higher by 4.8, 3.8, .1 and 5.3% on 8/3, 5/10, 3/8 and 11/3/17. The stock is on a powerful 3 week winning streak higher by a combined 28%. Today it recorded a bearish shooting star candle at the 20 figure and look to enter RST on a pullback toward the cup base breakout trigger of 17.59 taken out on 9/18 that jumped 5.5% in huge volume at 18.75.

Trigger RST 18.75. Stop 17.
Names that get chopped in half do so for a reason, and rarely come back from such depths. MTSI is a semiconductor laggard lower by 37% YTD and 54% over the last one year period. Earnings have been very ill received with losses of 2.6, 36.7, 18 and 25.5% on 8/1, 2/7, 11/15/17 and 8/2/17, and a gain of 17.6% on 5/2. The stock is lower 7 of the last 11 weeks, and now sits 55% off most recent 52 week highs. Both its 50 and 200 day SMAs are sloping downward, and it recorded a bearish engulfing candle on 9/21 at 50 day SMA resistance. Short MTSI into that pattern at 21.25 and add to below a bearish descending triangle of 19 that carries a measured move to 12.

Trigger MTSI 21.25. Buy stop 22.50.
Good luck.
Trigger summaries:
Buy stop above cup base trigger CNDT 23. Stop 22.
Buy stop above cup base trigger CIEN 31.50. Stop 30.25.
Buy pullback into recent bull flag breakout DXC 92.50. Stop 89.
Buy pullback into recent cup base breakout RST 18.75. Stop 17.
Short into recent bearish engulfing candle MTSI 21.25. Buy stop 22.50.