Group Overview:
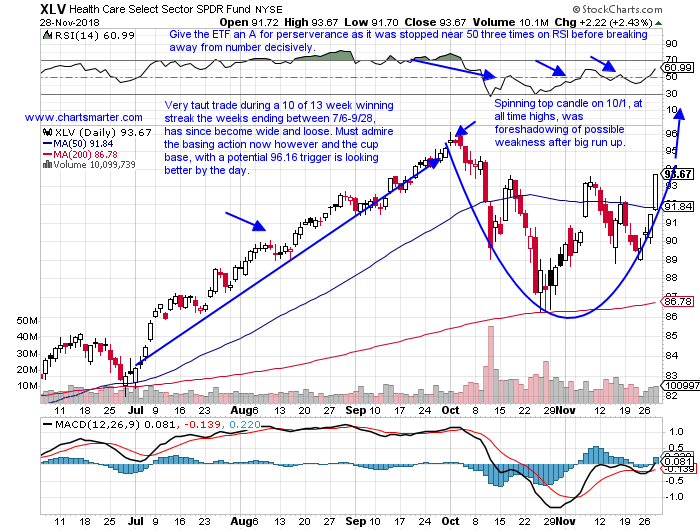
- The XLV has more than held its own during this recent downturn. On a one month period it is the best performing S&P sector higher by 7% (interesting enough is that its the financials that no one is talking about that are second best of the 11 major groups). On a 6 month look back it is also the best, this time edging out the stodgy staples, higher by nearly 14%, and it captures the top honors on a one year duration. To me the group has the best of both worlds, speaking on an overall basis, with the defensive, dividend paying pharma names, and the growth from some of the beta biotech plays. Wednesday on a very strong tape it held its own as well higher by more than 2% and the XLV chart is repairing technical damage very nicely. It has the look of a bullish inverse head and shoulders formation, but these work best in bottoming patterns, but it has reclaimed its 50 day SMA for the third time in the last 6 weeks. That type of gritty action has to be respected, as many others instruments would have rolled over.
Medical Devices Perking Up:
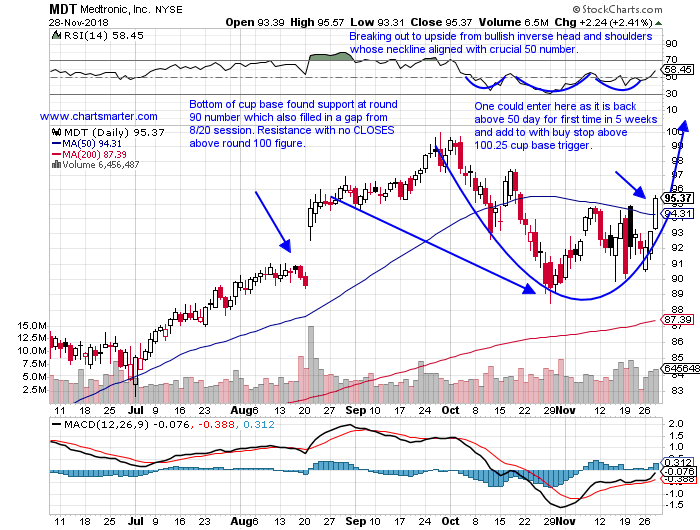
- The IHI is one of the only healthcare ETFs that is above both its 50 and 200 day SMAs. That is something the XLV can brag about, but not the PPH, IBB and XBI. The IHI advanced 3% Wednesday and in the process recouped its 50 day SMA. Like the XLV it did not undercut its October lows, and it did bounce each time it touched the very round 200 number. It is now on a 5 session winning streak and the last four CLOSED in the upper half of the daily range. Three of the five top holdings in the fund are 3% or less away from their most recent 52 week highs, and notice how MDT met resistance at the precise very round par figure on 9/26-27. It feels like there is a magnetic force pulling back to that level again and if touched should break through to the upside this time.
Examples:
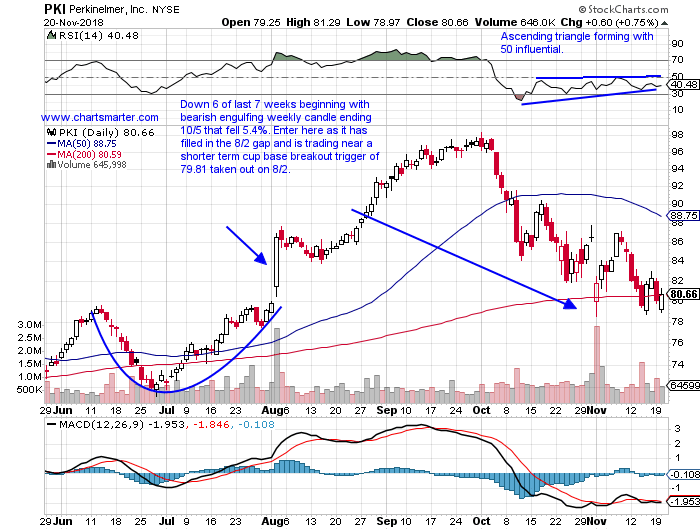
- Most breakouts that occur will often go back and retest the move, to test its validity. Not all will, and we know that the best breakouts tend to work out right away, but if a break is successfully held that could often be a good sign. Helping the trade even more could be the fact that it happens in conjunction with other factors. Below is a good example, with the chart of PKI and how it was presented in our Healthcare Report on 11/21. The round number theory, and its rising 200 day SMA aligned with a previous breakout from a 79.81 cup base trigger originally taken out on 8/2. There happened to be six sessions that traded below the 80 figure, with just one CLOSE beneath in November. It is now on a 6 day winning streak and higher 8 of the last 9 and still sits 13% off most recent all time highs, and a cup base is taking shape with a possible add on trigger above 98.43.
Special Situations:
Elevated hedge fund interest in this name. HZNP is a pharma play higher by 40% YTD and 51% over the last one year period. Earnings have been mostly higher with back to back double digit gains of 16 and 10.8% on 11/7 and 8/8, a loss of 5.6% on 5/9 and a gain of 2.7% on 2/28. The stock is down the last 2 weeks by 5.1%, but was immediately preceded by a 2 week combined gain of 25%. The chart was unable to break above a 21 bull flag trigger, but that morphed into a cup base trigger of 21.32 which was taken out on 11/7. It is now below that pivot, but did fill in a gap on 11/15 from the 11/6 session, finding support at a rising 50 day SMA. Enter HZNP here just above the very round 20 number.
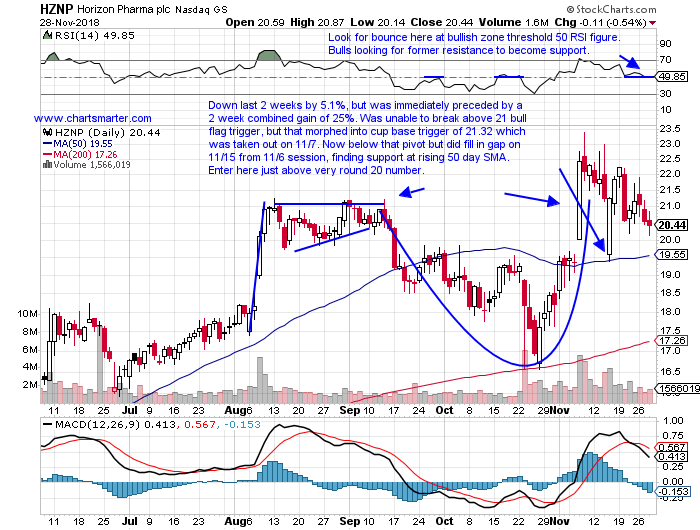
Trigger HZNP here. Stop 19.
Another name with heightened hedge fund interest, perhaps not the best sign, with more than 30%. NVTA is a biotech play higher by 54% YTD and 63% over the last one year period. Earnings have been mixed, but active, with rises of 17.4 and 11% on 8/8 and 5/10 and losses of 11.3 and 3.2% on 11/8 and 2/13. The stock is down 6 of the last 8 weeks and now lower by 24% off most recent 52 week highs. To be balanced it was preceded by a 7 of 8 week winning streak the weeks ending between 8/10-9/28 with 2 weeks that rose more than 20% and another higher by nearly 18%. Enter NVTA with a buy stop above its 50 day SMA at 14.10 and add to through a double bottom trigger of 16.17.
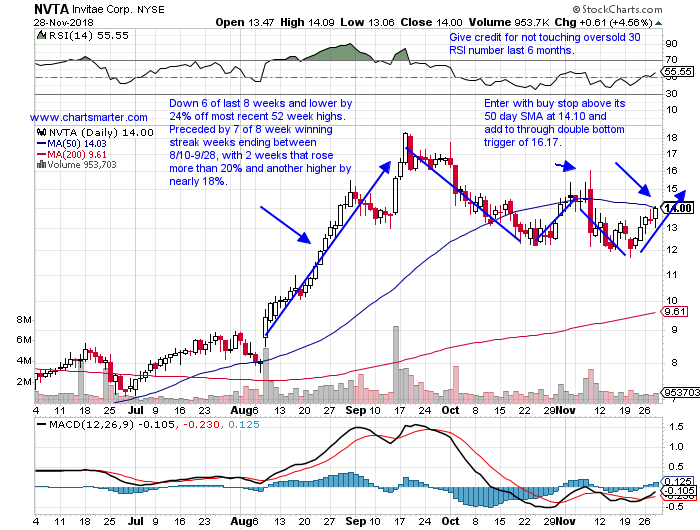
Trigger NVTA 14.10. Stop 13.
Peers HCA and UHS trading near 52 week highs. ENSG is a health care facility play higher by 106% YTD and 93% over the last one year period and sports a small dividend yield of .4%. Earnings have been mostly higher with nice moves of 12.4, 10.3 and 7.8% on 11/1, 5/3 and 2/9 and a loss of 5.3% on 8/3. The stock is lower the last 2 weeks by nearly 6%, but that is very acceptable given the prior two weeks before that rose by almost 28%, in the first and third strongest weekly volume in 2018 thus far. It has acted well POST breakout from a 40.19 cup base trigger taken out on 11/1, and now look to add to through a bull flag trigger of 46 which would carry a measured move to 57.
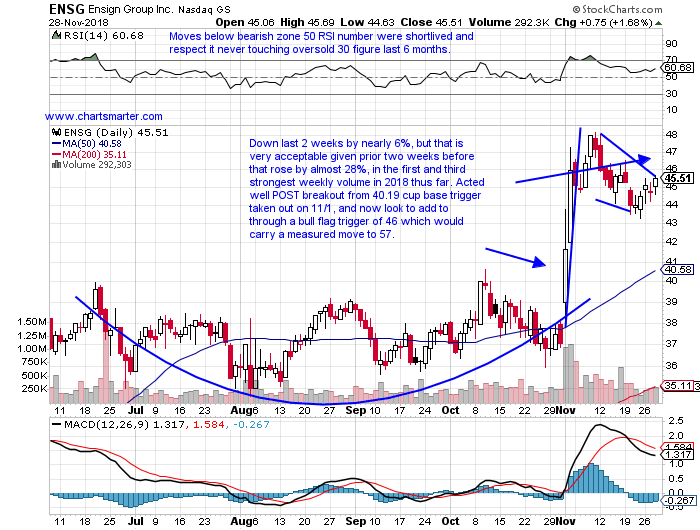
Trigger ENSG 46. Stop 44.
Healthcare name now off by 47% off most recent 52 week highs, much larger than most peers. AERI is a pharmaceutical laggard down 33% YTD and 34% over the last one year period. Earnings momentum is softening with three straight negative reactions falling 6.4, .6 and .4% on 11/7, 8/9 and 5/9 after a gain of 1.4% on 3/1. The stock is lower 13 of the last 18 weeks, three of which lost 10% or more, and this week heading into Thursday is down yet another 8.5%. Both its 50 and 200 day SMAs are sloping downward and short AERI on a retest of its bear flag breakdown at 41.25. The break carries a measured move to 29.
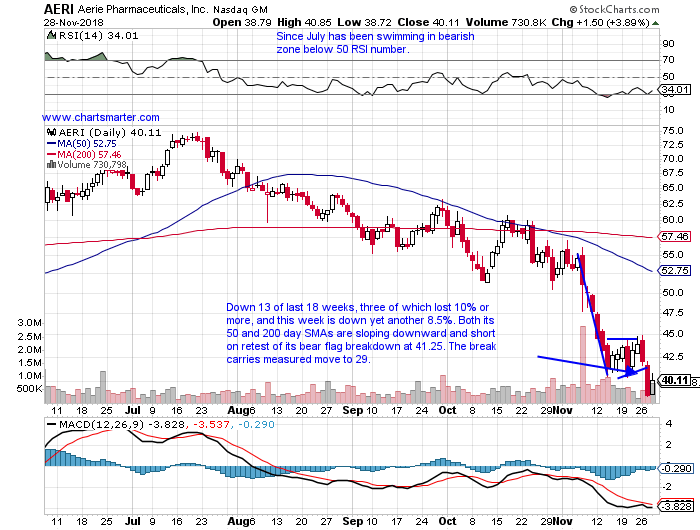
Trigger AERI 41.25. Buy stop 44.
Could be a tell that stock did not budge on a very robust tape Wednesday. MYGN is a biotech laggard down 8% YTD and 4% over the last one year period. Earnings have been mixed, yet energetic, with gains of 12.5 and 15.8% on 8/22 and 5/8 and losses of 10.5 and 5.5% on 11/7 and 2/7. The stock has declined 9 of the last 12 weeks, including a plunge of 32% the two weeks ending between 11/2-9, both of which were accompanied on the largest weekly volume of 2018 so far. It broke below a bearish head and shoulders trigger of 42, and now look to add to or initiate a short with a sell stop below a bear flag trigger of 30, which carries a measured move to 14.
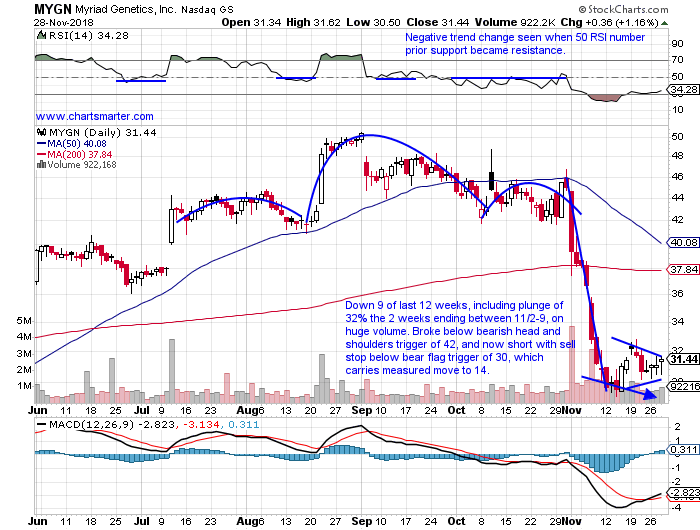
Trigger MYGN 30. Buy stop 32.25.
Good luck.
Trigger summaries:
Buy at very round 20 number HZNP here. Stop 19.
Buy stop above 50 day SMA NVTA 14.10. Stop 13.
Buy stop above bull flag trigger ENSG 46. Stop 44.
Short into bear flag breakdown AERI 41.25. Buy stop 44.
Sell stop to short below bear flag MYGN 30. Buy stop 32.25.
Group Overview:
- The XLV has more than held its own during this recent downturn. On a one month period it is the best performing S&P sector higher by 7% (interesting enough is that its the financials that no one is talking about that are second best of the 11 major groups). On a 6 month look back it is also the best, this time edging out the stodgy staples, higher by nearly 14%, and it captures the top honors on a one year duration. To me the group has the best of both worlds, speaking on an overall basis, with the defensive, dividend paying pharma names, and the growth from some of the beta biotech plays. Wednesday on a very strong tape it held its own as well higher by more than 2% and the XLV chart is repairing technical damage very nicely. It has the look of a bullish inverse head and shoulders formation, but these work best in bottoming patterns, but it has reclaimed its 50 day SMA for the third time in the last 6 weeks. That type of gritty action has to be respected, as many others instruments would have rolled over.
Medical Devices Perking Up:
- The IHI is one of the only healthcare ETFs that is above both its 50 and 200 day SMAs. That is something the XLV can brag about, but not the PPH, IBB and XBI. The IHI advanced 3% Wednesday and in the process recouped its 50 day SMA. Like the XLV it did not undercut its October lows, and it did bounce each time it touched the very round 200 number. It is now on a 5 session winning streak and the last four CLOSED in the upper half of the daily range. Three of the five top holdings in the fund are 3% or less away from their most recent 52 week highs, and notice how MDT met resistance at the precise very round par figure on 9/26-27. It feels like there is a magnetic force pulling back to that level again and if touched should break through to the upside this time.
Examples:
- Most breakouts that occur will often go back and retest the move, to test its validity. Not all will, and we know that the best breakouts tend to work out right away, but if a break is successfully held that could often be a good sign. Helping the trade even more could be the fact that it happens in conjunction with other factors. Below is a good example, with the chart of PKI and how it was presented in our Healthcare Report on 11/21. The round number theory, and its rising 200 day SMA aligned with a previous breakout from a 79.81 cup base trigger originally taken out on 8/2. There happened to be six sessions that traded below the 80 figure, with just one CLOSE beneath in November. It is now on a 6 day winning streak and higher 8 of the last 9 and still sits 13% off most recent all time highs, and a cup base is taking shape with a possible add on trigger above 98.43.
Special Situations:
Elevated hedge fund interest in this name. HZNP is a pharma play higher by 40% YTD and 51% over the last one year period. Earnings have been mostly higher with back to back double digit gains of 16 and 10.8% on 11/7 and 8/8, a loss of 5.6% on 5/9 and a gain of 2.7% on 2/28. The stock is down the last 2 weeks by 5.1%, but was immediately preceded by a 2 week combined gain of 25%. The chart was unable to break above a 21 bull flag trigger, but that morphed into a cup base trigger of 21.32 which was taken out on 11/7. It is now below that pivot, but did fill in a gap on 11/15 from the 11/6 session, finding support at a rising 50 day SMA. Enter HZNP here just above the very round 20 number.
Trigger HZNP here. Stop 19.
Another name with heightened hedge fund interest, perhaps not the best sign, with more than 30%. NVTA is a biotech play higher by 54% YTD and 63% over the last one year period. Earnings have been mixed, but active, with rises of 17.4 and 11% on 8/8 and 5/10 and losses of 11.3 and 3.2% on 11/8 and 2/13. The stock is down 6 of the last 8 weeks and now lower by 24% off most recent 52 week highs. To be balanced it was preceded by a 7 of 8 week winning streak the weeks ending between 8/10-9/28 with 2 weeks that rose more than 20% and another higher by nearly 18%. Enter NVTA with a buy stop above its 50 day SMA at 14.10 and add to through a double bottom trigger of 16.17.
Trigger NVTA 14.10. Stop 13.
Peers HCA and UHS trading near 52 week highs. ENSG is a health care facility play higher by 106% YTD and 93% over the last one year period and sports a small dividend yield of .4%. Earnings have been mostly higher with nice moves of 12.4, 10.3 and 7.8% on 11/1, 5/3 and 2/9 and a loss of 5.3% on 8/3. The stock is lower the last 2 weeks by nearly 6%, but that is very acceptable given the prior two weeks before that rose by almost 28%, in the first and third strongest weekly volume in 2018 thus far. It has acted well POST breakout from a 40.19 cup base trigger taken out on 11/1, and now look to add to through a bull flag trigger of 46 which would carry a measured move to 57.
Trigger ENSG 46. Stop 44.
Healthcare name now off by 47% off most recent 52 week highs, much larger than most peers. AERI is a pharmaceutical laggard down 33% YTD and 34% over the last one year period. Earnings momentum is softening with three straight negative reactions falling 6.4, .6 and .4% on 11/7, 8/9 and 5/9 after a gain of 1.4% on 3/1. The stock is lower 13 of the last 18 weeks, three of which lost 10% or more, and this week heading into Thursday is down yet another 8.5%. Both its 50 and 200 day SMAs are sloping downward and short AERI on a retest of its bear flag breakdown at 41.25. The break carries a measured move to 29.
Trigger AERI 41.25. Buy stop 44.
Could be a tell that stock did not budge on a very robust tape Wednesday. MYGN is a biotech laggard down 8% YTD and 4% over the last one year period. Earnings have been mixed, yet energetic, with gains of 12.5 and 15.8% on 8/22 and 5/8 and losses of 10.5 and 5.5% on 11/7 and 2/7. The stock has declined 9 of the last 12 weeks, including a plunge of 32% the two weeks ending between 11/2-9, both of which were accompanied on the largest weekly volume of 2018 so far. It broke below a bearish head and shoulders trigger of 42, and now look to add to or initiate a short with a sell stop below a bear flag trigger of 30, which carries a measured move to 14.
Trigger MYGN 30. Buy stop 32.25.
Good luck.
Trigger summaries:
Buy at very round 20 number HZNP here. Stop 19.
Buy stop above 50 day SMA NVTA 14.10. Stop 13.
Buy stop above bull flag trigger ENSG 46. Stop 44.
Short into bear flag breakdown AERI 41.25. Buy stop 44.
Sell stop to short below bear flag MYGN 30. Buy stop 32.25.