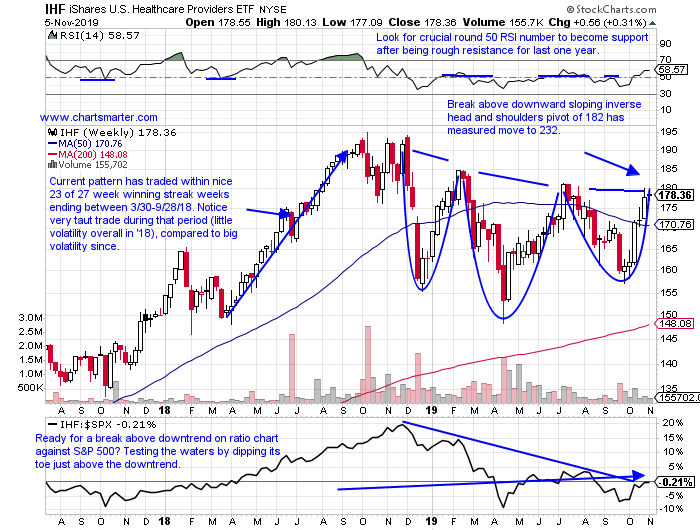
Providers Providing Relief:
- With an almost incessant banter revolving around the biotechs, some sub groups are flying under the radar. The healthcare providers have been showing some nice quiet strength up 8% YTD, and the ETF sports a nice dividend yield of 4%. The fund has traded between the very round 150-200 numbers for the last 13 months, and now shows a bullish inverse head and shoulders formation. The chart looks very similar to top component UNH, which makes sense as the name makes up 23% of the ETF. CVS, the number 2 holding reports earnings before the bell Wednesday, and recently broke above a bull flag pattern. ANTM has the look of a beachball being held underwater as trades narrows just below its 200 day SMA. CI is riding a 5 week winning streak, and looking to break a string of lower highs on its WEEKLY chart. Rounding out the top 5 components is CNC, which looks attractive as long as it does not trade too far below the very round 50 number, which would be a failed gap fill. The IHF has run as of late, but still trading 12% off its most recent yearly peak suggests the rally could have legs.
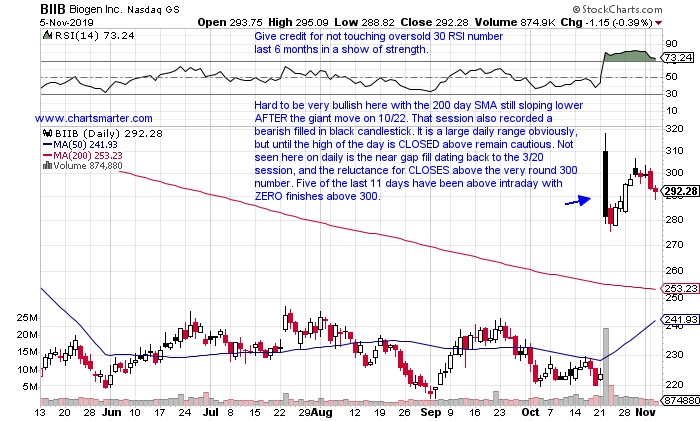
Sleepy Giant Roused?
- With most investors short term memory, it is often good to revisit a big market moving event once the noise calms down. Below is the chart of BIIB, and it is not hard to see something significant occurred on 10/22. The earnings reaction was obviously robust jumping 26.1%, but not much chatter has been delivered since. There is something for bulls and bears to take away from the set up, with the optimists stating that it is for the most part holding its gains after the big ramp up, and it still trades 14% from most recent 52 week highs. The pessimists will see stalling with some bearish candlesticks. Peer AMGN recorded a bearish engulfing candle Monday at the round 220 number, but overall that name is fine technically. BMY which is being acquiring CELG registered a bearish counterattack candle last Friday, and has as much distance between it and its 50 day SMA in quite some time. I would however be a buyer of that name on weakness, as it has advanced 12 of the last 15 weeks. GILD has been dead money for sometime. Let's dig in deeper to BIIB.
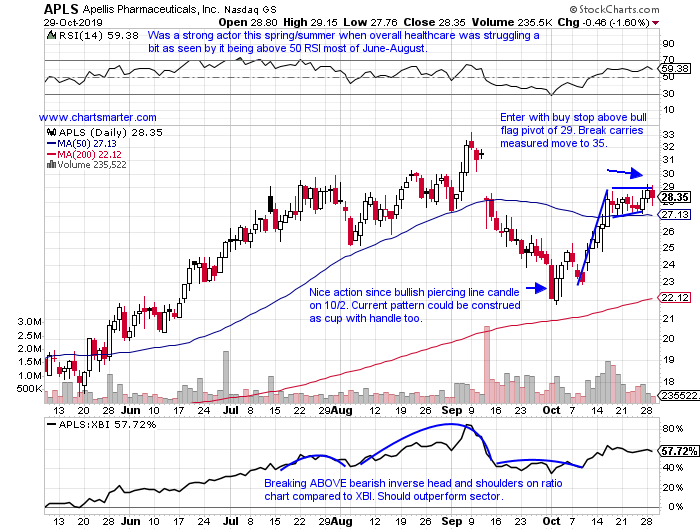
Recent Examples:
- In the recent uncertainty surrounding the new issue market, some names have remained resolute. The stock below is about to turn 2 years old this week, and has shown nice resilience. Below is the chart of APLS, and how it appeared in our 10/30 Healthcare Note. It broke above the bull flag, and is pausing not surprisingly near an upside gap fill from the 9/11 session. On its WEEKLY chart, if going into year end it can break above a double top in the 32-33 area from the weeks ending 4/20/18 and 9/13/19, the move can be significant. The stock is looking for a 6 week winning streak depending on Fridays CLOSE, and 2 of the 5 prior gainers rose at least 8%. All of the last 5 weeks CLOSED at or near the top of their weekly ranges, a very bullish trait.
Special Situations:
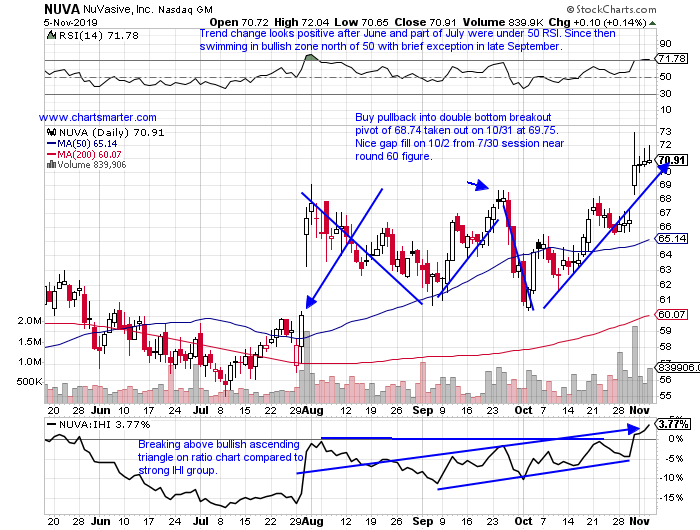
- Medical equipment play higher by 44% YTD and 28% over last one year period.
- Showing small follow through this week up .5%, after last week jumped 7.6% on 4th best weekly volume in '19 so far. On WEEKLY chart could move toward long cup base pivot of 81.78 in pattern that began in July '17.
- FOUR straight positive earnings reactions gaining 6.1, 11, 2.7 and 3.4% on 10/31, 7/31, 5/2 and 2/21.
- Enter on pullback into double bottom breakout on at 69.75.
- Entry NUVA 69.75. Stop 65.
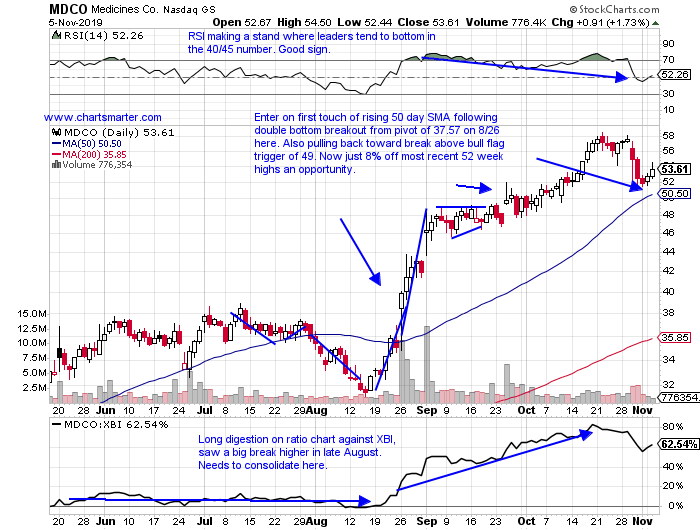
- Pharma play higher by 180% YTD and 110% over last one year period.
- Down last 2 weeks in a row (just 4th time that has happened all year so far to show how strong name has been). Was up 8 of 9 previous weeks, with four rising at least 7%.
- Recent earnings miss of 4.7% on 10/30, put an end to 3 straight small gains of .2, 1.1 and 2.7% on 7/24, 4/25 and 2/27.
- Enter on first touch or rising 50 day SMA after recent double bottom breakout.
- Entry MDCO here. Stop 48.
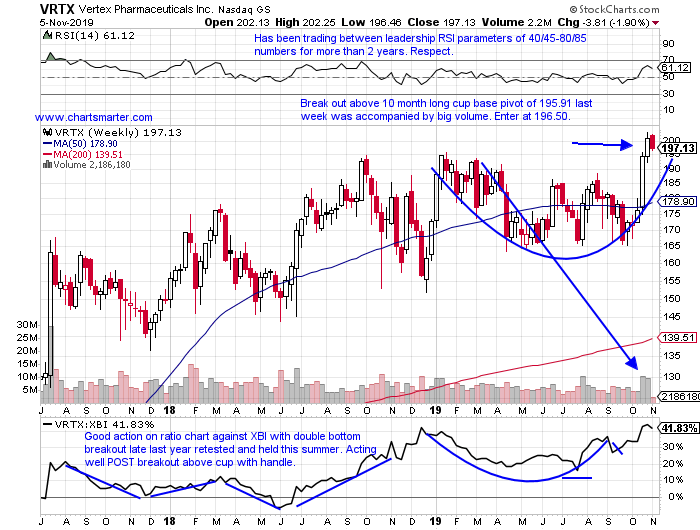
- Pharma leader higher by 19% YTD and 13% over last one year period.
- Solid follow through last week up 3.3%, AFTER prior week jumped 10.4% on best weekly volume in over one year to hit all time high.
- Stalling at very round 200 number with just one CLOSE above on 11/1.
- Enter on pullback into break above WEEKLY cup base pivot of 195.91 week ending 11/1.
- Entry VRTX 196.50. Stop 189.
Good luck.
Entry summaries:
Buy pullback into recent double bottom breakout NUVA 69.75. Stop 65.
Buy first touch of rising 50 day SMA after recent breakout MDCO here. Stop 48.
Buy pullback into recent WEEKLY cup base breakout VRTX 196.50. Stop 189.
This article requires a Chartsmarter membership. Please click here to join.
Providers Providing Relief:
- With an almost incessant banter revolving around the biotechs, some sub groups are flying under the radar. The healthcare providers have been showing some nice quiet strength up 8% YTD, and the ETF sports a nice dividend yield of 4%. The fund has traded between the very round 150-200 numbers for the last 13 months, and now shows a bullish inverse head and shoulders formation. The chart looks very similar to top component UNH, which makes sense as the name makes up 23% of the ETF. CVS, the number 2 holding reports earnings before the bell Wednesday, and recently broke above a bull flag pattern. ANTM has the look of a beachball being held underwater as trades narrows just below its 200 day SMA. CI is riding a 5 week winning streak, and looking to break a string of lower highs on its WEEKLY chart. Rounding out the top 5 components is CNC, which looks attractive as long as it does not trade too far below the very round 50 number, which would be a failed gap fill. The IHF has run as of late, but still trading 12% off its most recent yearly peak suggests the rally could have legs.
Sleepy Giant Roused?
- With most investors short term memory, it is often good to revisit a big market moving event once the noise calms down. Below is the chart of BIIB, and it is not hard to see something significant occurred on 10/22. The earnings reaction was obviously robust jumping 26.1%, but not much chatter has been delivered since. There is something for bulls and bears to take away from the set up, with the optimists stating that it is for the most part holding its gains after the big ramp up, and it still trades 14% from most recent 52 week highs. The pessimists will see stalling with some bearish candlesticks. Peer AMGN recorded a bearish engulfing candle Monday at the round 220 number, but overall that name is fine technically. BMY which is being acquiring CELG registered a bearish counterattack candle last Friday, and has as much distance between it and its 50 day SMA in quite some time. I would however be a buyer of that name on weakness, as it has advanced 12 of the last 15 weeks. GILD has been dead money for sometime. Let's dig in deeper to BIIB.
Recent Examples:
- In the recent uncertainty surrounding the new issue market, some names have remained resolute. The stock below is about to turn 2 years old this week, and has shown nice resilience. Below is the chart of APLS, and how it appeared in our 10/30 Healthcare Note. It broke above the bull flag, and is pausing not surprisingly near an upside gap fill from the 9/11 session. On its WEEKLY chart, if going into year end it can break above a double top in the 32-33 area from the weeks ending 4/20/18 and 9/13/19, the move can be significant. The stock is looking for a 6 week winning streak depending on Fridays CLOSE, and 2 of the 5 prior gainers rose at least 8%. All of the last 5 weeks CLOSED at or near the top of their weekly ranges, a very bullish trait.
Special Situations:
- Medical equipment play higher by 44% YTD and 28% over last one year period.
- Showing small follow through this week up .5%, after last week jumped 7.6% on 4th best weekly volume in '19 so far. On WEEKLY chart could move toward long cup base pivot of 81.78 in pattern that began in July '17.
- FOUR straight positive earnings reactions gaining 6.1, 11, 2.7 and 3.4% on 10/31, 7/31, 5/2 and 2/21.
- Enter on pullback into double bottom breakout on at 69.75.
- Entry NUVA 69.75. Stop 65.
- Pharma play higher by 180% YTD and 110% over last one year period.
- Down last 2 weeks in a row (just 4th time that has happened all year so far to show how strong name has been). Was up 8 of 9 previous weeks, with four rising at least 7%.
- Recent earnings miss of 4.7% on 10/30, put an end to 3 straight small gains of .2, 1.1 and 2.7% on 7/24, 4/25 and 2/27.
- Enter on first touch or rising 50 day SMA after recent double bottom breakout.
- Entry MDCO here. Stop 48.
- Pharma leader higher by 19% YTD and 13% over last one year period.
- Solid follow through last week up 3.3%, AFTER prior week jumped 10.4% on best weekly volume in over one year to hit all time high.
- Stalling at very round 200 number with just one CLOSE above on 11/1.
- Enter on pullback into break above WEEKLY cup base pivot of 195.91 week ending 11/1.
- Entry VRTX 196.50. Stop 189.
Good luck.
Entry summaries:
Buy pullback into recent double bottom breakout NUVA 69.75. Stop 65.
Buy first touch of rising 50 day SMA after recent breakout MDCO here. Stop 48.
Buy pullback into recent WEEKLY cup base breakout VRTX 196.50. Stop 189.