Red Dragon Awakening:
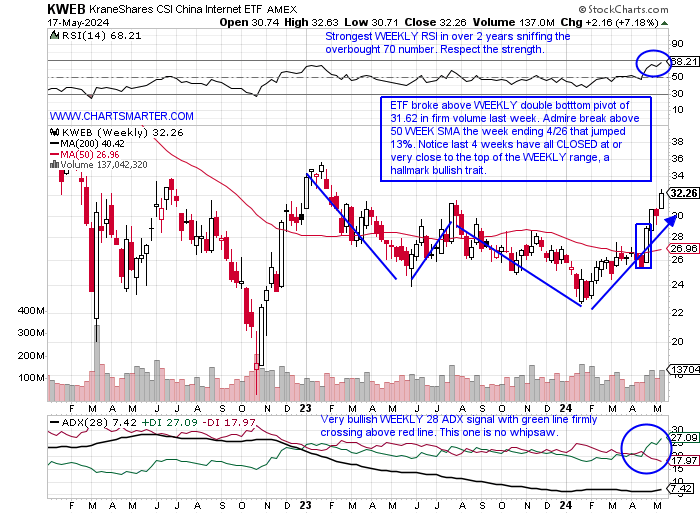
- It is not like the Chinese markets needed another jolt higher this week, which seemed to come after some 13F filings were released which displayed Tepper seems to be all in on the country (there was underlying strength here in previous weeks). Of course, the data is stale somewhat but his portfolio was made up of nearly one-fourth Chinese stocks. We had highlighted this fund recently in our China/Japan Note back in late April and it has been off to the races ever since. My feeling is that the ETF will feel a magnetic pull toward 35, best seen here on the MONTHLY chart, an area of former influence being both support and resistance dating back a decade. The current set up if it gets there would be an ascending triangle and a break above 35 would see a measured move to 53 (notice the top being put in with the gravestone doji candle in February 2021). KWEB is now up 15% this month so far and if that holds would be its first 4-month win streak since it did so starting in April 2020 which started a melt-up advancing 10 of the next 11 months. Another 4-month win streak in the last 10 years commenced in January 2017 and led to a 12 of 13-month win streak (one other was muted the first 4 months of 2019). Look for some big follow-through if this vibrant May gain so far holds up.
Earnings Lookers:
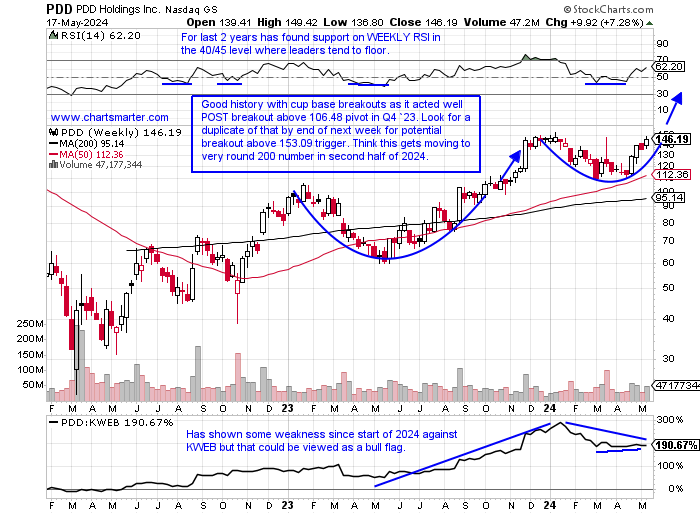
- Next week will bring some earnings reports from Chinese names that look very attractive on a technical basis. Remember it is a binary event so to go into the release "naked" makes no sense at all. My preference is to wait until after the reaction or one can hedge with options. Some examples include the WEEKLY chart below of PDD which REPORTS next Wednesday before the open. That same 153.09 trigger would be an entry point on the MONTHLY chart in a pattern that began at the start of 2021, and notice how the base commenced at the very round 200 number. Others to keep a close eye on include BZ which REPORTS next Tuesday before the open. It is going into next week on a 7-session-winning streak and has broken above a cup base trigger of 21.42 and notice how at the bottom of the cup it not only filled in the gap from the 3/11 session but successfully retested a double bottom breakout trigger of 16.83 taken out on 3/8. Finally, EH REPORTS Monday before the open and this one sports a WEEKLY double bottom with handle of 22.08, and notice how the base found comfort at the very round 10 number throughout February.
Recent Examples:
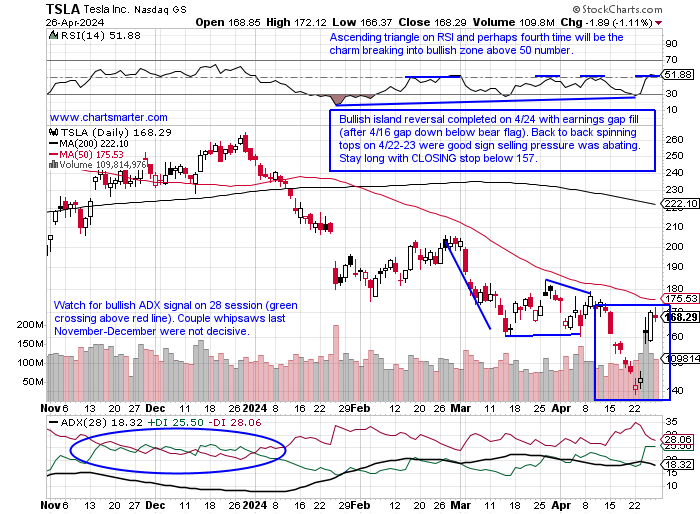
- The auto group has witnessed some big bifurcation in 2024. On the domestic front, GM has been acting better than F best seen on this ratio chart here. RACE found some comfort at the very round 400 number after an ill-received earnings reaction on 5/7 and this week recaptured its 50-day SMA and has set up a double-bottom buy pivot of 434.20 to go long. One of the more followed names in the space is the chart below of TSLA and how it appeared in our 4/29 International Auto Note. At the time we admired the bullish island reversal and the fact that it had climbed ABOVE a bear flag pivot and we know from FALSE moves come fast ones in the opposite direction. On 4/29 it surged more than 15% and was stopped less than 1% away from the very round 200 number. Looking at an updated chart it has since filled in that gap from the session 4/26 session and has carved out a bull flag now. A break above 180 would carry a measured move to 240.
Special Situations:
Tencent Holdings:
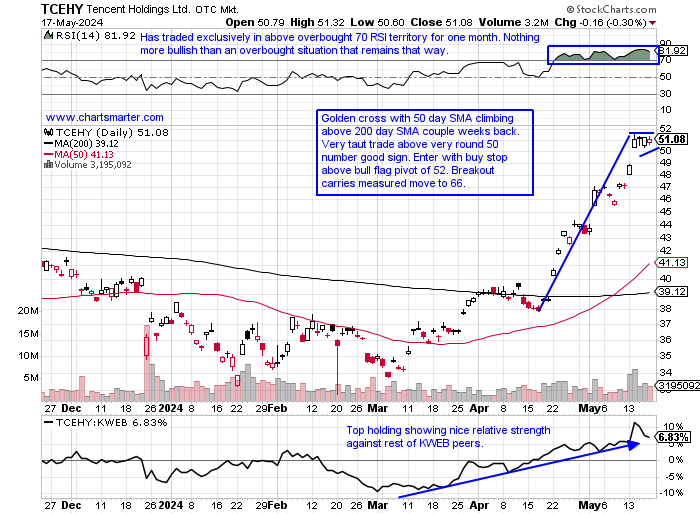
- Chinese internet play up 35% YTD and 17% over last one year period. Dividend yield of .6%.
- Name 1% off most recent 52-week highs and MONTHLY chart shows very possible 4-month win streak following doji candle in February (middle candle in bullish morning star). CLOSE above 50 MONTH SMA should see powerful move higher. If that line starts to slope higher look out above.
- Earnings reactions mostly higher up 1, 1.3, and 4.8% on 5/14, 3/20, and 11/15/23 after a drop of 1.2% on 8/16/23.
- Enter with buy stop above bull flag.
- Entry TCEHY 52. Stop 49.
Futu Holdings:
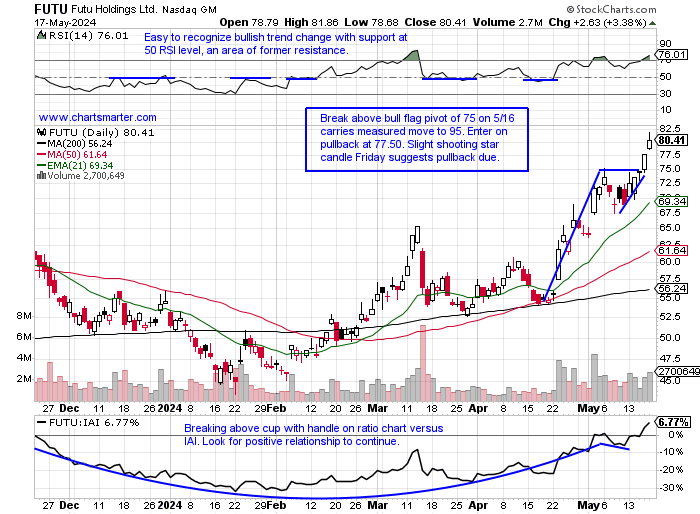
- Capital markets play up 47% YTD and 94% over last one year period.
- Name 2% off most recent 52-week highs and WEEKLY chart shows nice break above bullish ascending triangle pivot that aligned with round 70 number. Breakout carries measured move to 105.
- Earnings reactions mixed up 1.2 and 1.3% on 8/24/23 and 5/24/23 fell 13.8 and 3.4% on 3/14 and 11/27/23.
- Enter on pullback into bull flag breakout.
- Entry FUTU 77.50. Stop 73 (REPORTS May 28th before open).
Sony Group:
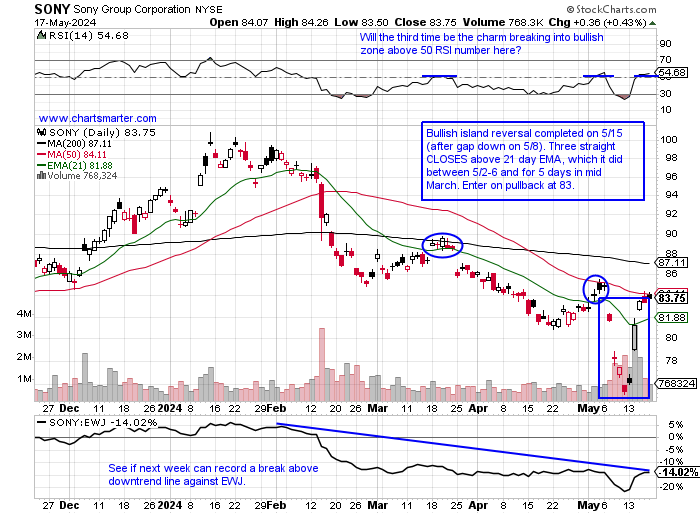
- Japanese electronics play down 11% YTD and 12% over last one year period. Dividend yield of .7%.
- Name 17% off most recent 52-week highs and WEEKLY chart shows vigorous comeback last week up 11% recouping almost all of the prior weeks ugly loss. I feel this one gravitates toward very round par number into year-end, a level touched three times before dating back to early 2023. Double bottom pattern setting up.
- Earnings reactions mostly lower off 4.3, 6.6, and 6.6% on 2/14, 11/9, and 8/9/23 after a gain of 6.7% on 5/14.
- Enter on pullback into bullish island reversal.
- Entry SONY 83. Stop 79.50.
Good luck.
Entry summaries:
Buy stop above bull flag TCEHY 52. Stop 49.
Buy pullback into bull flag breakout FUTU 77.50. Stop 73.
Buy pullback into bullish island reversal SONY 83. Stop 79.50.
This article requires a Chartsmarter membership. Please click here to join.
Red Dragon Awakening:
- It is not like the Chinese markets needed another jolt higher this week, which seemed to come after some 13F filings were released which displayed Tepper seems to be all in on the country (there was underlying strength here in previous weeks). Of course, the data is stale somewhat but his portfolio was made up of nearly one-fourth Chinese stocks. We had highlighted this fund recently in our China/Japan Note back in late April and it has been off to the races ever since. My feeling is that the ETF will feel a magnetic pull toward 35, best seen here on the MONTHLY chart, an area of former influence being both support and resistance dating back a decade. The current set up if it gets there would be an ascending triangle and a break above 35 would see a measured move to 53 (notice the top being put in with the gravestone doji candle in February 2021). KWEB is now up 15% this month so far and if that holds would be its first 4-month win streak since it did so starting in April 2020 which started a melt-up advancing 10 of the next 11 months. Another 4-month win streak in the last 10 years commenced in January 2017 and led to a 12 of 13-month win streak (one other was muted the first 4 months of 2019). Look for some big follow-through if this vibrant May gain so far holds up.
Earnings Lookers:
- Next week will bring some earnings reports from Chinese names that look very attractive on a technical basis. Remember it is a binary event so to go into the release "naked" makes no sense at all. My preference is to wait until after the reaction or one can hedge with options. Some examples include the WEEKLY chart below of PDD which REPORTS next Wednesday before the open. That same 153.09 trigger would be an entry point on the MONTHLY chart in a pattern that began at the start of 2021, and notice how the base commenced at the very round 200 number. Others to keep a close eye on include BZ which REPORTS next Tuesday before the open. It is going into next week on a 7-session-winning streak and has broken above a cup base trigger of 21.42 and notice how at the bottom of the cup it not only filled in the gap from the 3/11 session but successfully retested a double bottom breakout trigger of 16.83 taken out on 3/8. Finally, EH REPORTS Monday before the open and this one sports a WEEKLY double bottom with handle of 22.08, and notice how the base found comfort at the very round 10 number throughout February.
Recent Examples:
- The auto group has witnessed some big bifurcation in 2024. On the domestic front, GM has been acting better than F best seen on this ratio chart here. RACE found some comfort at the very round 400 number after an ill-received earnings reaction on 5/7 and this week recaptured its 50-day SMA and has set up a double-bottom buy pivot of 434.20 to go long. One of the more followed names in the space is the chart below of TSLA and how it appeared in our 4/29 International Auto Note. At the time we admired the bullish island reversal and the fact that it had climbed ABOVE a bear flag pivot and we know from FALSE moves come fast ones in the opposite direction. On 4/29 it surged more than 15% and was stopped less than 1% away from the very round 200 number. Looking at an updated chart it has since filled in that gap from the session 4/26 session and has carved out a bull flag now. A break above 180 would carry a measured move to 240.
Special Situations:
Tencent Holdings:
- Chinese internet play up 35% YTD and 17% over last one year period. Dividend yield of .6%.
- Name 1% off most recent 52-week highs and MONTHLY chart shows very possible 4-month win streak following doji candle in February (middle candle in bullish morning star). CLOSE above 50 MONTH SMA should see powerful move higher. If that line starts to slope higher look out above.
- Earnings reactions mostly higher up 1, 1.3, and 4.8% on 5/14, 3/20, and 11/15/23 after a drop of 1.2% on 8/16/23.
- Enter with buy stop above bull flag.
- Entry TCEHY 52. Stop 49.
Futu Holdings:
- Capital markets play up 47% YTD and 94% over last one year period.
- Name 2% off most recent 52-week highs and WEEKLY chart shows nice break above bullish ascending triangle pivot that aligned with round 70 number. Breakout carries measured move to 105.
- Earnings reactions mixed up 1.2 and 1.3% on 8/24/23 and 5/24/23 fell 13.8 and 3.4% on 3/14 and 11/27/23.
- Enter on pullback into bull flag breakout.
- Entry FUTU 77.50. Stop 73 (REPORTS May 28th before open).
Sony Group:
- Japanese electronics play down 11% YTD and 12% over last one year period. Dividend yield of .7%.
- Name 17% off most recent 52-week highs and WEEKLY chart shows vigorous comeback last week up 11% recouping almost all of the prior weeks ugly loss. I feel this one gravitates toward very round par number into year-end, a level touched three times before dating back to early 2023. Double bottom pattern setting up.
- Earnings reactions mostly lower off 4.3, 6.6, and 6.6% on 2/14, 11/9, and 8/9/23 after a gain of 6.7% on 5/14.
- Enter on pullback into bullish island reversal.
- Entry SONY 83. Stop 79.50.
Good luck.
Entry summaries:
Buy stop above bull flag TCEHY 52. Stop 49.
Buy pullback into bull flag breakout FUTU 77.50. Stop 73.
Buy pullback into bullish island reversal SONY 83. Stop 79.50.