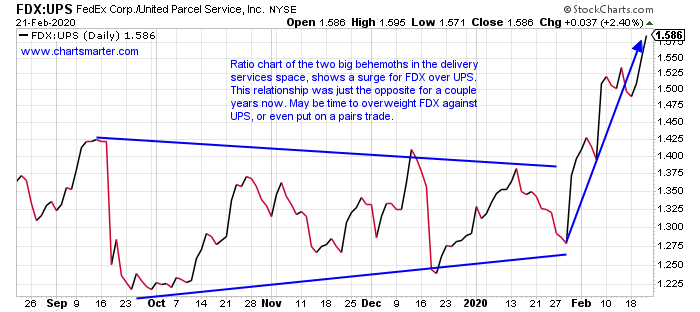
The delivery services space is a small tight knit group. There are just two major players in the group Federal Express and United Parcel Services. FDX which has been in a downtrend since the beginning of 2018 is now nearly half the market cap of UPS, because of that weakness. UPS which for the most part roughly traded sideways during that same time period, and was a leader against its largest rival, now looks vulnerable. There was some glaring relative strength for FDX last week, which was telling as FDX ROSE 2.9%, while UPS fell 2.8%. The ratio chart below is telling the story.
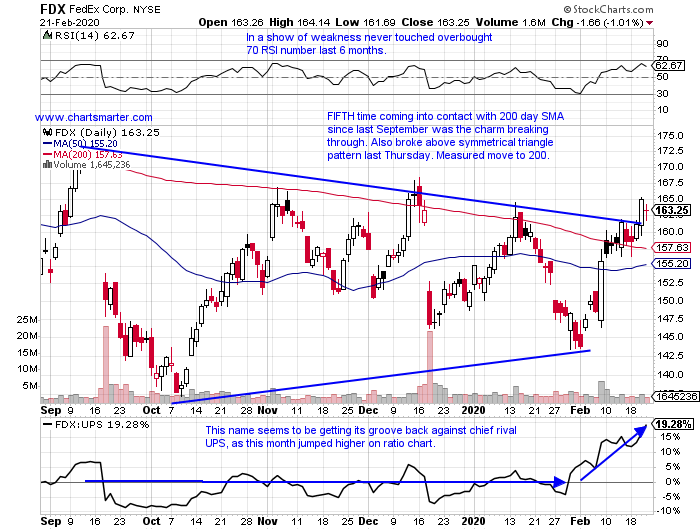
Let us now take a look at the PRICE charts of both names discussed. The more time a line is touched the weaker than line of support gets in my opinion, contrary to popular belief. Friday was its SIXTH consecutive CLOSE above its 200 day SMA, the first time it has been decisively above since fall of 2018. Although both UPS and FDX are both 18% off most recent 52 week highs, their charts are moving in different directions. FDX certainly still has work to do, but its nascent move above its 200 day SMA is a good first step, and that line should now be support going forward, and a stop if one goes long on a CLOSING basis.
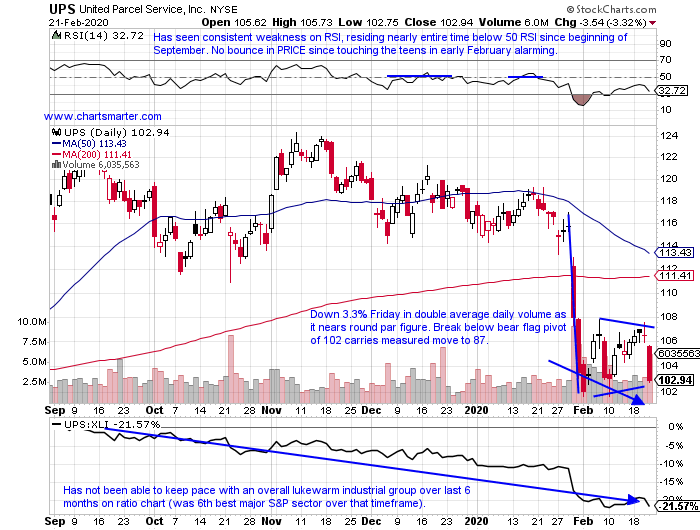
On a YTD basis it has been no contest as UPS is lower by 12%, as FDX is higher by 8%. UPS has lost ground 4 of the last 5 weeks, with all four decliners CLOSING at lows for the weekly range. During that time period, what stuck out most was the week ending 2/7, which fell fractionally by .4%, but its inability to recapture any of the prior weeks slump of 11.3% in very active trade is concerning to say the least. It is trading underneath both its 50 and 200 day SMAs, the inverse of FDX, and keep the saying that "nothing good happens under the 200 day" in mind.
If you liked what you read why not visit www.chartsmarter.com.
The delivery services space is a small tight knit group. There are just two major players in the group Federal Express and United Parcel Services. FDX which has been in a downtrend since the beginning of 2018 is now nearly half the market cap of UPS, because of that weakness. UPS which for the most part roughly traded sideways during that same time period, and was a leader against its largest rival, now looks vulnerable. There was some glaring relative strength for FDX last week, which was telling as FDX ROSE 2.9%, while UPS fell 2.8%. The ratio chart below is telling the story.
Let us now take a look at the PRICE charts of both names discussed. The more time a line is touched the weaker than line of support gets in my opinion, contrary to popular belief. Friday was its SIXTH consecutive CLOSE above its 200 day SMA, the first time it has been decisively above since fall of 2018. Although both UPS and FDX are both 18% off most recent 52 week highs, their charts are moving in different directions. FDX certainly still has work to do, but its nascent move above its 200 day SMA is a good first step, and that line should now be support going forward, and a stop if one goes long on a CLOSING basis.
On a YTD basis it has been no contest as UPS is lower by 12%, as FDX is higher by 8%. UPS has lost ground 4 of the last 5 weeks, with all four decliners CLOSING at lows for the weekly range. During that time period, what stuck out most was the week ending 2/7, which fell fractionally by .4%, but its inability to recapture any of the prior weeks slump of 11.3% in very active trade is concerning to say the least. It is trading underneath both its 50 and 200 day SMAs, the inverse of FDX, and keep the saying that "nothing good happens under the 200 day" in mind.
If you liked what you read why not visit www.chartsmarter.com.