- The bull flag formation is a continuation pattern, that forms during an uptrend. Keep in mind leading stocks, will offer investors a chance to add to them on the way UP. The pattern forms after a sustained move higher, and then the stock digests the strong advance, with very taut sideways action. Generally one does not want to see the flag last more than 3 weeks. It is considered very bullish as the stock is stubborn to not give anything back following a powerful rise. The breakout occurs when the stock breaks above the top of the flag, preferably in firm volume. The measured move would be the length of the flag "pole", added to the breakout PRICE. What better way is there to learn than to look at a few recent examples.
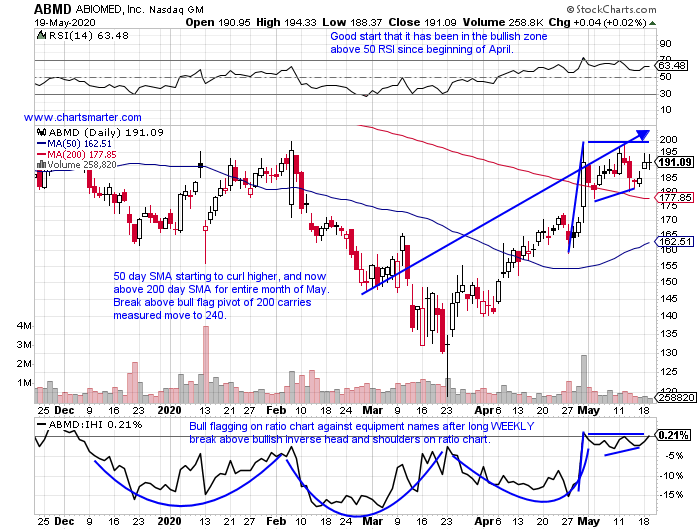
In our 5/21 Healthcare Note we took a look at ABMD.
- Below is the chart of a former best of breed name, in the medical equipment group, which is attempting to recapture that former status. The turnaround from an earnings standpoint is moving in the right direction with THREE consecutive positive earnings reactions gaining 13, 2.8 and 14.2% on 4/30, 2/6 and 8/1/19. That is a good start, but we always want to see that translate into bullish PRICE action. We are beginning to see that with multiple CLOSES above its 200 day SMA, a line it has been below for well more than one year. And it has formed a bull flag in conjunction with the very round 200 number. It has not traded above that figure since last November, and on its WEEKLY chart a break above 200 would also negate a long series of lower highs and lower lows dating back to October 2018. Patience is required as the 200 figure still resides 9 handles away. Fast forward to today and it is now 19 handles above the very round 200 number.
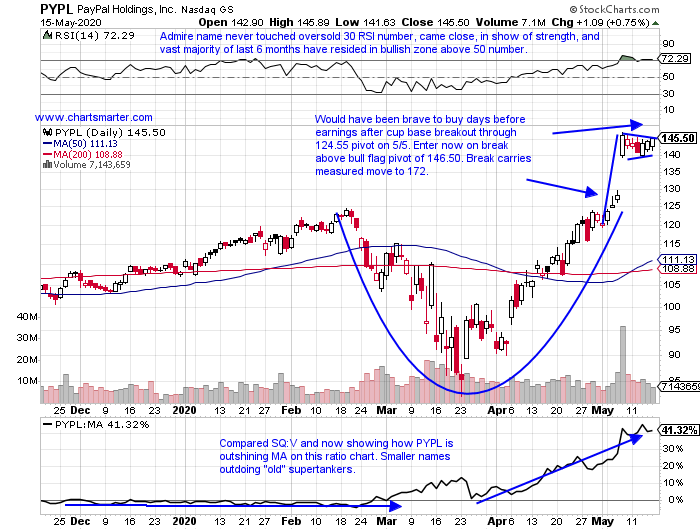
In our Tuesday 5/19 Technology Note we looked at PYPL.
- Payment play higher by 38% YTD and 33% over last one year period.
- Stock not budging after huge weekly gain of 20.2% ending 5/8, a very good sign. Now on 7 week winning streak, and this week lower by 1% threatening that streak (6 of 7 CLOSED near top of WEEKLY range).
- Three straight positive earnings reactions up 14, .4 and 8.6% on 5/7, 1/30 and 10/24/19.
- Enter with buy stop above bull flag formation.
- Entry PYPL 146.50. Stop 139. Stock now trading near 148.
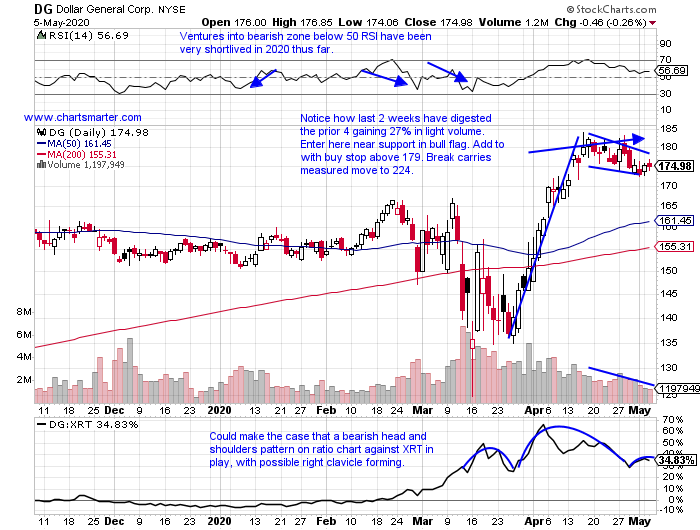
In our 5/6 Conumser Note we took a look at DG.
- Discount retail play higher by 18% YTD and 53% over last one year period. Dividend yield of .8%.
- Higher 6 of last 9 weeks, and digesting prior 4 week winning streak weeks ending between 3/27-4/17 rose more than 27%. Just 3% off most recent 52 week highs, while peers ROST is 21% off its yearly peak. DLTR big move this week.
- Last earnings reaction lost 9.9% on 3/12, ending three consecutive gains of 1, 10.7 and 7.2% on 12/5, 8/29 and 5/30/19.
- Enter near support in bull flag formation.
- Entry DG here. Stop 171. Stock trading near 184 today.
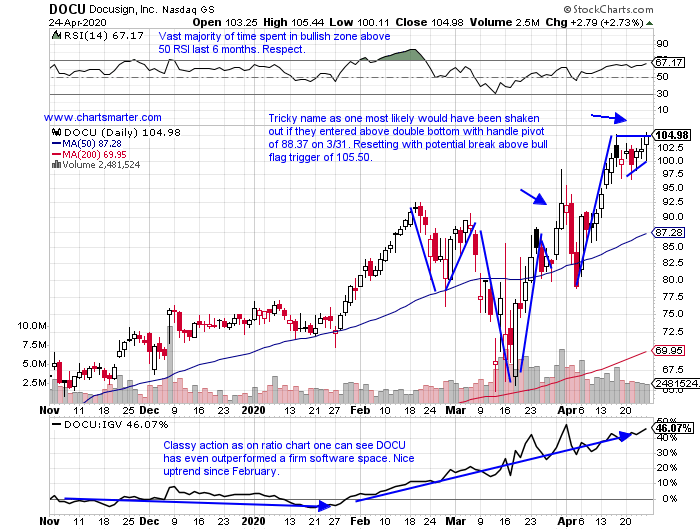
In our 5/1 Technology Note we took a look at DOCU.
- Much is being said about the small number of leading stocks, that hail from a select group of sectors. Software, semis and retail plays. Now this may be true, and it could be hazardous to your portfolio as they are becoming "crowded trades". And that is correct, but these names may continue to lead for many more months or years, or of course less. But the technicals will give you signals when it is time to depart, but until then maintain long positions in the chosen leaders. Below is a good example with the chart of DOCU. The stock will celebrate its second birthday next week, and it sits just off all time highs. The round number theory comes into play here too as it forms a bull flag formation. Seven of the last eight sessions have all CLOSED above the very round par number. Fast forward to today at DOCU trades near 130.
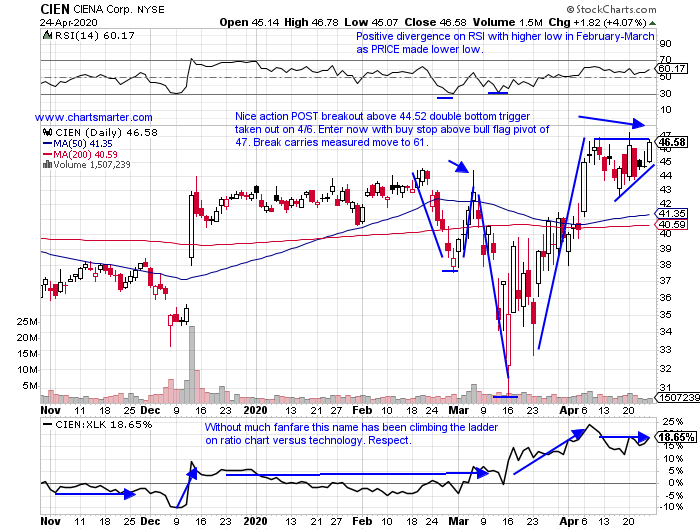
In our 5/1 Technology Note we looked at CIEN.
- Telecommunications leader higher by 28% YTD and 56% over last one year period.
- Name just 3% off most recent multi year highs. Good relative strength up nearly 4% this week, looking for fourth consecutive WEEKLY advance.
- Earnings mostly higher with gains 3 of last 4, up 3, 20.4 and 26.8% on 3/5, 9/5 and 6/6/19 (fell 3.8% on 9/5/19).
- Enter with buy stop above bull flag pivot.
- Entry CIEN 47. Stop 43.50. Stock now trading near 55.
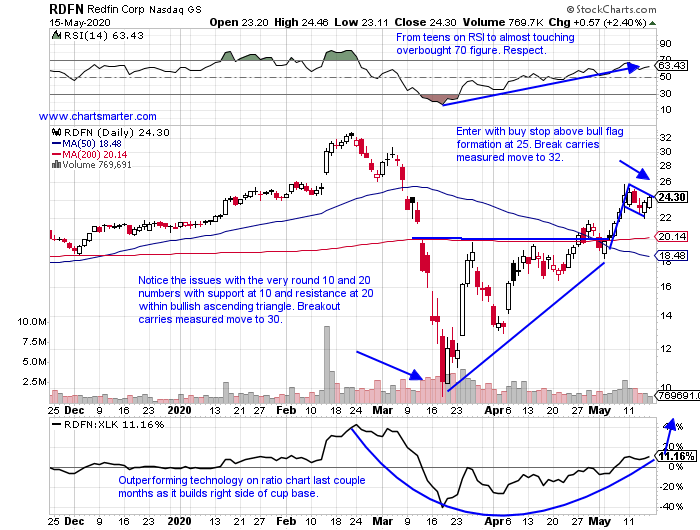
In our 5/19 Technology Note we looked at RDFN.
- Internet play on real estate higher by 39% YTD and 68% over last one year period.
- Just 10% off most recent 52 week highs, but very impressive action this week nearly UNCH, after prior week jumped by almost 22%. Since March lows TWO other weeks that screamed higher by 38%.
- Three of last four earnings reactions very well received up 8.2, 18.1 and 10.9% on 5/8, 2/13 and 8/2/19.
- Enter with buy stop above bull flag formation.
- Entry RDFN 25. Stop 23. Stock now dealing with the round 30 number.
This article requires a Chartsmarter membership. Please click here to join.
- The bull flag formation is a continuation pattern, that forms during an uptrend. Keep in mind leading stocks, will offer investors a chance to add to them on the way UP. The pattern forms after a sustained move higher, and then the stock digests the strong advance, with very taut sideways action. Generally one does not want to see the flag last more than 3 weeks. It is considered very bullish as the stock is stubborn to not give anything back following a powerful rise. The breakout occurs when the stock breaks above the top of the flag, preferably in firm volume. The measured move would be the length of the flag "pole", added to the breakout PRICE. What better way is there to learn than to look at a few recent examples.
In our 5/21 Healthcare Note we took a look at ABMD.
- Below is the chart of a former best of breed name, in the medical equipment group, which is attempting to recapture that former status. The turnaround from an earnings standpoint is moving in the right direction with THREE consecutive positive earnings reactions gaining 13, 2.8 and 14.2% on 4/30, 2/6 and 8/1/19. That is a good start, but we always want to see that translate into bullish PRICE action. We are beginning to see that with multiple CLOSES above its 200 day SMA, a line it has been below for well more than one year. And it has formed a bull flag in conjunction with the very round 200 number. It has not traded above that figure since last November, and on its WEEKLY chart a break above 200 would also negate a long series of lower highs and lower lows dating back to October 2018. Patience is required as the 200 figure still resides 9 handles away. Fast forward to today and it is now 19 handles above the very round 200 number.
In our Tuesday 5/19 Technology Note we looked at PYPL.
- Payment play higher by 38% YTD and 33% over last one year period.
- Stock not budging after huge weekly gain of 20.2% ending 5/8, a very good sign. Now on 7 week winning streak, and this week lower by 1% threatening that streak (6 of 7 CLOSED near top of WEEKLY range).
- Three straight positive earnings reactions up 14, .4 and 8.6% on 5/7, 1/30 and 10/24/19.
- Enter with buy stop above bull flag formation.
- Entry PYPL 146.50. Stop 139. Stock now trading near 148.
In our 5/6 Conumser Note we took a look at DG.
- Discount retail play higher by 18% YTD and 53% over last one year period. Dividend yield of .8%.
- Higher 6 of last 9 weeks, and digesting prior 4 week winning streak weeks ending between 3/27-4/17 rose more than 27%. Just 3% off most recent 52 week highs, while peers ROST is 21% off its yearly peak. DLTR big move this week.
- Last earnings reaction lost 9.9% on 3/12, ending three consecutive gains of 1, 10.7 and 7.2% on 12/5, 8/29 and 5/30/19.
- Enter near support in bull flag formation.
- Entry DG here. Stop 171. Stock trading near 184 today.
In our 5/1 Technology Note we took a look at DOCU.
- Much is being said about the small number of leading stocks, that hail from a select group of sectors. Software, semis and retail plays. Now this may be true, and it could be hazardous to your portfolio as they are becoming "crowded trades". And that is correct, but these names may continue to lead for many more months or years, or of course less. But the technicals will give you signals when it is time to depart, but until then maintain long positions in the chosen leaders. Below is a good example with the chart of DOCU. The stock will celebrate its second birthday next week, and it sits just off all time highs. The round number theory comes into play here too as it forms a bull flag formation. Seven of the last eight sessions have all CLOSED above the very round par number. Fast forward to today at DOCU trades near 130.
In our 5/1 Technology Note we looked at CIEN.
- Telecommunications leader higher by 28% YTD and 56% over last one year period.
- Name just 3% off most recent multi year highs. Good relative strength up nearly 4% this week, looking for fourth consecutive WEEKLY advance.
- Earnings mostly higher with gains 3 of last 4, up 3, 20.4 and 26.8% on 3/5, 9/5 and 6/6/19 (fell 3.8% on 9/5/19).
- Enter with buy stop above bull flag pivot.
- Entry CIEN 47. Stop 43.50. Stock now trading near 55.
In our 5/19 Technology Note we looked at RDFN.
- Internet play on real estate higher by 39% YTD and 68% over last one year period.
- Just 10% off most recent 52 week highs, but very impressive action this week nearly UNCH, after prior week jumped by almost 22%. Since March lows TWO other weeks that screamed higher by 38%.
- Three of last four earnings reactions very well received up 8.2, 18.1 and 10.9% on 5/8, 2/13 and 8/2/19.
- Enter with buy stop above bull flag formation.
- Entry RDFN 25. Stop 23. Stock now dealing with the round 30 number.