David Versus Goliath:
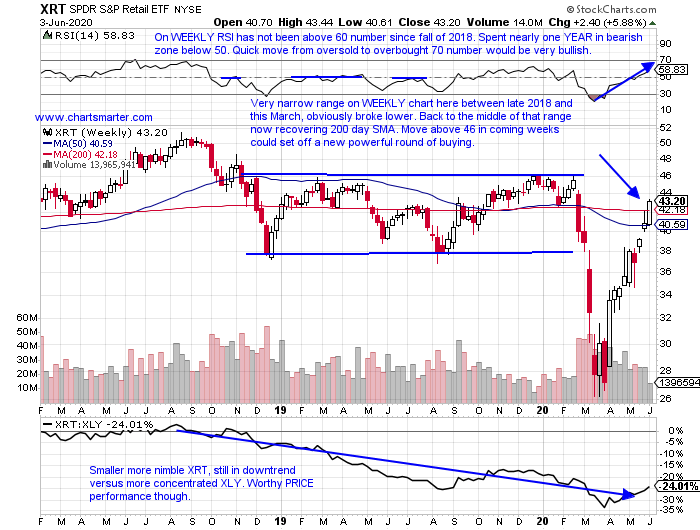
- We have spoke in the past about the more concentrated XLY compared to that of the much more diverse XRT. Being in the right names can really give an investors a strong return if concentrated. The phrase comes to mind, "concentration builds wealth, while diversification preserves it". Half of the XLY is represented by just its FOUR top components in AMZN, HD, MCD and NKE. In the XRT AMZN is the fifth largest holding at just more than 2%, while in the XLY it is one quarter of the fund. The XRT is home to some of the smaller cap names too, and perhaps it could benefit from the recent robust move in the Russell 2000. Below is the WEEKLY chart of the XRT, and it is back into a long tight range it traded prior to March. From long consolidations often come sharp moves and this one was certainly to the downside. I wonder how the XRT chart would look if its top 3 holdings, say STMP CHWY and ETSY (all 3 are in top 5 holdings at about 2.5%) had the same weighting as the XLY.
Lyft Chart "Lifting":
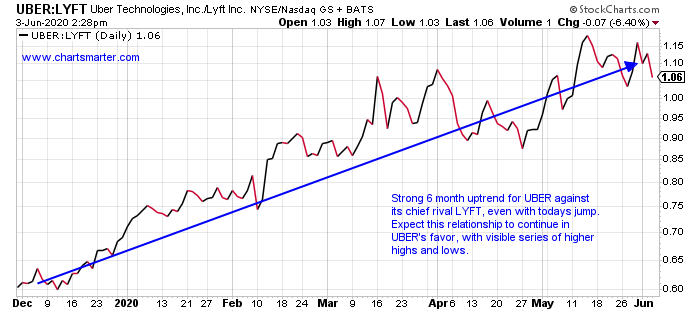
- Ratio charts are always a good way to compare two instruments to each other to see where capital should be allocated. One can do it by contrasting individual stocks, or stocks to a specific sector ETF. Below we look at the ratio chart of UBER against its peer LYFT. Notice the strong, obvious outperformance for UBER, as the company name has become a verb, much like ZM. Uber now trades 22% off most recent 52 week highs, while LYFT is 49% off its most recent yearly peak. Looking at other returns UBER is higher by 21% YTD, while LYFT is LOWER by 19%. Keep in mind ratio charts show strength against one another, on a relative basis, and is does not mean that both can not be well on an absolute basis. LYFT did break out today above a bullish ascending triangle pivot of 34, but it still trades well below its 200 day SMA, and you know the old saying "nothing good happens below the 200 day". UBER in my opinion still deserves your capital, and on a WEEKLY chart is inching toward to 41.96 double bottom pivot.
Recent Examples:
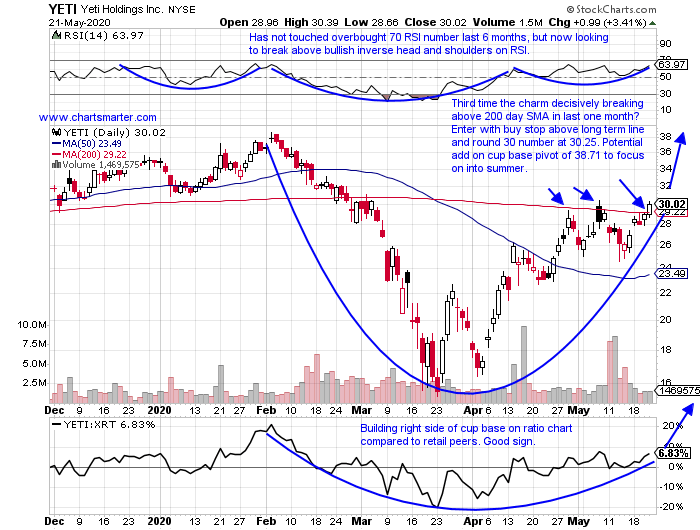
- Consumers are yearning to get outdoors and enjoy the fresh air. We could witness that with the action in stocks like WGO CWH and PII to name a few. All three of those name well more than doubled from their March lows. Another name that is catching some love is the chart of YETI below, and how it appeared in our 5/22 Consumer Note. It is higher 8 of the last 9 weeks, and moving north once again this week to the tune of 6% so far (the one declining week ending 5/15 fell 7.4% on the strongest ever WEEKLY volume, but did manage to CLOSE in the upper half of the WEEKLY range). On its WEEKLY chart one would see it is approaching an area in the upper 30s which gave the name a bit of a pushback twice in 2019 and again in the beginning of 2020. It is now flirting with a cup with handle pivot of 34.11. This name looks like its on firm ground.
Special Situations:
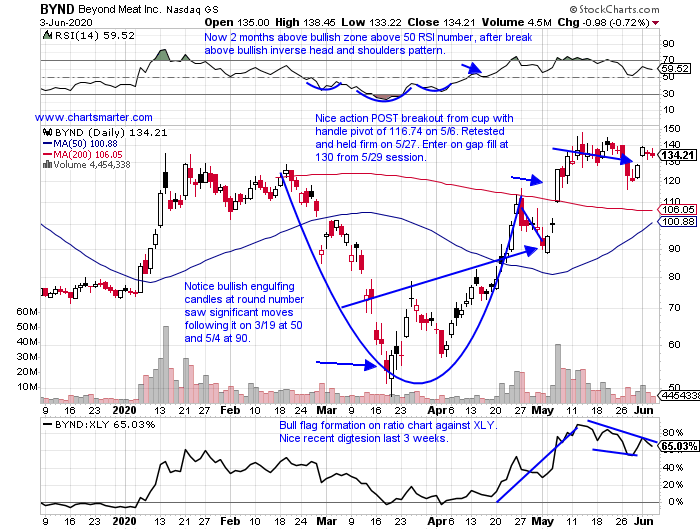
- Food products play higher by 78% YTD and 40% over last one year period.
- Higher 6 of the last 8 weeks, with 2 of the WEEKLY advances rising more than 40%. Nice double bottom in mid 40s weeks ending 5/3/19 and 3/20. Still 44% off most recent 52 week highs.
- Last earnings reaction higher by 26%, after three straight losses of 15.5, 22.2 and 12.3% on 2/28, 10/29 and 7/30/19.
- Enter on pullback into potential gap fill.
- Entry BYND 130. Stop 118.
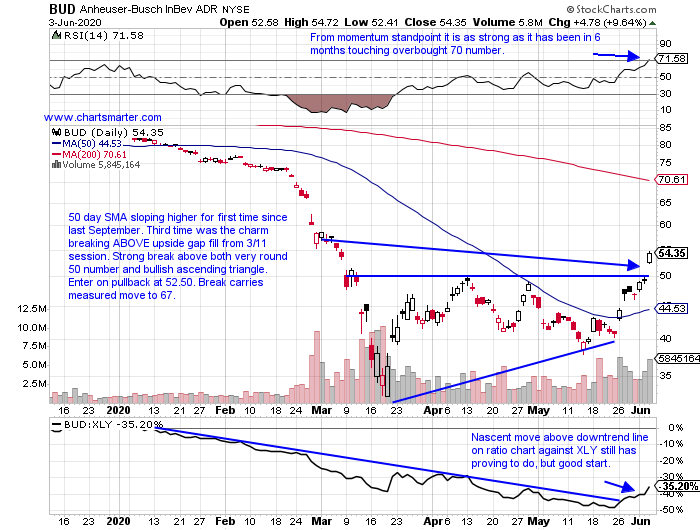
- Belgian brewing laggard lower by 34% YTD and over last one year period. Dividend yield of 2.6%.
- Massive move lower after rejection at very round par number last summer, falling 26 of 34 weeks ending between 8/2/19-3/20. This week following through powerfully up 16%, after prior week jumped 14.6%.
- Three consecutive negative earnings reactions down .5, 9.2 and 10.7% on 5/7, 2/27 and 10/25/19 (rose 4.1% on 7/25/19).
- Buy pullback into break above bullish ascending triangle/round 50 number.
- Entry BUD 52.50. Stop 48.
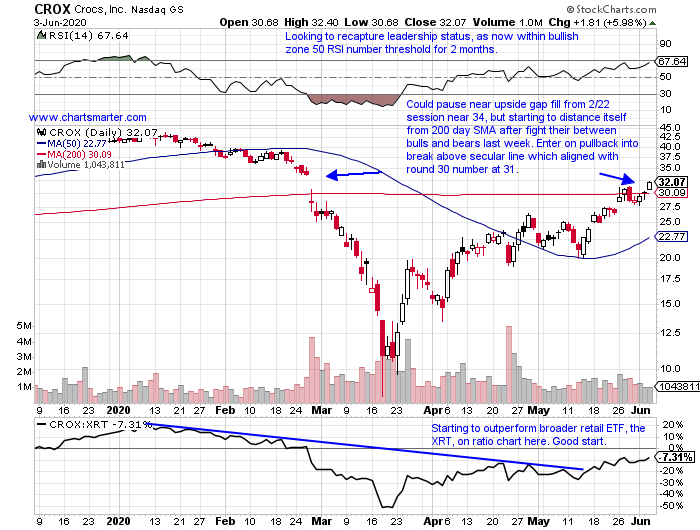
- Footwear play down 23% YTD and higher by 66% over last one year period.
- Slumped 80.8% during 10 week losing streak weeks ending between 1/17-3/20. No higher 7 of the last 10, including huge gains of 67 and 42% weeks ending 3/27 and 4/10.
- Earnings mostly lower with gains of 15.6 and 7% on 10/30 and 8/1/19, and losses of 16,5, 16 and 4.9% on 4/23, 2/27 and 5/7/19.
- Enter on pullback into recent break above 200 day SMA.
- Entry CROX 31. Stop 28.75.
Good luck.
Entry summaries:
Buy gap fill BYND 130. Stop 118.
Buy pullback into recent bullish ascending triangle breakout BUD 52.50. Stop 48.
Buy pullback into 200 day SMA CROX 31. Stop 28.75.
This article requires a Chartsmarter membership. Please click here to join.
David Versus Goliath:
- We have spoke in the past about the more concentrated XLY compared to that of the much more diverse XRT. Being in the right names can really give an investors a strong return if concentrated. The phrase comes to mind, "concentration builds wealth, while diversification preserves it". Half of the XLY is represented by just its FOUR top components in AMZN, HD, MCD and NKE. In the XRT AMZN is the fifth largest holding at just more than 2%, while in the XLY it is one quarter of the fund. The XRT is home to some of the smaller cap names too, and perhaps it could benefit from the recent robust move in the Russell 2000. Below is the WEEKLY chart of the XRT, and it is back into a long tight range it traded prior to March. From long consolidations often come sharp moves and this one was certainly to the downside. I wonder how the XRT chart would look if its top 3 holdings, say STMP CHWY and ETSY (all 3 are in top 5 holdings at about 2.5%) had the same weighting as the XLY.
Lyft Chart "Lifting":
- Ratio charts are always a good way to compare two instruments to each other to see where capital should be allocated. One can do it by contrasting individual stocks, or stocks to a specific sector ETF. Below we look at the ratio chart of UBER against its peer LYFT. Notice the strong, obvious outperformance for UBER, as the company name has become a verb, much like ZM. Uber now trades 22% off most recent 52 week highs, while LYFT is 49% off its most recent yearly peak. Looking at other returns UBER is higher by 21% YTD, while LYFT is LOWER by 19%. Keep in mind ratio charts show strength against one another, on a relative basis, and is does not mean that both can not be well on an absolute basis. LYFT did break out today above a bullish ascending triangle pivot of 34, but it still trades well below its 200 day SMA, and you know the old saying "nothing good happens below the 200 day". UBER in my opinion still deserves your capital, and on a WEEKLY chart is inching toward to 41.96 double bottom pivot.
Recent Examples:
- Consumers are yearning to get outdoors and enjoy the fresh air. We could witness that with the action in stocks like WGO CWH and PII to name a few. All three of those name well more than doubled from their March lows. Another name that is catching some love is the chart of YETI below, and how it appeared in our 5/22 Consumer Note. It is higher 8 of the last 9 weeks, and moving north once again this week to the tune of 6% so far (the one declining week ending 5/15 fell 7.4% on the strongest ever WEEKLY volume, but did manage to CLOSE in the upper half of the WEEKLY range). On its WEEKLY chart one would see it is approaching an area in the upper 30s which gave the name a bit of a pushback twice in 2019 and again in the beginning of 2020. It is now flirting with a cup with handle pivot of 34.11. This name looks like its on firm ground.
Special Situations:
- Food products play higher by 78% YTD and 40% over last one year period.
- Higher 6 of the last 8 weeks, with 2 of the WEEKLY advances rising more than 40%. Nice double bottom in mid 40s weeks ending 5/3/19 and 3/20. Still 44% off most recent 52 week highs.
- Last earnings reaction higher by 26%, after three straight losses of 15.5, 22.2 and 12.3% on 2/28, 10/29 and 7/30/19.
- Enter on pullback into potential gap fill.
- Entry BYND 130. Stop 118.
- Belgian brewing laggard lower by 34% YTD and over last one year period. Dividend yield of 2.6%.
- Massive move lower after rejection at very round par number last summer, falling 26 of 34 weeks ending between 8/2/19-3/20. This week following through powerfully up 16%, after prior week jumped 14.6%.
- Three consecutive negative earnings reactions down .5, 9.2 and 10.7% on 5/7, 2/27 and 10/25/19 (rose 4.1% on 7/25/19).
- Buy pullback into break above bullish ascending triangle/round 50 number.
- Entry BUD 52.50. Stop 48.
- Footwear play down 23% YTD and higher by 66% over last one year period.
- Slumped 80.8% during 10 week losing streak weeks ending between 1/17-3/20. No higher 7 of the last 10, including huge gains of 67 and 42% weeks ending 3/27 and 4/10.
- Earnings mostly lower with gains of 15.6 and 7% on 10/30 and 8/1/19, and losses of 16,5, 16 and 4.9% on 4/23, 2/27 and 5/7/19.
- Enter on pullback into recent break above 200 day SMA.
- Entry CROX 31. Stop 28.75.
Good luck.
Entry summaries:
Buy gap fill BYND 130. Stop 118.
Buy pullback into recent bullish ascending triangle breakout BUD 52.50. Stop 48.
Buy pullback into 200 day SMA CROX 31. Stop 28.75.